
GCMAsia - EURUSD

EURUSD
2017-09-07
| Resistance and Support | Level | Explanation |
| Resistance | 1.1970 | H4 |
| Support | 1.1915 | H4 |
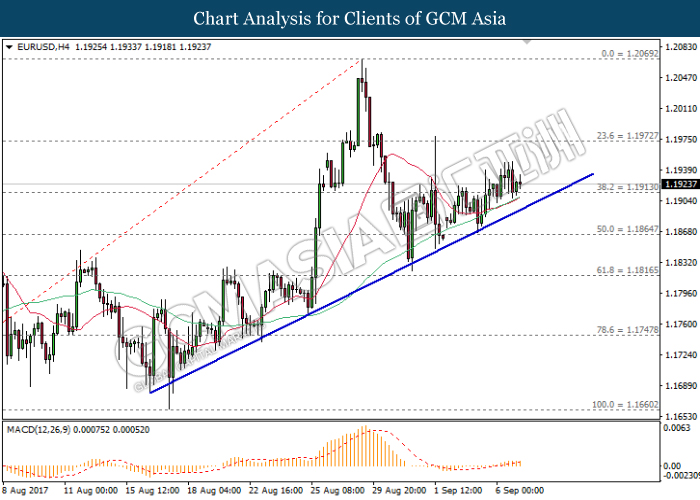
EURUSD, H4: EURUSD remains traded in an uptrend following prior rebound near the support level of 1.1915. MACD indicator which shows substantial upward signal suggests further upside bias for EURUSD to advance towards the next target at 1.1970.
Resistance level: 1.1970, 1.2070
Support level: 1.1915, 1.1865