11 September 2017 Weekly Analysis
GCMAsia Weekly Report: September 11 – 15
Market Review (Forex): September 4 – 8
U.S. Dollar
US dollar slumped to fresh two-and-a-half-year low against other major currencies on Friday amid growing doubts over Federal Reserve ability to raise interest rates by year end. The dollar index depreciates by 0.20% to 91.31 during late Friday trading after touching a trough of 90.99 earlier. For the week, the index has pared its gains by 1.55%, notching its largest decline since late June.
Overall prospect towards the US dollar were further catalyzed following heightened geopolitical tension with North Korea and recent chain of hurricanes in the southeastern area of US. Likewise, market concern over the political turmoil in Washington has further contributed to the overall pessimism that surrounds the currency.
USD/JPY
Against the Japanese Yen, USD/JPY tumbled to a 10-months low of 107.32 before consolidating to 107.81 in a late Friday trading.
EUR/USD
Pair of EUR/USD extended gains by 0.12% while last seen around $1.2036. The demand for the single currency was further underpinned after European Central Bank President Mario Draghi indicated that they may start tapering its massive stimulus program in autumn this year.
GBP/USD
Pound sterling rose to a five-weeks high of $1.3195 against the US dollar, underpinned by better-than-expected UK manufacturing output growth for the month of July.
Market Review (Commodities): September 4 – 8
GOLD
Gold prices rose to its highest level in a year as the US dollar continued to remain under pressure by dampened prospect for another rate hike within this year. Price of the yellow metal ended the week with 0.15% higher at $1,352.28 while notching its third consecutive weekly gain of 1.56%. Additionally, overall demand for the safe-haven asset was further catalyzed following rising tension between United States and North Korea due to recent nuclear tests in Pyongyang. Market participants would flock to safe haven assets in the event of high risk factors in order to safe guard their capital.
Crude Oil
Crude oil price extended its losses during late Friday trading due to ongoing concern of reduced domestic crude demand as US refinery saw a slow recovery from Hurricane Harvey. Furthermore, its prices remained at the downside bias over the potential impact of Hurricane Irma as it approaches the United States mainland. Its prices sank around $1.61 or 3.3% while ended the week at $47.48 a barrel. Although the instrument has recorded its biggest daily loss since July, its prices however still ended the week with 19 cents or 0.14% of gains.
Over a quarter of US oil refinery hubs were forced to close as hurricane Harvey hits the region along the Gulf Coast. Recent sluggish restart following the incident has contributed to a lower domestic demand for crude oil, which is reflected in a weekly reported released by the US Energy Information Administration. According to EIA, crude inventories rose by roughly 4.6 million barrels last week, exceeding economist consensus for a rise of 4 million barrels.
Likewise, Harvey’s impact was also felt in oil production as oilfield services provider Baker Hughes reported a decline in oil rigs by 3 to a total of 756. However, most analyst postulate that the slowdown in refinery and output would only linger for short-term and should recover sooner than later.
US Crude Oil Stock Change
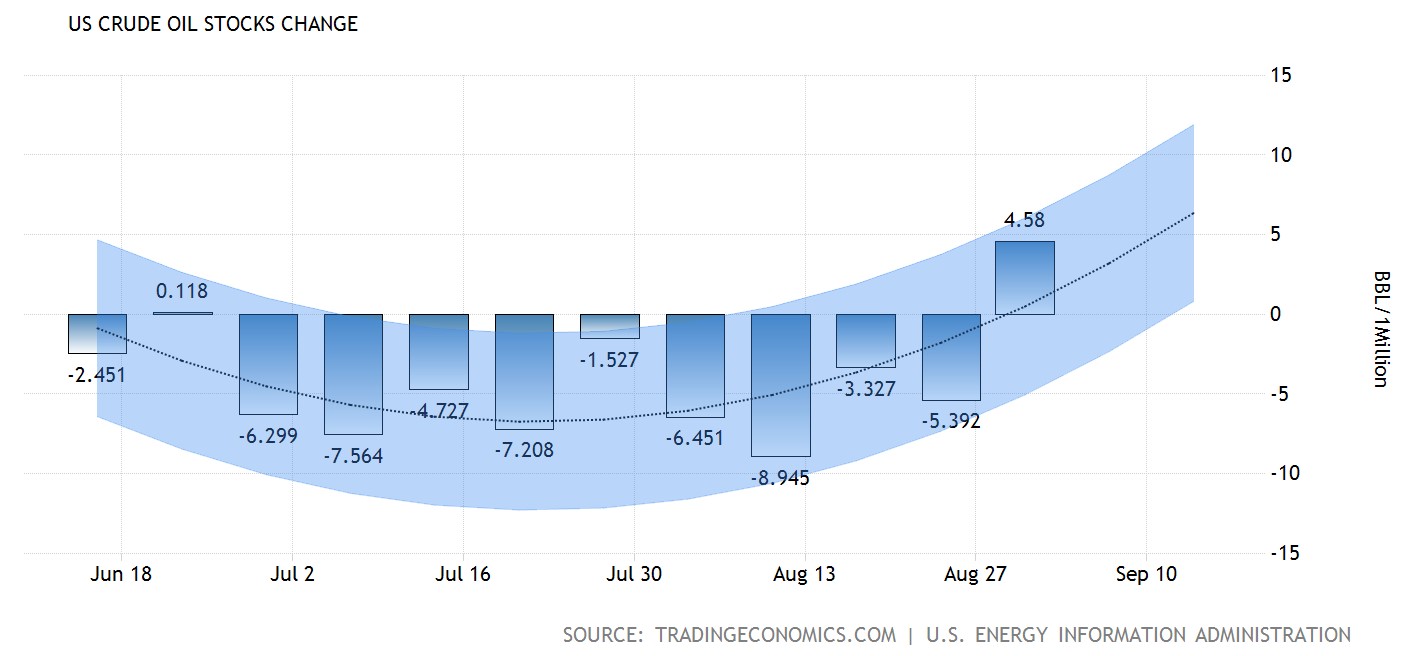
—– Forecast
US crude oil stock rose for the first time in 10 weeks with an unexpected build of 4.58 million barrels.
U.S. Baker Hughes Oil Rig Count
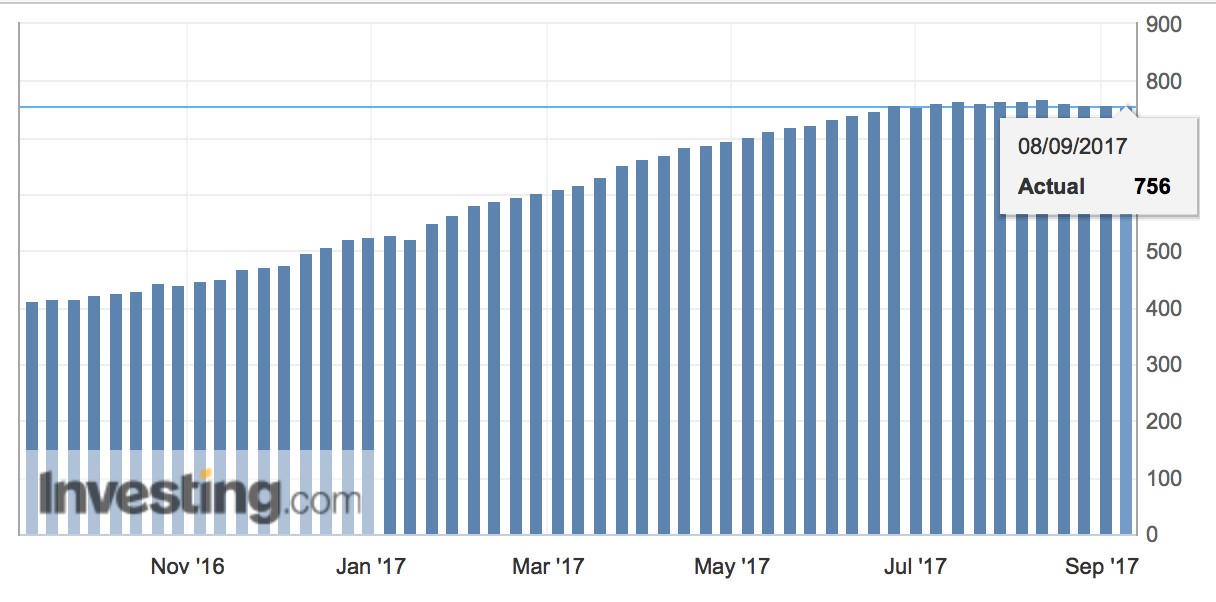
Active drilling rigs in the United States was down by 3 and the total count is currently at 756.
Weekly Outlook: September 11 – 15
For the week ahead, investors will be eyeing on Thursday’s US inflation report for further signals regarding the possible timing of US interest rate hike. Likewise, UK monetary policy announcement by the Bank of England will also remained in focus.
As for oil traders, they will place their attention on monthly reports from Organization of the Petroleum Exporting Countries and International Energy Agency to assess global oil supply and demand levels. These reports could give a better picture to investors regarding global oil rebalancing effort which has taken place since early of the year.
Highlighted economy data and events for the week: September 11 – 15
| Monday, September 11 |
Data JPY – Tertiary Industry Activity Index (MoM) CAD – Housing Starts (Aug)
Events N/A
|
| Tuesday, September 12 |
Data AUD – NAB Business Confidence (Aug) GBP – CPI (YoY) (Aug) USD – JOLTs Job Openings (Jul)
Events CrudeOIL – OPEC Monthly Report
|
| Wednesday, September 13 |
Data CrudeOIL – API Weekly Crude Oil Stock EUR – German CPI (MoM) (Aug) GBP – Average Earnings Index +Bonus (Jul) GBP – Claimant Count Change (Aug) EUR – Industrial Production (MoM) (Jul) USD – PPI (MoM) (Aug) CrudeOIL – Crude Oil Inventories
Events CrudeOIL – IEA Monthly Report
|
| Thursday, September 14 |
Data AUD – Employment Change (Aug) CNY – Industrial Production (YoY) (Aug) CHF – SNB Interest Rate Decision GBP – BoE Interest Rate Decision (Sep) USD – Initial Jobless Claims USD – Core CPI (MoM) (Aug) CAD – New Housing Price Index (MoM) (Jul)
Events CHF – SNB Monetary Policy Assessment GBP – BoE MPC Meeting Minutes
|
|
Friday, September 15
|
Data USD – Core Retail Sales (MoM) (Aug) USD – NY Empire State Manufacturing Index (Sep) USD – Retail Sales (MoM) (Aug) USD – Industrial Production (MoM) (Aug) USD – Michigan Consumer Sentiment (Sep) CrudeOIL – US Baker Hughes Oil Rig Count
Events N/A
|
Technical weekly outlook: September 11 – 15
Dollar Index
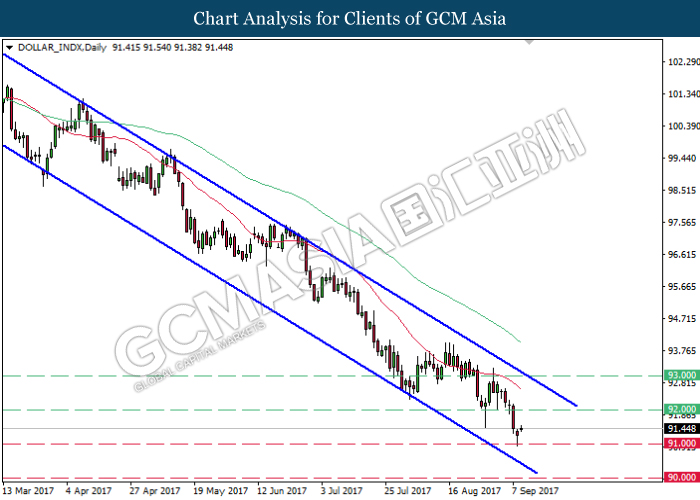
DOLLAR_INDX, Daily: The dollar index extended its losses within the downward channel following prior closure below 92.00. Recent rebound from the support level of 91.00 suggests short-term upside bias to retest at the threshold of 92.00. Otherwise, long-term trend direction remains skewed towards the downside.
Resistance level: 92.00, 93.00
Support level: 91.00, 90.00
GBPUSD
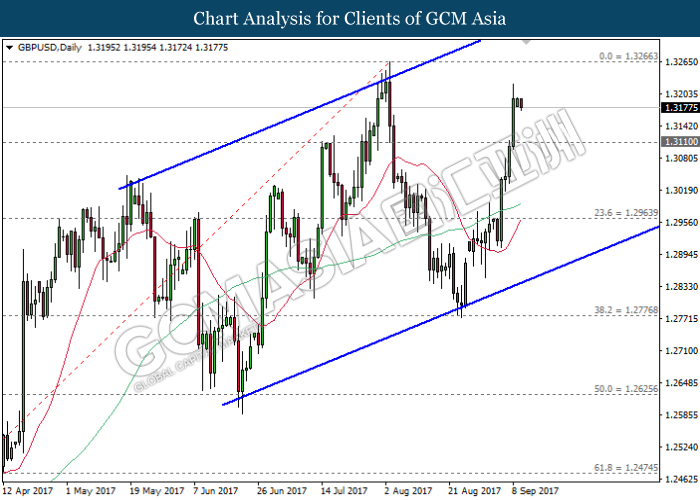
GBPUSD, Daily: GBPUSD remains traded within an upward channel following prior rebound near the bottom level of the channel. Both MA lines which continues to narrow upwards suggests GBPUSD to extend its gains towards the next target at 1.3265.
Resistance level: 1.3265, 1.3450
Support level: 1.3110, 1.2965
USDJPY
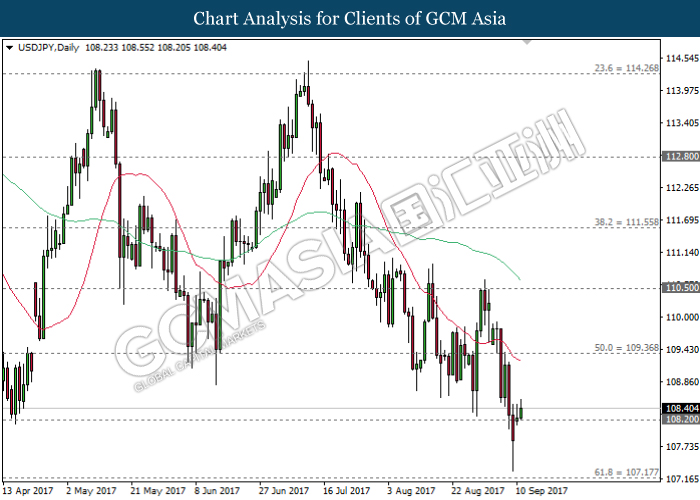
USDJPY, Daily: USDJPY was traded higher following prior rebound near the support level of 107.75. Recent price action suggests USDJPY to be traded higher in short-term as technical correction. Otherwise, long-term trend direction skew towards the downside bias as both MA lines continues to expand downwards.
Resistance level: 109.40, 110.50
Support level: 108.20, 107.15
EURUSD
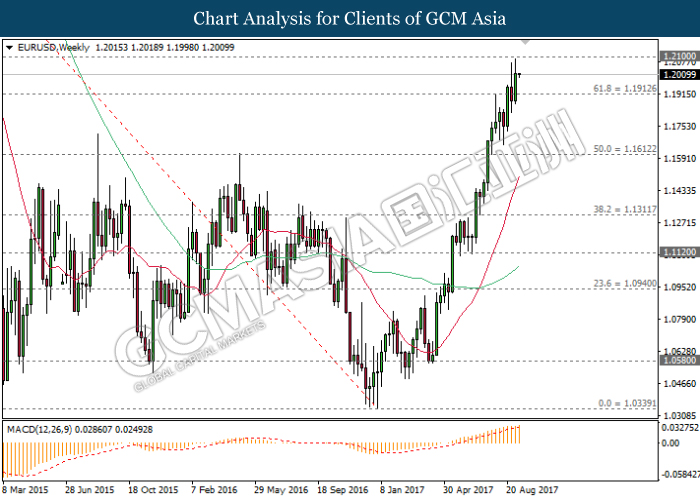
EURUSD, Weekly: EURUSD extended its uptrend following prior closure above the resistance level of 1.1915. MACD indicator which continues to illustrate increasing upward momentum suggests EURUSD to advance further up and retest near previous high of 1.2100.
Resistance level: 1.2100, 1.2340
Support level: 1.1910, 1.1610
GOLD
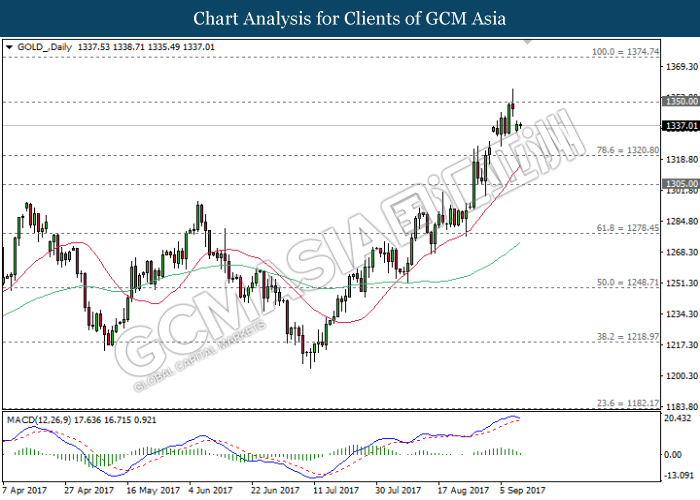
GOLD_, Daily: Gold price opened with a gap following prior retracement from the resistance level of 1350.00. MACD histogram which illustrate diminishing upward momentum suggests gold price to be traded lower in short-term as technical correction. First target will be referring to 1320.80.
Resistance level: 1350.00, 1374.75
Support level: 1320.80, 1305.00
Crude Oil
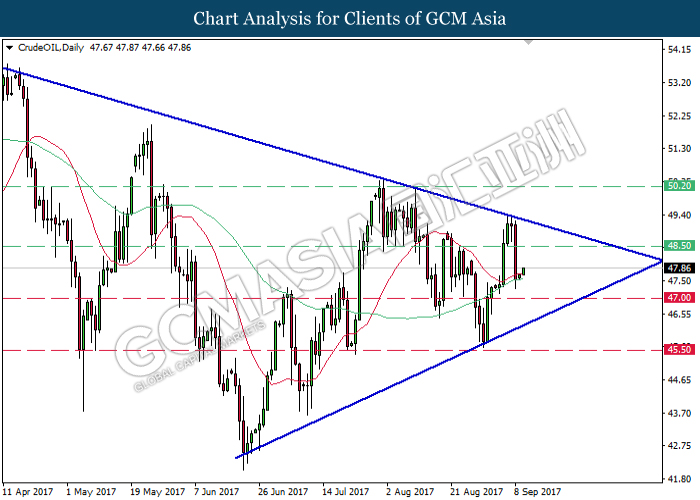
CrudeOIL, Daily: Crude oil price remains traded within a narrowing triangle while recently rebounded near the 60-MA line (green). A closure above the 20-MA line (red) would suggests crude oil price to advance further up, towards the next target at 48.50.
Resistance level: 48.50, 50.20
Support level: 47.00, 45.50