16 October 2017 Weekly Analysis
GCMAsia Weekly Report: October 16 – 20
Market Review (Forex): October 9 – 13
U.S. Dollar
Greenback ended mixed during last Friday following mixed inflationary data which has further cloud investors outlook for another rate hike by the Federal Reserve in December. The dollar index was last quoted around 93.62 during late trading after recovering from two-weeks low of 92.59.
For the month of August, consumer prices came in with a positive reading of 0.5%, its largest increase within eight months but missing expected forecast of 0.6%. The data was well supported by rising gasoline prices after hurricanes hit the southern coast of US. In spite of that, overall core inflation remained subdued with only 0.1% versus 0.2% seen, showing a still-sluggish inflationary pressure as commented by some Federal Reserve members in the September’s meeting minutes.
In terms of consumer spending, core retail sales which excludes purchases of automobiles came in with 1.0%, signaling a persistent pickup while recording its largest increase in more than 7 months. Although the pickup in spending remains optimistic, it has pose a major question to the Fed with its diminished inflationary pressure that are not supported by the prior; thus, exerting to monitor further economic data before initiating any changes to the monetary policy. According to the Fed Rate Monitor Tool, market probability for a rate hike in December retreats from 87.8% to 82.7% following the release of the data.
US Core Consumer Price Index
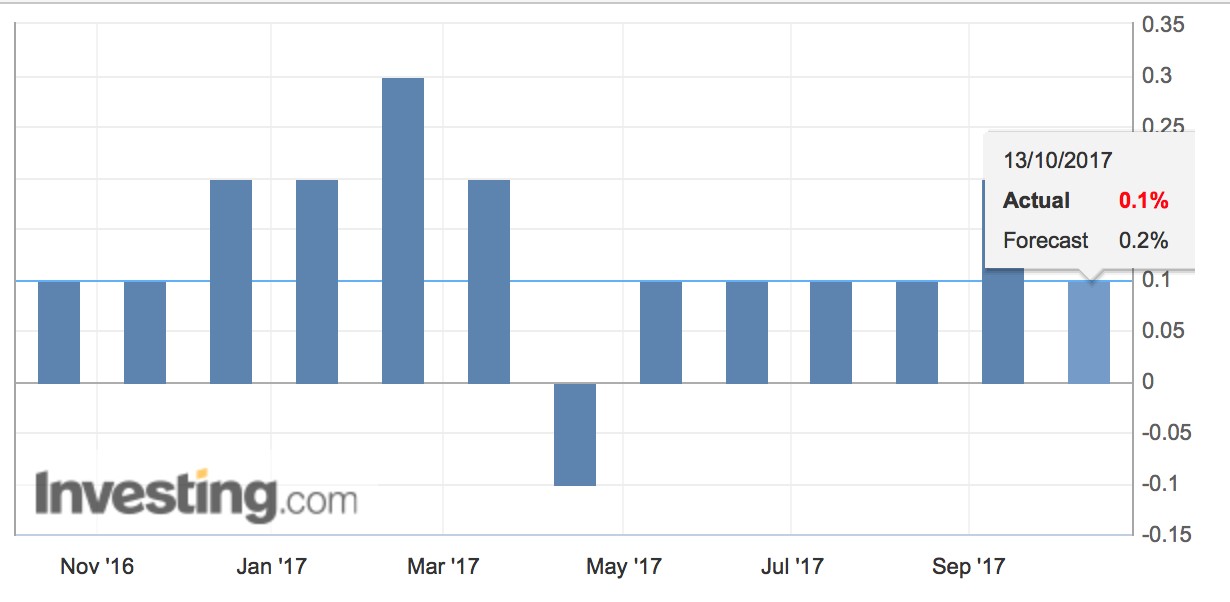
US Core Consumer Price Index which excludes food and energy came in at only 0.1% versus forecast of 0.2%.
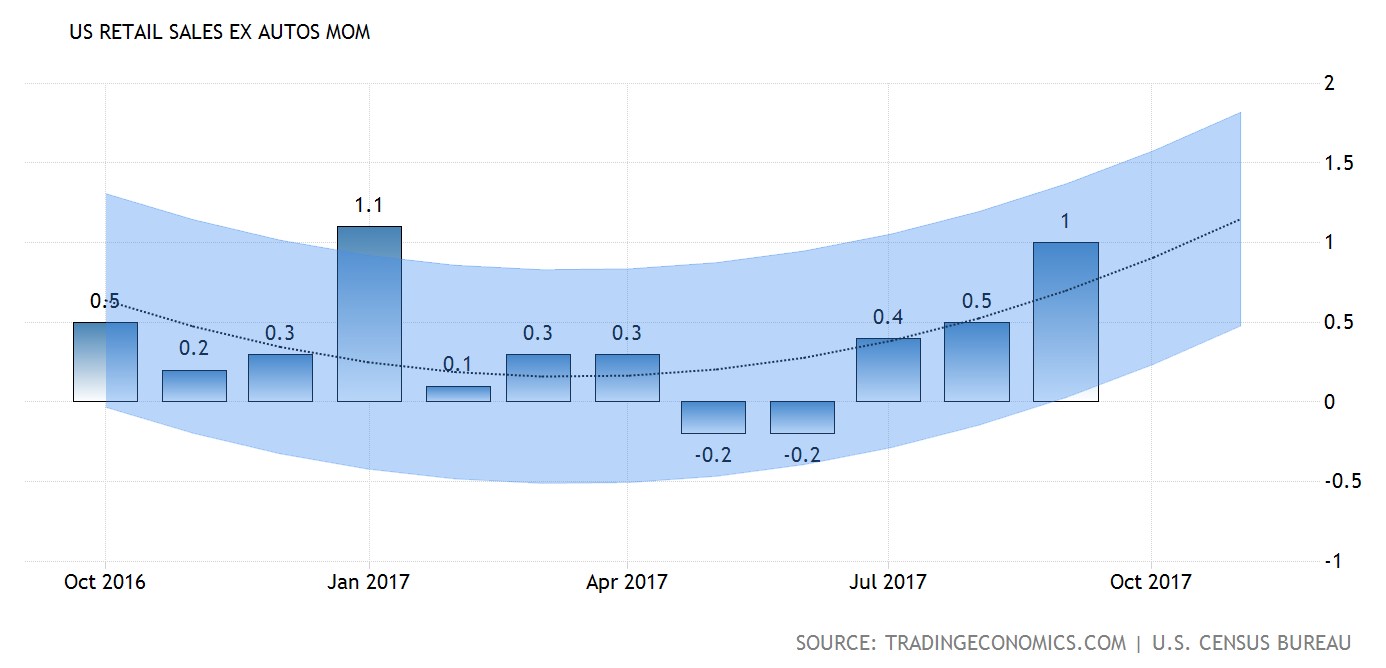
US Retail Sales Ex. Automobiles (Core)
—– Forecast
US Core Retail Sales which excludes automobiles came in around 1.0%, its largest gain in seven months.
Fed Rate Monitor Tool
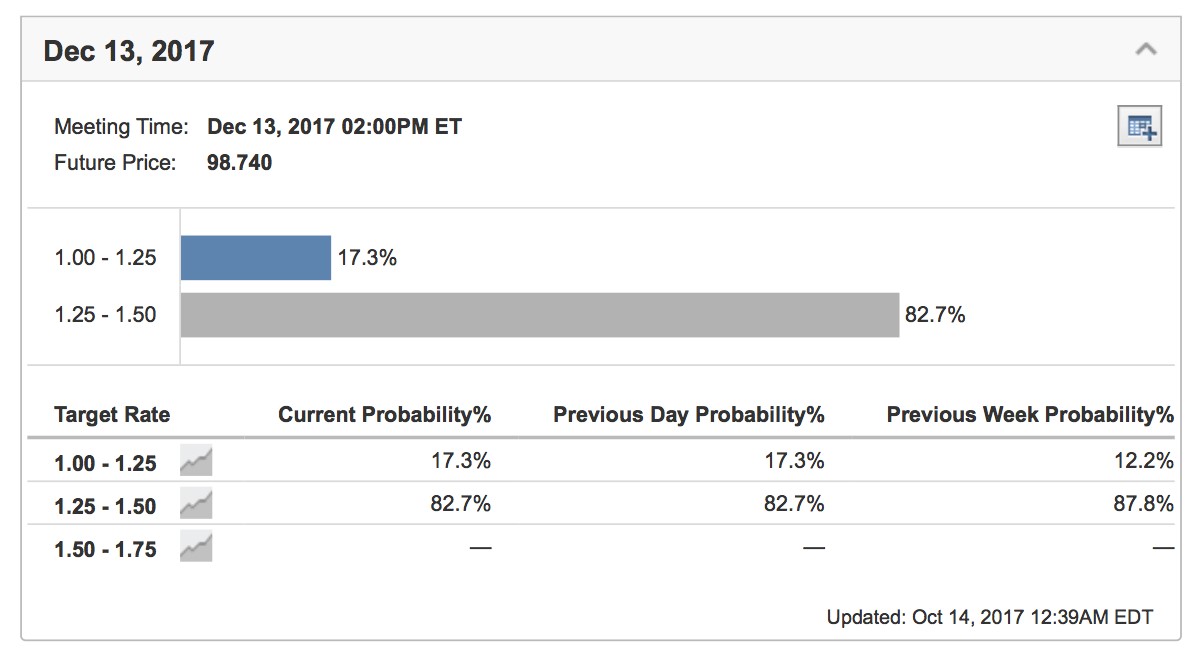
US Fed Rate Monitor Tool shows diminished probability for a rate hike in December from 87.8% to 82.7%.
USD/JPY
Dollar ended lower against the safe-haven Yen, down 0.43% to 111.80.
EUR/USD
Euro dipped to a session low of $1.1822 against the greenback after European Central Bank President Mario Draghi said that the euro zone still requires substantial monetary stimulus as inflation remains subdued.
GBP/USD
Sterling gained amid higher hopes that Britain could be offered a two-year transition to divorce from the EU economic bloc. GBP/USD rose 0.20% to $1.3287 while ended the week with 1.70% gain.
Market Review (Commodities): October 9 – 13
GOLD
Safe haven asset gold gained some demand on Friday following the release of mixed US inflation data which has added doubts over Federal Reserve’s ability to raise interest rates one more time before the year-end. Price of the yellow metal spikes up by 0.69% while ended the week with 2.03% gains at $1,305.40.
The data was in line with Federal Reserve’s September meeting minutes which highlighted that recent sluggishness in inflationary pressure may not be transitory. A lower expectation towards rate hike by year end will lift investors prospect towards bullion as higher rates environment could lift the opportunity cost for holding the asset which is non-yielding.
Crude Oil
Crude oil price settled higher on Friday as geopolitical uncertainty in the Middle East raised higher possibility for a supply disruption to occur. Its prices settled up 85 cents or 1.70% to a two-weeks high of $51.45 a barrel, its best close since October 2nd. For the week, its prices have gained around 4.4%, its largest within a month.
Within economist expectation, US President Donald Trump on Friday decided to go against certifying the 2015 Iran nuclear agreement, raising the risk of doing business in the oil-rich Middle Eastern nation whom are also a member of OPEC. Meanwhile, the ongoing unrest in Iraq following an independence referendum in Iraq’s Kurdistan region last month has raised domestic threats to disrupt the operation of pipeline in the region that carries around 500,000 – 600,000 barrels of crude per day.
Moreover, its prices were further supported after China’s import blow past economist expectation in September and expands at a healthy pace despite widespread speculation for an eventual and gradual slowdown. Furthermore, overall bullish sentiment was further catalyzed as US crude stockpiles falls for its third consecutive week in a row due to strong domestic demand.
Despite multiple bullish signal in the market, analyst warned that the OPEC may need to extend its agreement beyond March 2018 expiry date in order to yield significant results in rebalancing global oil supply and demand. The original deal which were stuck nearly a year ago failed to portray an eventual sign of supply reduction as non-participating nations such as Libya, Nigeria and United States continues to ramp up their daily crude production.
Weekly Outlook: October 16 – 20
For the week ahead, investors will be focusing on US housing sector data to assess the economic impact of hurricanes which has struck its southern region last month. Otherwise, inflation report from the UK will be kept in view amid higher chances for an interest rate hike by the Bank of England due to soaring inflation.
In the Canadian region, Friday’s release of inflation data would also be scrutinized by market participants to gauge the timing of next interest rate hike by the Bank of Canada.
As for oil traders, they will be eyeing on US inventories level reported by API and EIA to gauge the strength of crude demand for world’s largest oil consumer.
Highlighted economy data and events for the week: October 16 – 20
| Monday, October 16 |
Data CNY – CPI (YoY) (Sep) CNY – PPI (YoY) (Sep) EUR – Trade Balance (Aug) USD – NY Empire State Manufacturing Index (Oct) USD – Federal Budget Balance (Sep)
Events N/A
|
| Tuesday, October 17 |
Data NZD – CPI (QoQ) (Q3) GBP – CPI (YoY) (Sep) EUR – German ZEW Economic Sentiment (Oct) EUR – CPI (YoY) (Sep) USD – Import Price Index (MoM) (Sep) USD – Industrial Production (MoM) (Sep)
Events AUD – RBA Meeting Minutes GBP – BoE Gov Carney Speaks USD – FOMC Member Harker Speaks
|
| Wednesday, October 18 |
Data CrudeOIL – API Weekly Crude Oil Stock AUD – NAB Quarterly Business Confidence GBP – Average Earnings Index +Bonus (Aug) GBP – Claimant Count Change (Sep) USD – Building Permits (Sep) USD – Housing Starts (MoM) (Sep) CAD – Manufacturing Sales (MoM) (Aug) CrudeOIL – Crude Oil Inventories
Events EUR – ECB President Draghi Speaks USD – FOMC Member Dudley Speaks USD – FOMC Member Kaplan Speaks
|
| Thursday, October 19 |
Data AUD – Employment Change (Sep) CNY – GDP (YoY) (Q3) CNY – Industrial Production (YoY) (Sep) GBP – Retail Sales (MoM) (Sep) USD – Initial Jobless Claims USD – Philadelphia Fed Manufacturing Index (Oct)
Events USD – FOMC Member George Speaks
|
|
Friday, October 20
|
Data GBP – Public Sector Net Borrowing (Sep) CAD – Core CPI (MoM) (Sep) CAD – Core Retail Sales (MoM) (Sep) USD – Existing Home Sales (Sep) CrudeOIL – US Baker Hughes Oil Rig Count
Events USD – FOMC Member Mester Speaks
|
Technical weekly outlook: October 16 – 20
Dollar Index
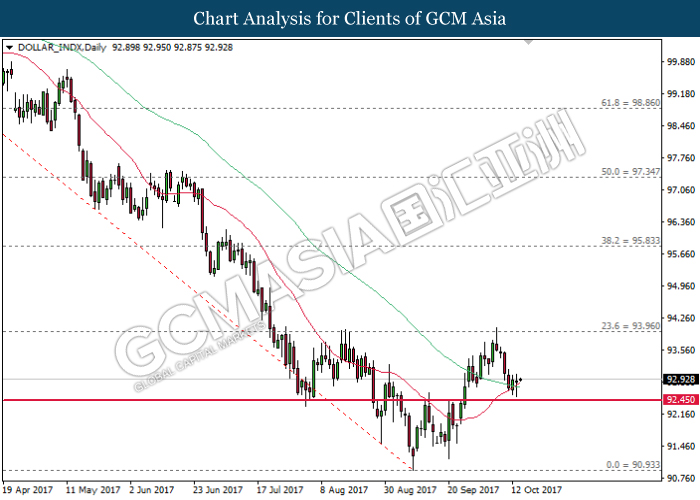
DOLLAR_INDX, Daily: Dollar index pared some losses following prior rebound from the support level of 92.45 while closing above the 20-MA line (red). Recent formation of golden cross by both MA lines suggests further upside bias for the index. Thus, a rebound near the 20-MA line would suggest the dollar index to extend its gains towards the recent resistance at 93.95.
Resistance level: 93.95, 95.85
Support level: 92.45, 90.95
GBPUSD
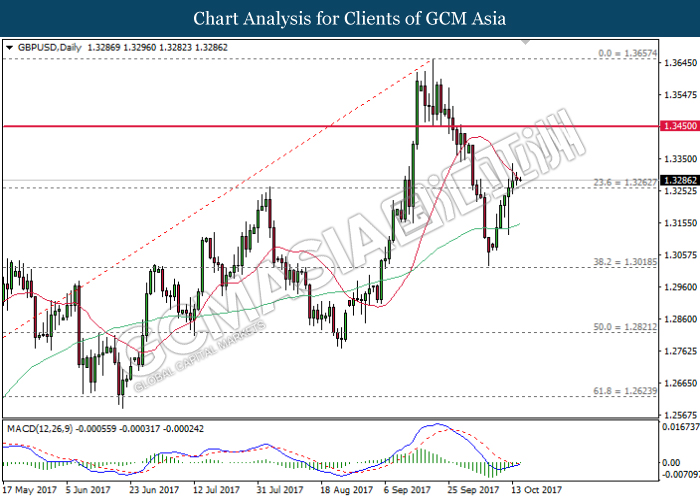
GBPUSD, Daily: GBPUSD was traded higher following prior rebound near the support level of 1.3020 while currently testing at the 20-MA line (red). MACD histogram which shows diminishing downward signal and imminent formation of golden cross suggests the pair to advance further upwards after successfully closing above the 20-MA line (red).
Resistance level: 1.3450, 1.3655
Support level: 1.3260, 1.3020
USDJPY
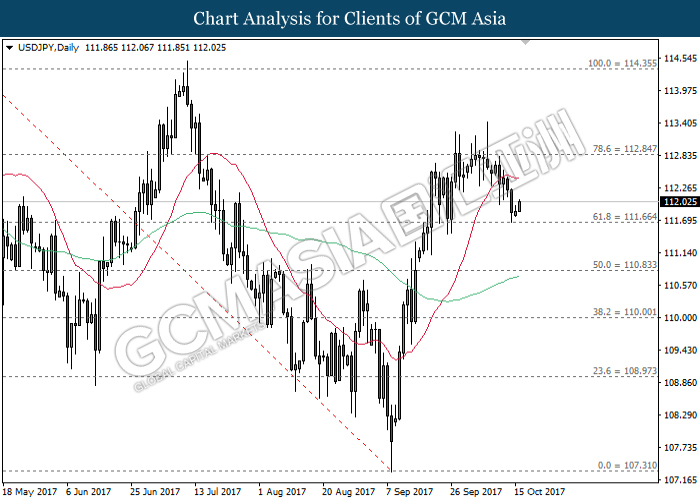
USDJPY, Daily: USDJPY pared some losses following a rebound from the strong support level at 111.65. Such price action suggests further bullish bias for the pair to extend its upward momentum towards the first target at 20-MA line (red) followed by the resistance level at 112.85.
Resistance level: 112.85, 114.35
Support level: 111.65, 110.85
EURUSD
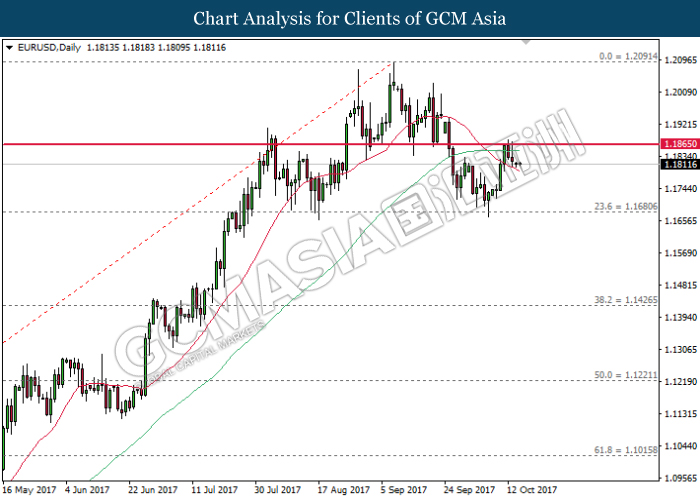
EURUSD, Daily: EURUSD was traded lower following prior retracement from the resistance level of 1.1865. Current bearish bias suggests the pair to extend its losses towards the next target at 1.1680 after a successful closure below the 20-MA line (red).
Resistance level: 1.1865, 1.2090
Support level: 1.1680, 1.1425
GOLD
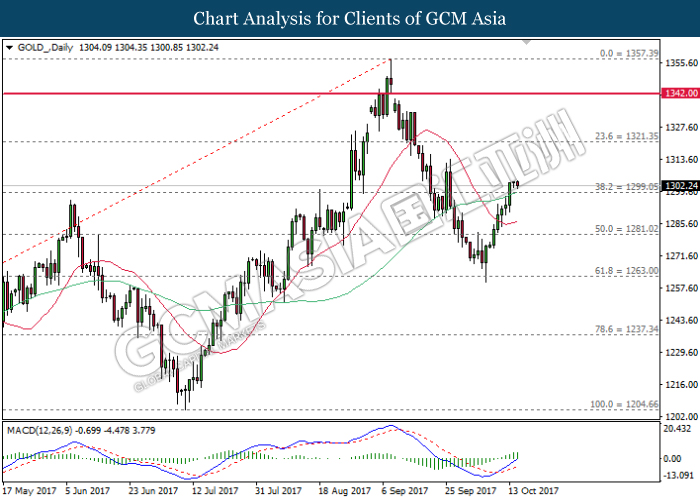
GOLD_, Daily: Gold price extended its gains following prior rebound from the support level of 1263.00 while recently closed above 60-MA line (green). Signal line from MACD histogram which continues to expand upwards suggest the commodity price to advance further upwards towards the next target at 1321.35.
Resistance level: 1321.35, 1342.00
Support level: 1299.05, 1281.00
Crude Oil
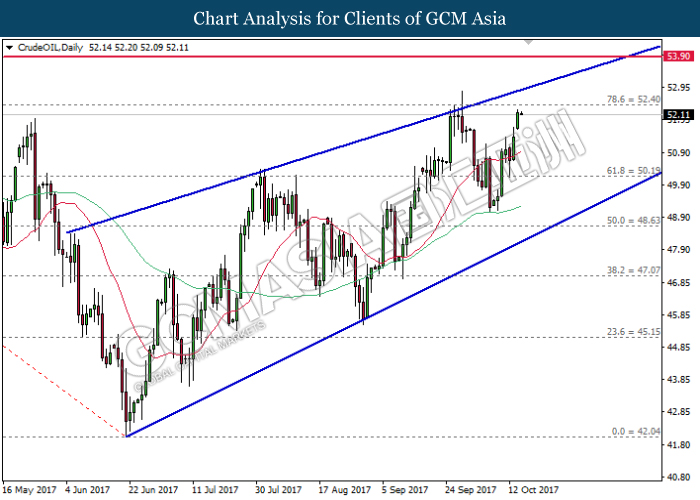
CrudeOIL, Daily: Crude oil price remained traded within a rising wedge while recently opened lower near the resistance level of 52.40. A retracement from this level would suggest short-term downside bias for the commodity price to advance towards the first target at 50.20.
Resistance level: 52.40, 53.90
Support level: 50.20, 48.65