20 October 2017 Daily Analysis
Dollar high on tax reform while Catalonia sinks EU.
US dollar received bullish support across the board on Friday after news hit the wires that US Senate has passed the 2018 budget blueprint which will open doors for Republican tax reform effort. The dollar index was quoted up 0.26% to 93.33. The passage which saw a 51-49 vote to pass the budget is one of the first steps taken to inch closer towards legalizing the bill which will allow tax cuts up to $1.5 trillion for the next decade. Overall higher optimism sparked by the news has further supported the US Treasury which was seen with a steeper yield curve of up to 79 basis points. Likewise, overnight duo of upbeat economic data which compromises of jobless claims in Philly Fed Manufacturing Index were also seen to support the further upside of greenback. On the other hand, EUR/USD extended its losses by 0.35% to $1.1810 amid higher geopolitical risk in the region. The central government of Spain postulate on Thursday that they will suspend Catalonia’s autonomy and impose direct rule after the region’s leader Carles Puigdemont threatens to push for formal independence declaration if official talks were refused.
In the commodities front, crude oil price was narrowly mixed in Asia after adding up 0.14% to $51.36 as investors look ahead to OPEC’s meeting today for an update on the progress of production cuts and possible hints of extending the agreement. As for gold, price of the yellow metal shed 0.48% to $1,283.52 amid higher demand for the greenback this morning.
Today’s Holiday Market Close
Time Market Event
N/A
Today’s Highlight Events
Time Market Event
02:00 (Sat) USD FOMC Member Mester Speaks
07:30 (Sat) USD Fed Chair Yellen Speaks
Today’s Highlight Economy Data
| Time | Nation & Data | Previous | Forecast | Actual |
| 16:30 | GBP – Public Sector Net Borrowing (Sep) | 5.09B | 5.70B | – |
| 20:30 | CAD – Core CPI (MoM) (Sep) | 0.0% | – | – |
| 20:30 | CAD – Core Retail Sales (MoM) (Aug) | 0.2% | 0.3% | – |
| 22:00 | USD – Existing Home Sales (Sep) | 5.35M | 5.30M | – |
| 01:00 | CrudeOIL – US Baker Hughes Oil Rig Count | 743 | – | – |
GBPUSD
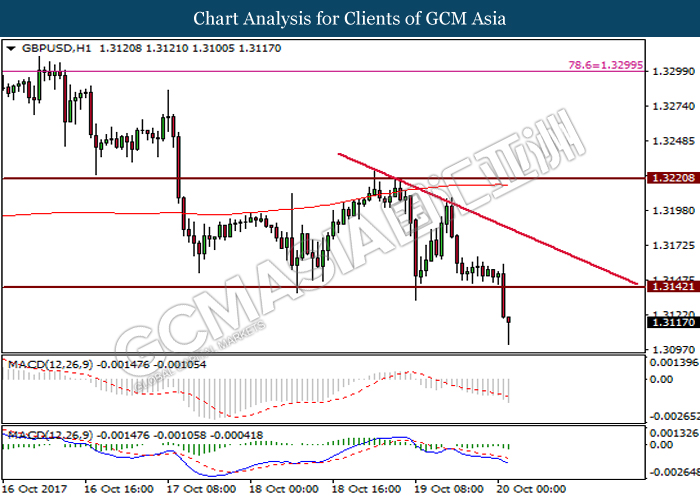
GBPUSD, H1: GBPUSD was traded lower prior breaking support level at 1.3140. Successful closure below the said support level and downslope of MACD signal line suggest GBPUSD to extend its losses toward the next support level at 1.3065.
Resistance level: 1.3140, 1.3220
Support level: 1.3065, 1.3020
EURUSD
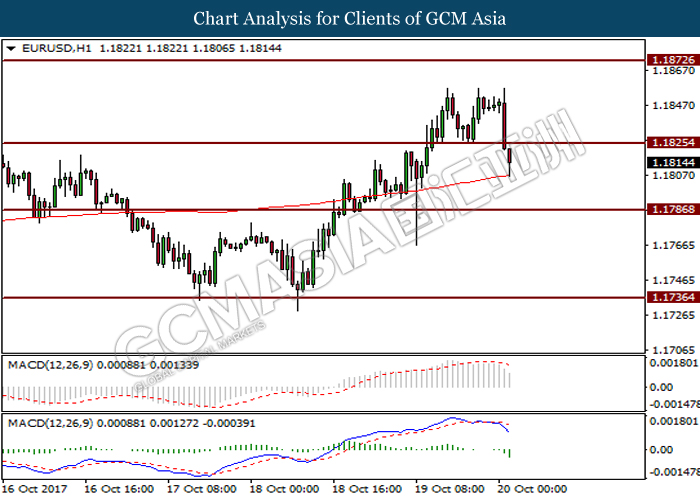
EURUSD, H1: EURUSD was traded lower after breaking support level at 1.1825. Successful closure of candlestick below the said support level and increasing bearish MACD histogram suggest the pair to extend losses toward support by 200-MA line.
Resistance level: 1.1870, 1.1905
Support level: 1.1785, 1.1735
USDJPY
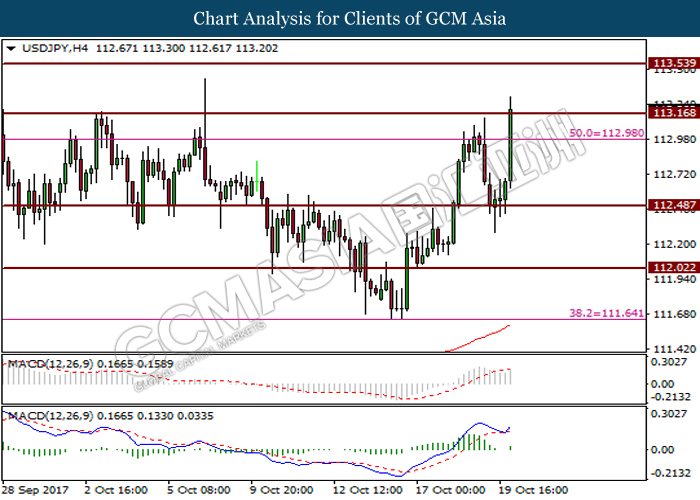
USDJPY, H4: USDJPY was traded higher after breaking resistance level at 113.00. The pair is currently testing the next resistance level at 113.15. Golden-cross as formed by MACD signal line suggest the pair to trade higher if breakout of the said resistance level is successful.
Resistance level: 113.15, 113.55
Support level: 112.50, 112.00
CrudeOIL
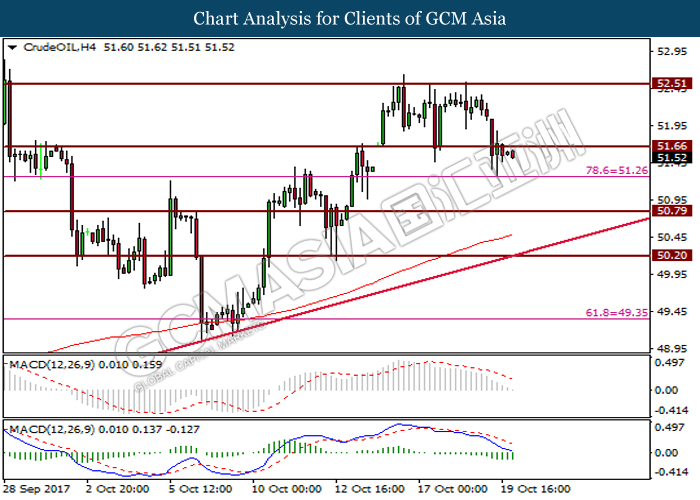
CrudeOIL, H4: Crude oil price was traded lower after breaking below support level at 51.65. Increasing bearish momentum as shown by MACD histogram suggest crude oil price to extend its losses toward the next support level at 51.25.
Resistance level: 51.65, 52.50
Support level: 51.25, 50.80
GOLD
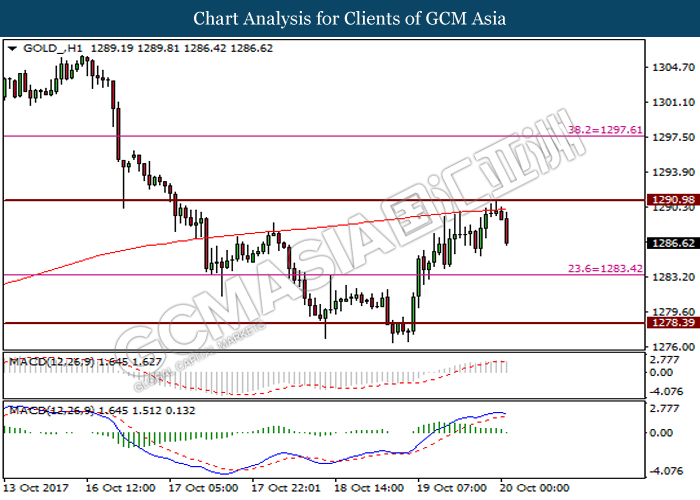
GOLD_, H1: Gold price was traded lower prior retracement from resistance level at 1291.00 and resistance by 200-MA line. Formation of death-cross by MACD signal line suggests gold price to undergo short-term technical correction to trade lower toward the support level at 1283.45.
Resistance level: 1291.00, 1297.60
Support level: 1283.45, 1278.40