27 October 2017 Daily Analysis
Euro plunged as Draghi releases its doves.
Euro extended its losses on Friday during Asian trading hours by 0.15% to $1.1635 against the Greenback amid dovish remark from European Central Bank (ECB) President Mario Draghi. As widely expected by most investors, ECB has announced to taper its major quantitative easing program, in accordance with the current economic performance. The asset purchase program was reduced from a monthly volume of EUR 60bn to EUR 30bn while the duration of bond purchasing program was extended for another nine months until September 2018. However, Draghi also issued a dovish statement which stated that while the economic outlook has improved considerably and the ECB is increasingly optimistic on developments in the areas of investment and in particular job creation, there is still no commitment to an end date for net-asset purchases. Depending on ongoing stimulus, the QE program may be extended in size or duration if necessary. The ECB’s stock of purchases and accommodation policy rate will also be maintained until after September 2018. On the other hand, US dollar rose 0.19% to 94.65, its highest level in three months following bearish pressure on the single common currency – Euro.
In the commodity market, crude oil prices remained mixed and traded at $52.63/barrel prior to the imminent release of U.S. oil rig count data while investors remained cautious as OPEC member and major producer Venezuela reportedly faces problems with making payments of $985 million on bonds issued to the state oil company Petroleos de Venezuela SA (PDVSA). On the other hand, gold price extended its losses by 0.05% to $1266.91 a troy ounce following a surge in the Greenback.
Today’s Holiday Market Close
Time Market Event
N/A
Today’s Highlight Events
Time Market Event
N/A
Today’s Highlight Economy Data
| Time | Nation & Data | Previous | Forecast | Actual |
| 07:30 | JPY – National Core CPI (YoY) (Sep) | 0.7% | 0.8% | 0.7% |
| 07:30 | JPY – Tokyo Core CPI (YoY) (Oct) | 0.5% | 0.5% | 0.6% |
| 20:30 | USD – GDP (QoQ) (Q3) | 3.1% | 2.6% | – |
| 20:30 | USD – Real Consumer Spending (Q3) | 3.3% | 2.2% | – |
| 22:00 | USD – Michigan Consumer Sentiment (Oct) | 101.1 | 100.8 | – |
| 01:00 | CrudeOIL – US Baker Hughes Oil Rig Count | 736 | – | – |
GBPUSD
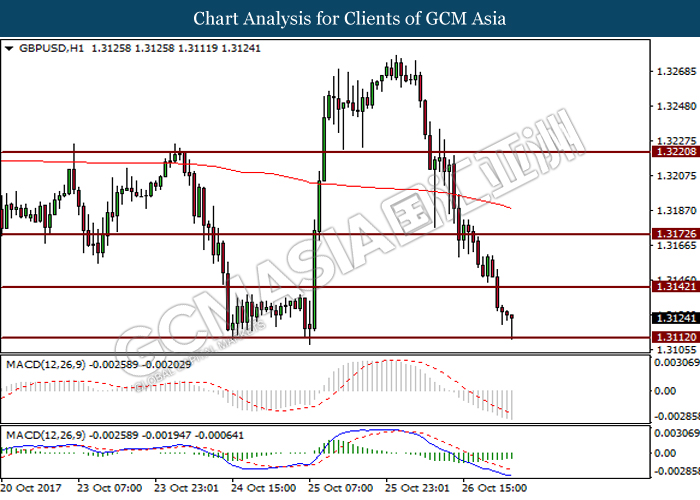
GBPUSD, H1: GBPUSD was traded higher prior rebound from support level at 1.3115. Formation of pin bar candlestick and upward slope of MACD histogram suggest the pair to undergo short-term technical correction to trade higher toward the resistance level at 1.3140.
Resistance level: 1.3140, 1.3170
Support level: 1.3115, 1.3060
EURUSD
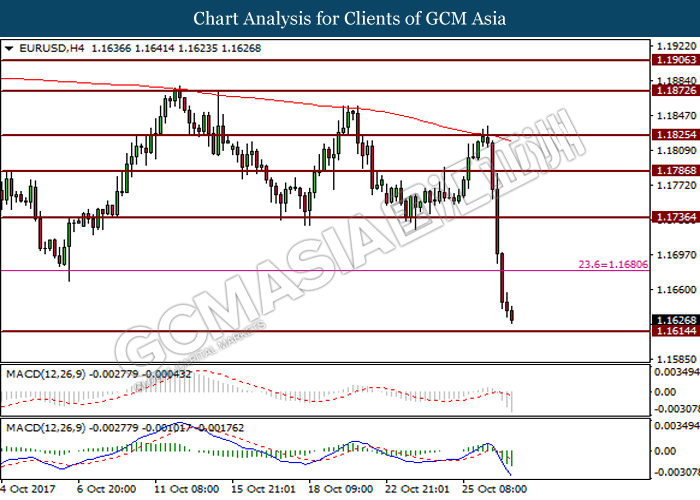
EURUSD, H4: EURUSD was traded lower after breaking support level at 1.1680. Bearish arrangement of candlesticks and MACD histogram that shows increasing downward momentum suggest the pair to extend losses toward the next support level at 1.1615.
Resistance level: 1.1680, 1.1735
Support level: 1.1615, 1.1475
USDJPY
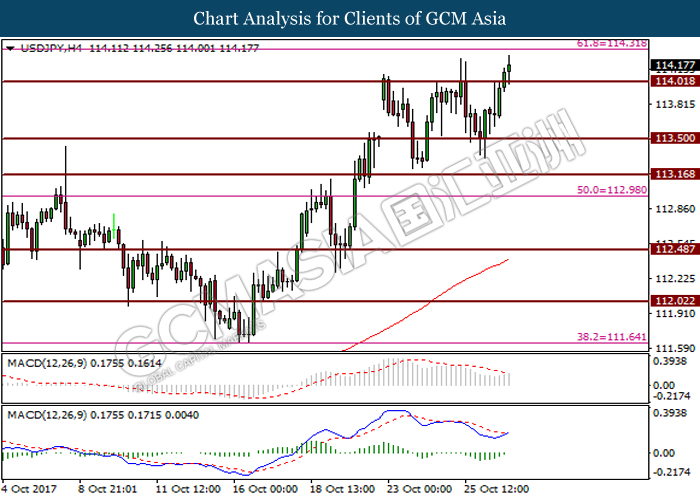
USDJPY, H4: USDJPY was trade higher prior breaking resistance level at 114.00. Golden-cross as formed by MACD signal line suggest the pair to extend its gains toward the next resistance level at 114.30.
Resistance level: 114.30, 114.95
Support level: 114.00, 113.50
CrudeOIL
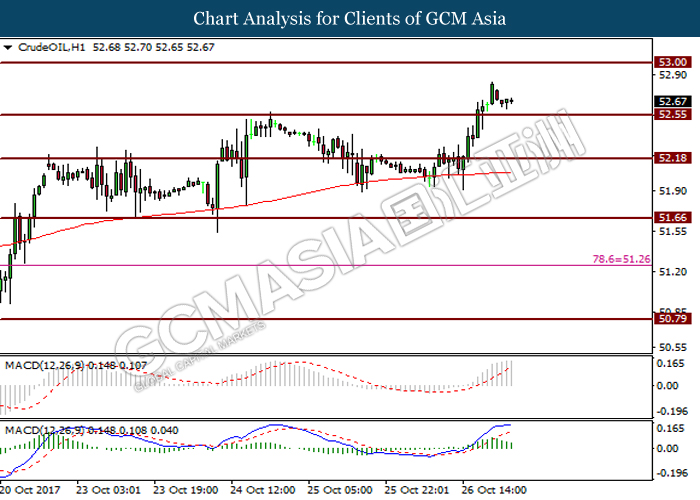
CrudeOIL, H1: Crude oil price was traded higher after breaking resistance level at 52.55. However, formation of pin bar candlesticks and downward slope of MACD histogram suggest crude oil price to undergo short-term technical correction to trade lower toward the support level at 52.55 before extending its gain.
Resistance level: 53.00, 53.70
Support level: 52.55, 52.20
GOLD
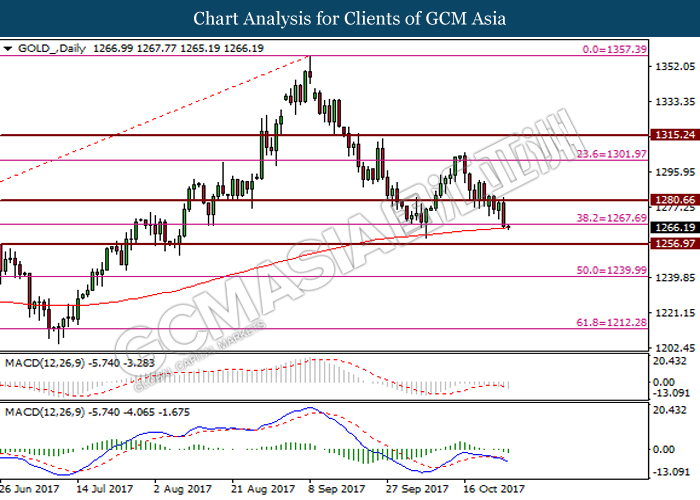
GOLD_, Daily: Gold price was traded lower prior retracement from resistance level at 1280.65. The commodity is currently testing the support level at 1267.70 and support by 200-MA line. Successful closure below the said support level would indicate the commodity to extend its losses toward the next support level at 1256.95.
Resistance level: 1280.65, 1302.00
Support level: 1267.70, 1256.95