17 May 2018 Daily Analysis
Dollar-bull takes a breather over mixed economic data.
Dollar index was traded lower against a trade-weighted basket of major currencies by 0.09% to 93.15 following a mixed bag of economic data in the region while recent recovery of Euro added selling pressure on the Greenback. Overnight, Greenback received its initial boast after building permits rose by 1.8% to 1.347 million units versus the expected reading for 2.3% decline, while U.S. industrial output recorded gains of 0.7% as compared to the economists’ forecast for 0.5% gains. However, gains on the Greenback was erased following a weaker-than-expected U.S. homebuilding data, last stood at 3.7% decline versus the forecast reading of 0.7% decline. The currency has failed to stand on its foot following recent rebound of Euro from its low level despite reports that Italy’s anti-establishment 5-Star Movement and anti-immigrant League may inquire the European Central Bank (ECB) to forgive $294.18 billion of debt. As of writing, EUR/USD pared its losses by 0.03% to $1.1810.
In the commodities market, crude oil price extended gains by 0.21% to 71.63 per barrel following a large draw in U.S. crude supplies by 1.404 million barrels last week versus the expected reading for a reduction of only 0.763 million barrels. Likewise, gold price recovered its losses by 0.17% to $1290.70 a troy ounce following recent retracement of the Greenback.
Today’s Holiday Market Close
Time Market Event
N/A
Today’s Highlight Events
Time Market Event
06:30 USD FOMC Member Bullard Speaks
22:45 USD FOMC Member Kashkari Speaks
01:30 (Fri) USD FOMC Member Kaplan Speaks
Today’s Highlight Economy Data
| Time | Nation & Data | Previous | Forecast | Actual |
| 09:30 | AUD – Employment Change (Apr) | 4.9K | 20.3K | 22.6K |
| 09:30 | AUD – Unemployment Rate (Apr) | 5.5% | 5.5% | 5.6% |
| 20:30 | USD – Initial Jobless Claims | 211K | 219K | – |
| 20:30 | USD – Philadelphia Fed Manufacturing Index (May) | 23.2 | 21.0 | – |
| 20:30 | USD – Philly Fed Employment (May) | 27.1 | – | – |
| 20:30 | CAD – Foreign Securities Purchases (Mar) | 3.96B | – | – |
GBPUSD
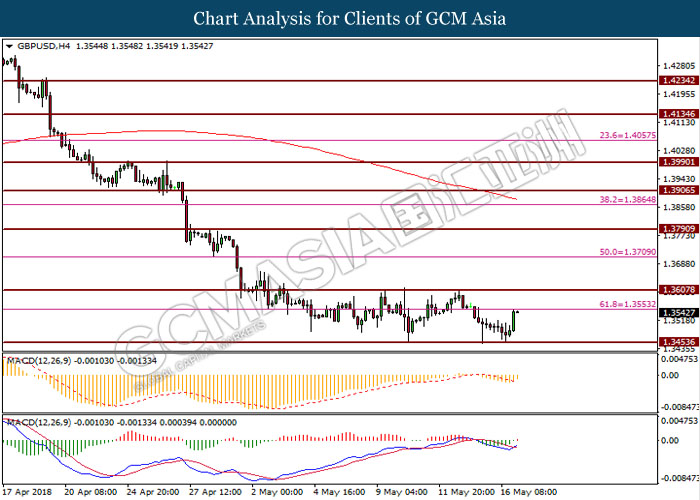
GBPUSD, H4: GBPUSD was traded higher prior rebound from support level at 1.3450. Golden-cross as displayed by MACD signal line would give indication for the pair to trade higher if candlestick successfully closes above the 61.8 Fibonacci level.
Resistance level: 1.3550, 1.3610
Support level: 1.3450, 1.3330
EURUSD
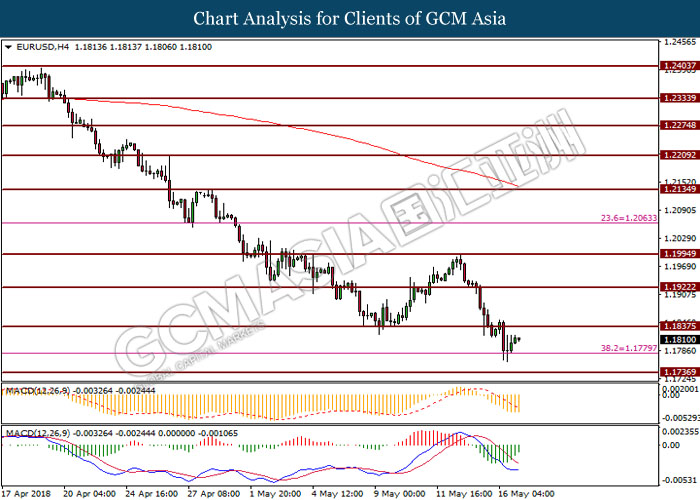
EURUSD, H4: EURUSD was traded higher prior its failure to break support level at 1.1780. MACD signal line that shows diminishing bearish momentum would suggest the pair to extend its gains towards the resistance level at 1.1840.
Resistance level: 1.1840, 1.1920
Support level: 1.1780, 1.1680
USDJPY
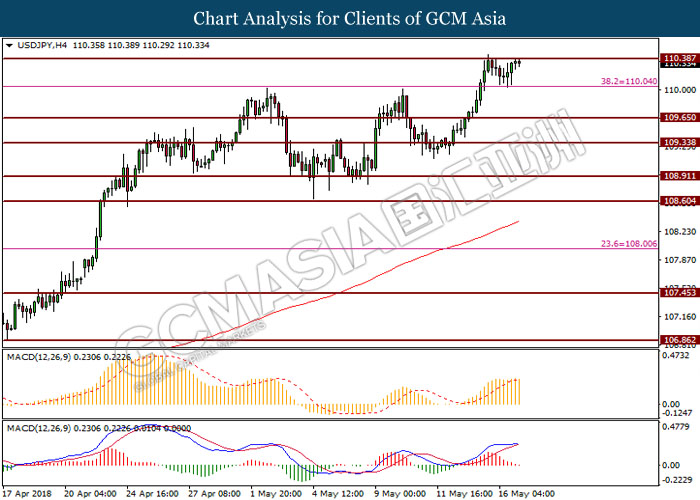
USDJPY, H4: USDJPY was traded higher prior rebound from support level at 110.00. However, death-cross as formed by MACD signal line would suggest the pair to undergo short-term technical correction before extending its bullish bias.
Resistance level: 110.40, 110.90
Support level: 110.00, 109.70
CrudeOIL
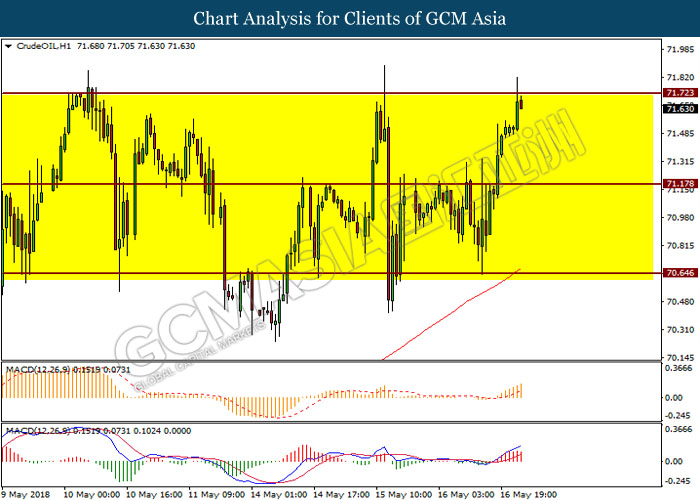
CrudeOIL, H1: Crude oil price was traded lower prior retracement from resistance level at 71.70. A lack of momentum from candlestick pattern formation would suggest the commodity price to undergo short-term technical correction to trade lower before continuing its bullish bias again.
Resistance level: 71.70, 73.60
Support level: 71.20, 70.60
GOLD
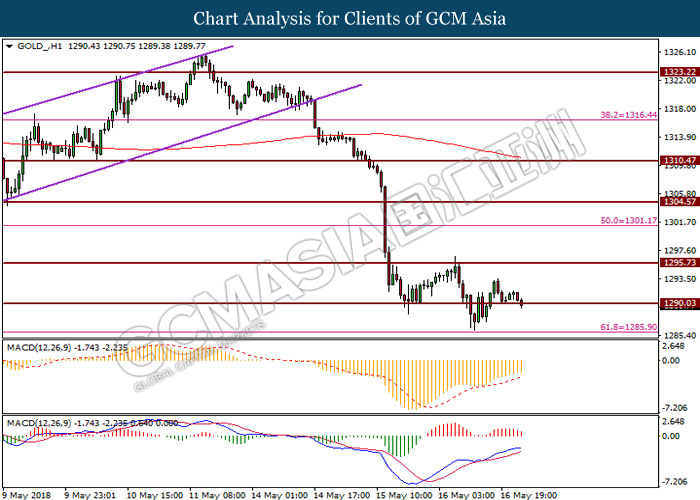
GOLD_, H1: Gold price was traded higher after breaking resistance level at 1290.00. However, MACD signal line that is about to form a death-cross would indicate the safe-haven asset price to extend its losses if breakout at the previous high is successful.
Resistance level: 1295.70, 1301.20
Support level: 1290.00, 1285.90