6 June 2018 Daily Analysis
Greenback relinquished as Euro retributes.
Greenback droops against other major peers on Tuesday following major buyback on the Euro while optimistic US economic data being dismissed by investors. The dollar index extended losses by 0.12% to 93.80 during early Asian trading hours. In the economic front, ISM reported that Non-Manufacturing PMI for the month of May ticks up to 58.6, beating economist forecast of only 57.9. Likewise, job openings in the US rose to a total of 6.7 million in April, exceeding economist expectation for a decrease to 6.5 million. However, the optimistic data failed to safe-guard a bullish rebound following bullish surge in the Euro due to diminished political risk. Major buyback came in after Italian Prime Minister Giuseppe Conte insist that they have never discuss the country’s exit from the EU economic zone, debunking previous speculation for such measures to be pushed forward. Likewise, the single common currency received further bullish support after reports postulate that European Central Bank may reveal their cut-off date to stop asset purchases next week, igniting speculation for an imminent monetary policy tightening up ahead. As such, pair of EUR/USD rose 0.12% to $1.1724 as of writing.
Pondering into the commodities market, crude oil price rebounds by 0.11% to $65.55 after American Petroleum Institute reported that US crude inventories was down by 2.03 million barrels last week. Market participants will now keep a close eye on a similar report by the highly regarded Energy Information Administration to gain further market signals. Similarly, gold price rose 0.06% to $1,297.35 a troy ounce as investors initiate a buyback on the commodity due to weaker US dollar.
Today’s Holiday Market Close
Time Market Event
N/A
Today’s Highlight Events
Time Market Event
N/A
Today’s Highlight Economy Data
| Time | Nation & Data | Previous | Forecast | Actual |
| 09:30 | AUD – GDP (QoQ) (Q1) | 0.4% | 0.8% | – |
| 20:30 | USD – Trade Balance (Apr) | -49.00B | -50.00B | – |
| 20:30 | USD – Unit Labour Costs (QoQ) (Q1) | 2.7% | 2.7% | – |
| 20:30 | CAD – Trade Balance (Apr) | -4.14B | -3.40B | – |
| 22:30 | CrudeOIL – Crude Oil Inventories | -3.620M | -1.824M | – |
| 22:30 | CrudeOIL – Gasoline Inventories | 0.534M | 0.587M | – |
GBPUSD
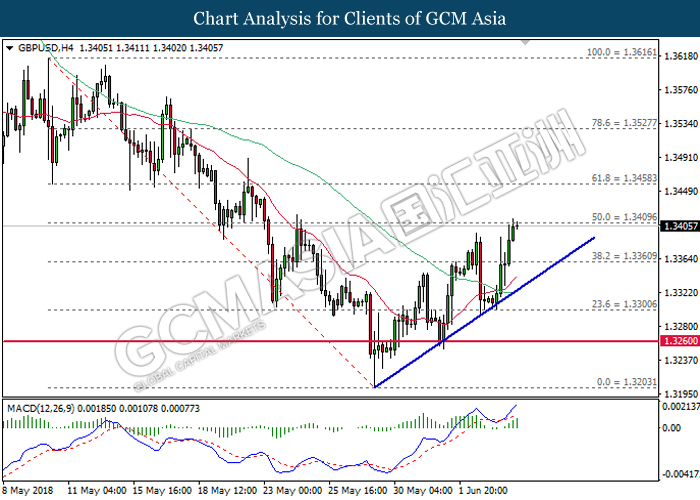
GBPUSD, H4: GBPUSD extended gains following prior rebound from the upward trendline at 1.3300. MACD histogram which has formed an upward signal suggests further bullish bias. However, a breakout from 1.3410 is required to attain further confirmation.
Resistance level: 1.3410, 1.3460
Support level: 1.3360, 1.3300
EURUSD
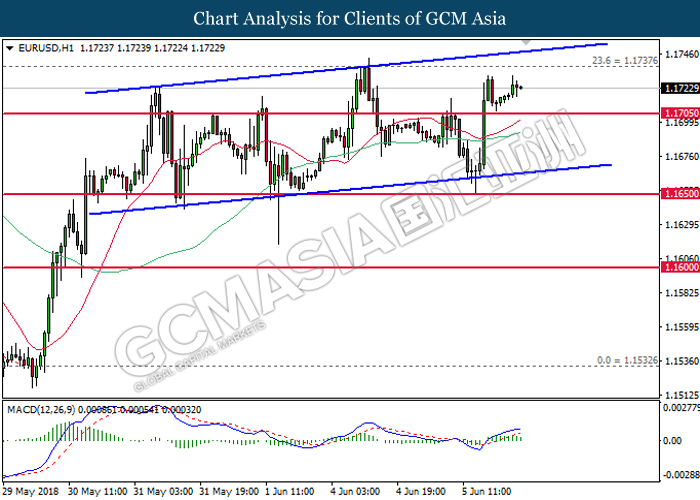
EURUSD, H1: EURUSD remains traded within an ascending channel while currently testing at the top level. MACD histogram which illustrate slightly diminished upward momentum suggests the pair to be traded lower in short-term as technical correction.
Resistance level: 1.1740, 1.1790
Support level: 1.1705, 1.1650
USDJPY
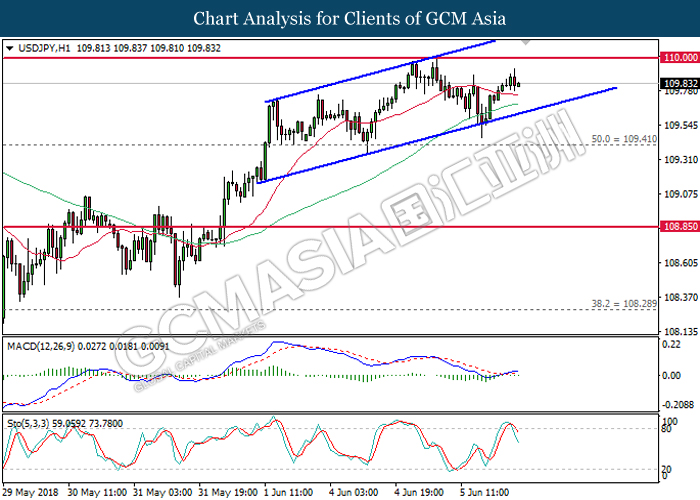
USDJPY, H1: USDJPY remains traded within an ascending channel while currently testing at the mid-level. Both MACD histogram and Stochastic Oscillator which illustrate downward signal may suggests the pair to be traded lower in short-term after closing below the 20-MA line (red).
Resistance level: 110.00, 111.55
Support level: 109.40, 108.85
CrudeOIL
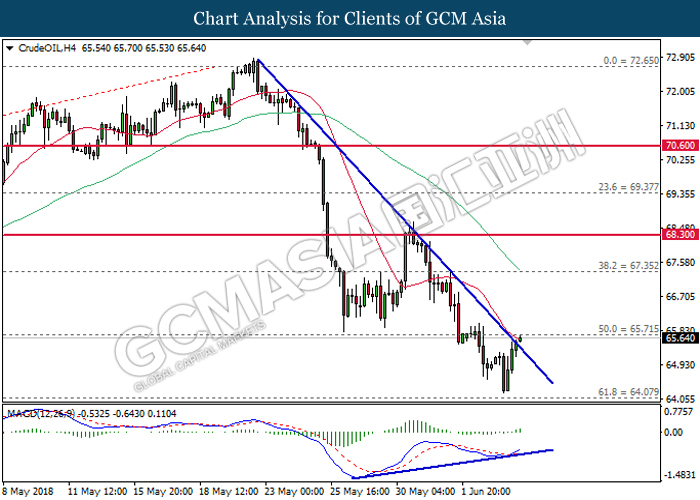
CrudeOIL, H4: Crude oil price was traded higher while recently breakthrough the downward trendline. MACD histogram which illustrate positive divergence signal suggests the commodity price to extend its gains after successfully breaking the resistance level at 65.70.
Resistance level: 65.70, 67.35
Support level: 64.10, 63.00
GOLD
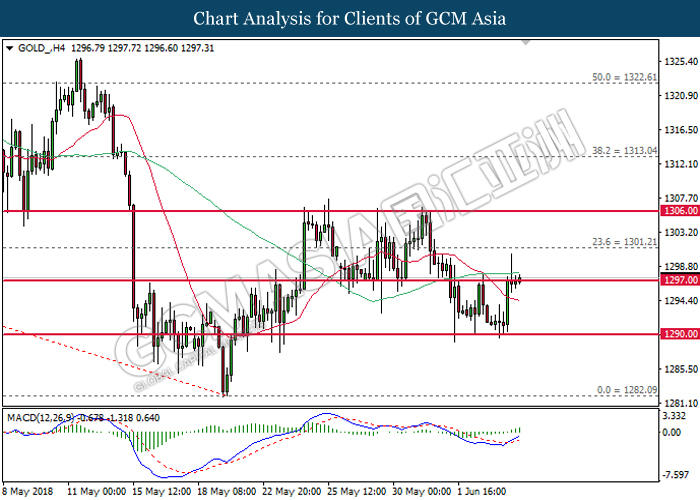
GOLD_, H4: Gold price was traded higher while currently testing near the strong resistance level at 1297.00. MACD histogram which illustrate the formation of golden cross signal suggests gold price to extend its gains in the event of a closure above the target of 1297.00 and 60-MA line (green).
Resistance level: 1297.00, 1301.20
Support level: 1290.00, 1282.10