11 June 2018 Weekly Analysis
GCMAsia Weekly Report: June 11 – 15
Market Review (Forex): June 4 – 8
US dollar appreciates slightly last Friday albeit gains were limited as market participants remains wary over escalating trade tension as G7 meeting got underway. The dollar index rose 0.14% to 93.56 albeit recording a weekly loss of 0.68%.
Due to the lack of top-tier economic data from the US, market participants shifted their focus towards the G7 meeting held in Canada which consist of United States and its allies. US President Donald Trump attended the meeting following frosty measures taken upon Mexico, Canada and European Union by enacting high tariff upon aluminum and steel import from those countries.
For the week, investors will be placing their focus over the highly anticipated summit between United States and North Korea which is scheduled to be held on Tuesday in Singapore. Prior, Trump postulate that he may sign a peace treaty with the North counterpart in order to officially end the Korean War, which could erase geopolitical tension that has haunt the market periodically.
USD/JPY
Pair of USD/JPY was down 0.14% to 109.55 following risk aversion in the market prior to G7 meeting.
EUR/USD
Euro was down 0.25% to $1.1770 against the greenback despite expectations for the European Central Bank to announce the end date of its quantitative easing program next week.
GBP/USD
GBP/USD depreciates by 0.11% to $1.3407 during late Friday trading.
Market Review (Commodities): June 4 – 8
GOLD
Gold price extended gains during late Friday trading due to higher risk aversion among investors against escalating trade tension between the US and its allies. Gold price extended gains by 0.14% while closing the week at $1,299.04 a troy ounce.
Tension between the US and its allies grew following Trump’s controversial introduction of high tariff upon steel and aluminum imports from Mexico, Canada and European Union. However, gains on the safe-haven commodity remains limited as US Federal Reserve is widely expected to raise interest rate next week, a condition which could downgrade the appeal of non-yielding assets in the market.
Crude Oil
Crude oil price settled lower last Friday after data showed higher count of US oil rigs which may interrupt OPEC’s effort in reducing global supply glut. Price of the black commodity slumped 0.52% while closing the week at $65.55 per barrel.
According to US oilfield service provider, Baker Hughes reported that the number of oil drilling rig was up by 1 to 862, its highest level since March 2015. The continuous increase in oil rig came after Energy Information Administration revealed that US oil output has rose to a record high of 10.8 million barrels per day.
However, losses on the commodity were limited after Algeria’s oil minister said that OPEC would focus on balancing the market rather than easing their production limit in order to offset supply shortage from Venezuela and Iran. The bullish comment came after Iraqi oil minister said that production increase in second half of the year is not likely as it was not included in the agenda for month end OPEC meeting.
Weekly Outlook: June 11 – 15
For the week, investors will place their focus over US Federal Reserve whom are widely anticipated to increase their interest rate by 25 basis points to 2.00% on Thursday. In addition, investors will also ponder upon the European Central Bank which is expected to announce the end date for their QE program during their policy meeting on Thursday.
For the oil market, traders will anticipate the release of monthly report from International Energy Agency and OPEC in order to gauge the supply and demand levels of global oil market.
Highlighted economy data and events for the week: June 11 – 15
| Monday, June 11 |
Data GBP – Manufacturing Production (MoM) (Apr) GBP – Trade Balance (Apr)
Events N/A
|
| Tuesday, June 12 |
Data GBP – Average Earnings Index +Bonus (Apr) GBP – Claimant Count Change GBP – Unemployment Rate (Apr) USD – Core CPI (MoM) (May)
Events CrudeOIL – OPEC Monthly Report
|
| Wednesday, June 13 |
Data CrudeOIL – API Weekly Crude Oil Stock GBP – CPI (YoY) (May) EUR – Industrial Production (MoM) (Apr) USD – PPI (MoM) (May) CrudeOIL – Crude Oil Inventories CrudeOIL – Gasoline Inventories
Events CrudeOIL – IEA Monthly Report
|
| Thursday, June 14 |
Data USD – Fed Interest Rate Decision AUD – Employment Change (May) AUD – Unemployment Rate (May) CNY – Industrial Production (YoY) (May) EUR – German CPI (MoM) (May) GBP – Retail Sales (MoM) (May) EUR – ECB Interest Rate Decision EUR – Deposit Facility Rate EUR – ECB Marginal Lending Facility USD – Core Retail Sales (MoM) (May) USD – Import Price Index (MoM) (May) USD – Initial Jobless Claims
Events USD – FOMC Economic Projections USD – FOMC Statement USD – FOMC Press Conference EUR – ECB Press Conference
|
|
Friday, June 15
|
Data JPY – BoJ Interest Rate Decision EUR – CPI (YoY) (May) USD – NY Empire State Manufacturing Index (Jun) CAD – Manufacturing Sales (Apr) USD – Industrial Production (MoM) (May) USD – Michigan Consumer Sentiment (Jun) CrudeOIL – US Baker Hughes Oil Rig Count
Events JPY – BoJ Monetary Policy Statement JPY – BoJ Press Conference
|
Technical Weekly Outlook: June 11 – 15
Dollar Index
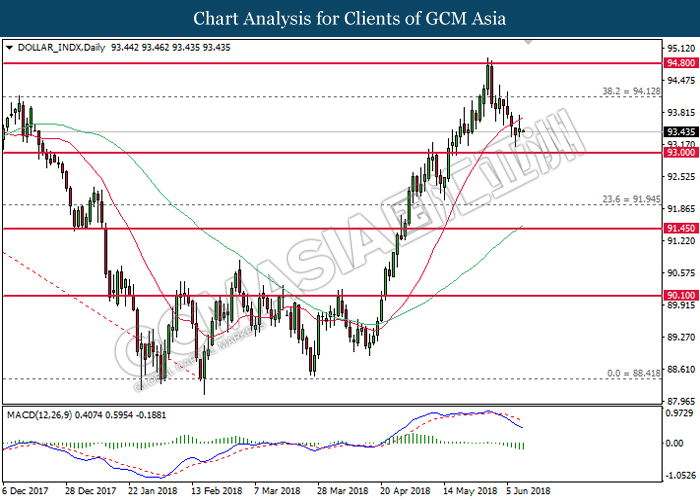
DOLLAR_INDX, Daily: Dollar index was traded lower following prior retracement from the resistance level at 94.80. MACD histogram which continues to illustrate downward signal suggests the index to extend its bearish bias, towards the support level at 93.00.
Resistance level: 94.10, 94.80
Support level: 93.00, 91.95
GBPUSD
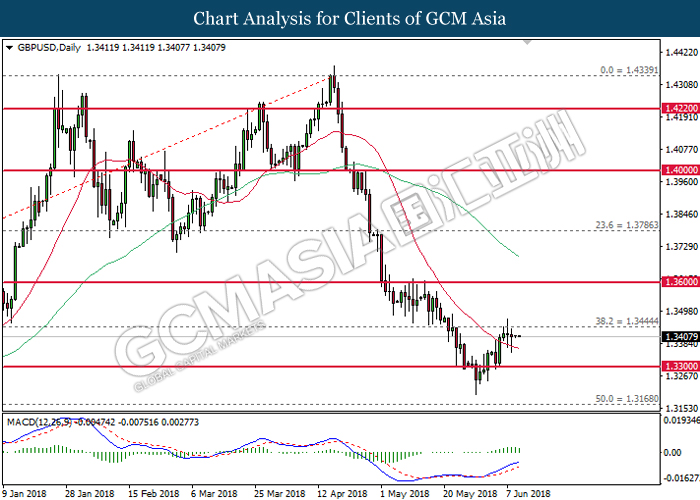
GBPUSD, Daily: GBPUSD was traded lower following prior retracement from the resistance level of 1.3445. MACD histogram which continues to illustrate bullish bias suggests the pair to extend its gains in the event of a successful closure above the threshold of 1.3445.
Resistance level: 1.3445, 1.3600
Support level: 1.3300, 1.3170
USDJPY
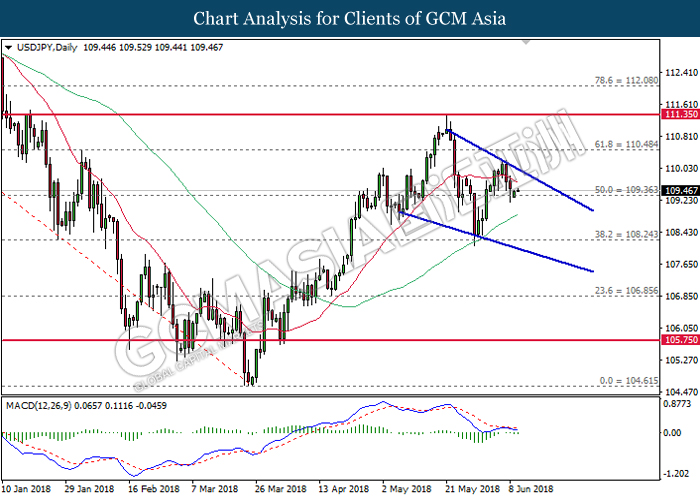
USDJPY, Daily: USDJPY remains traded within a descending wedge following prior retracement from the top level. MACD histogram which begins to illustrate downward signal suggests the pair to extend its losses after breaking the support level of 109.35.
Resistance level: 110.50, 111.35
Support level: 109.35, 108.25
EURUSD
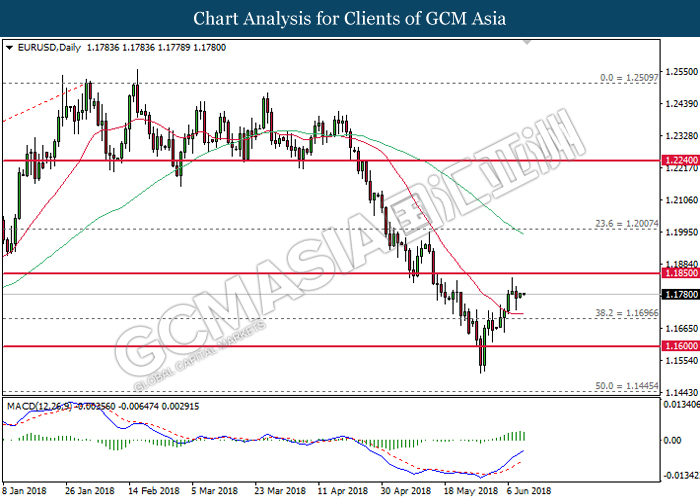
EURUSD, Daily: EURUSD was traded higher following prior rebound near the 20-MA line (red). MACD histogram which continues to illustrate bullish signal suggests the pair to extend its gains after breaking the strong resistance level near 1.1850.
Resistance level: 1.1850, 1.2000
Support level: 1.1700, 1.1600
GOLD
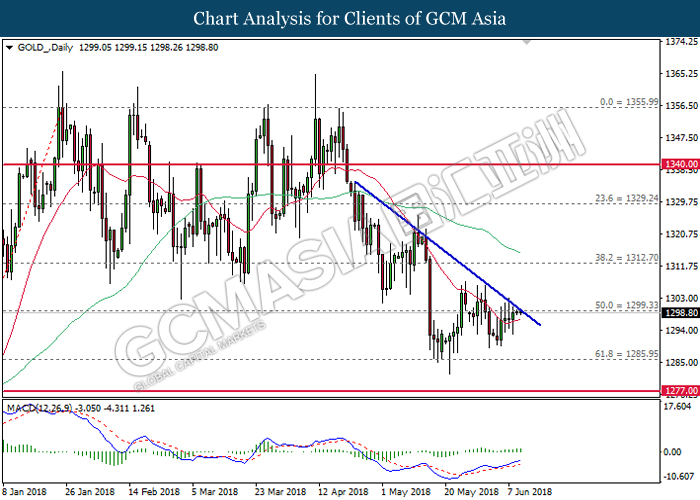
GOLD_, Daily: Gold price extended its recovery following prior rebound near the strong support level of 1285.95. MACD histogram which illustrate persistent upward signal suggests the commodity price to advance further upwards after breaking the downward trendline and resistance level at 1300.00.
Resistance level: 1300.00, 1312.70
Support level: 1285.95, 1266.90
Crude Oil
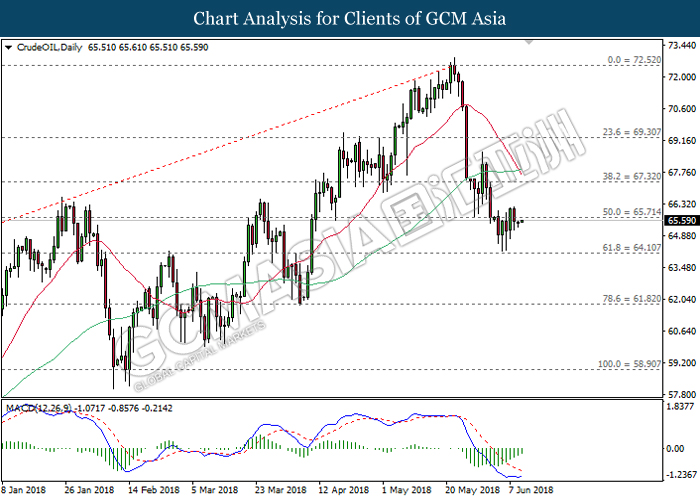
CrudeOIL, Daily: Crude oil price was traded higher after regaining some support at 64.10. MACD histogram which illustrate diminishing downward momentum suggests the commodity price to extend its recovery after breaking the resistance level near 65.70.
Resistance level: 65.70, 67.30
Support level: 64.10, 61.80