13 June 2018 Daily Analysis
Dollar-bulls reignites following rising consumer prices.
US dollar shies away from its prior session low following positive US inflation report which has further validate rising consumer prices, in tandem with US Federal Reserve economic projection. The dollar index extended gains by 0.26% while last quoted around 93.77 as of writing. According to the US Labor Department, report shows that Core Consumer Price Index (CPI) rose 0.2% for the month of May, exceeding economist forecast for a rise of only 0.1%. The data came as US Federal Reserve two-day policy meeting got underway while they are widely expected to raise interest rate by 25 basis points to the range of 1.75% – 2.00%. In addition, the US dollar received further bullish support as Euro-bulls subsides due to weaker than expected Eurozone Economic Sentiment. However, losses on the single common currency were limited as market participants give higher prospect towards the European Central Bank (ECB) to announce the exit date for its massive QE program during tomorrow’s meeting. During Asian trading hours, Euro tacks up 0.02% to $1.1747 against the US dollar.
Peering into the commodities market, crude oil price slumped 0.29% to $65.84 per barrel after API reported that US crude oil stock rose 0.833 million barrels last week, fumbling investors forecast for a draw of up to 2.700 million barrels. Similarly, gold price was down by 0.34% to $1295.53 as higher interest rate expectation limits the appeal of the asset to yield seeking investors.
Today’s Holiday Market Close
Time Market Event
N/A
Today’s Highlight Events
Time Market Event
16:00 CrudeOIL IEA Monthly Report
02:00 USD FOMC Economic Projections
02:00 USD FOMC Statement
02:30 USD FOMC Press Conference
Today’s Highlight Economic Data
| Time | Nation & Data | Previous | Forecast | Actual |
| 16:30 | GBP – CPI (YoY) (May) | 2.4% | 2.4% | – |
| 17:00 | EUR – Industrial Production (MoM) (Apr) | 0.5% | -0.5% | – |
| 20:30 | USD – PPI (MoM) (May) | 0.1% | 0.3% | – |
| 22:30 | CrudeOIL – Crude Oil Inventories | 2.072M | -2.744M | – |
| 22:30 | CrudeOIL – Gasoline Inventories | 4.603M | 0.443M | – |
| 02:00 | USD – Fed Interest Rate Decision | 1.75% | 2.00% | – |
GBPUSD
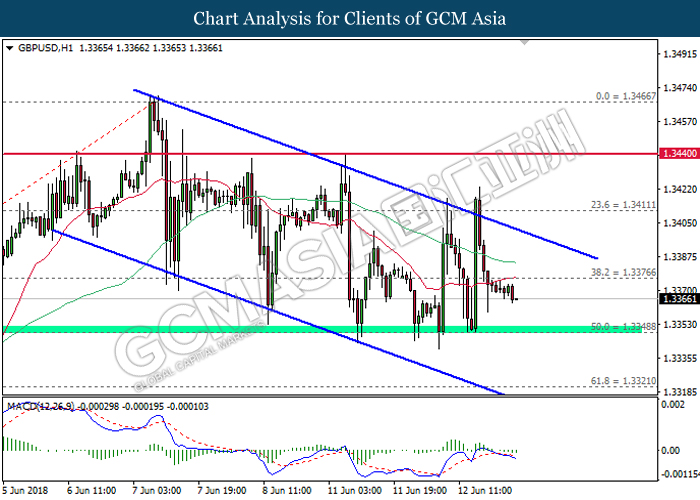
GBPUSD, H1: GBPUSD remains traded within a descending channel following prior retrace from the top level. MACD histogram which illustrate downward signal suggests the pair to be traded lower in short-term, towards the direction of support level at 1.3350.
Resistance level: 1.3375, 1.3410
Support level: 1.3350, 1.3320
EURUSD
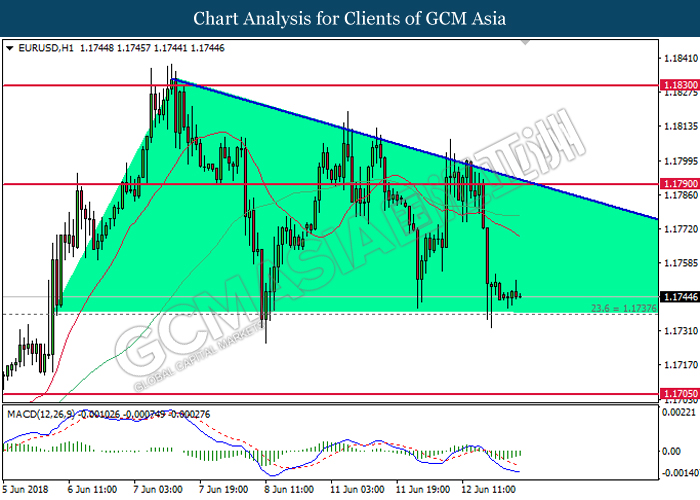
EURUSD, H1: EURUSD remains traded within a descending triangle while currently testing at the bottom level. MACD histogram which illustrate bearish signal suggests the pair to extend its losses after breaking the strong support near 1.1740.
Resistance level: 1.1790, 1.1830
Support level: 1.1740, 1.1705
USDJPY
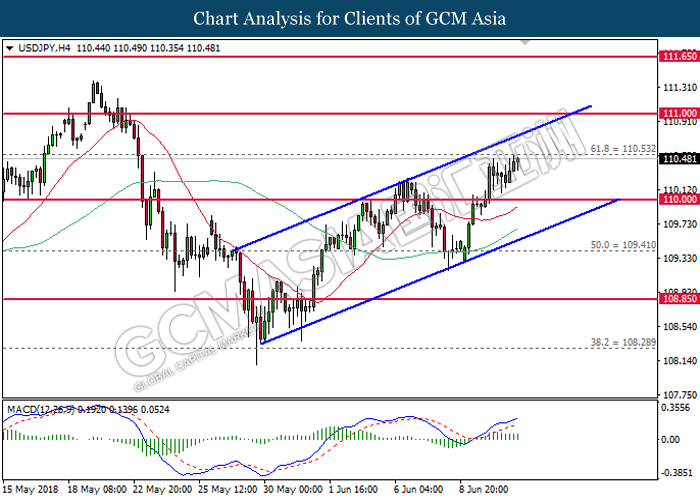
USDJPY, H4: USDJPY remains traded within an ascending channel following prior rebound from the mid-level. MACD histogram which illustrate upward signal suggests the pair to extend its gains after breaking the resistance level at 110.55.
Resistance level: 110.55, 111.00
Support level: 109.40, 108.85
CrudeOIL
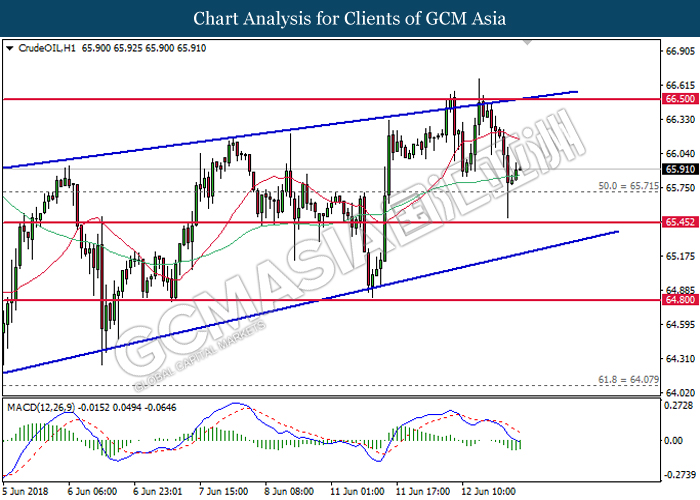
CrudeOIL, H1: Crude oil price remains traded within an ascending wedge while recently rebounded from the mid-level. Diminishing downward momentum from MACD histogram may suggests the commodity price to be traded higher in short-term, towards the upper level of the formation.
Resistance level: 66.50, 67.35
Support level: 65.70, 65.45
GOLD
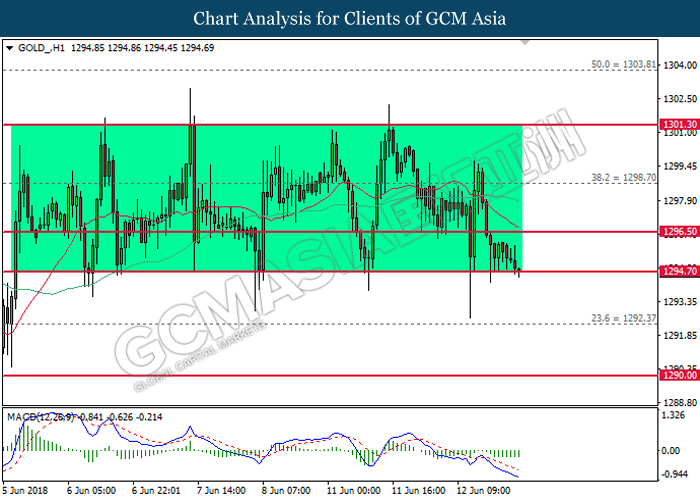
GOLD_, H1: Gold price remains traded within a sideways channel while currently testing at the bottom level. MACD histogram which illustrate persistent bearish signal suggests the commodity price to extend its gains after breaking the strong support of 1294.70.
Resistance level: 1296.50, 1298.70
Support level: 1294.70, 1292.40