2 July 2018 Weekly Analysis
GCMAsia Weekly Report: July 2 – 6
Market Review (Forex): June 25 – 29
Greenback tumbled during late Friday trading amid a rebound in Euro and Pound Sterling while losses remained capped as optimistic economic data provide some support from the downside. The dollar index settled down 0.96% while ended the week at 94.47 against a basket of six major currencies. Both Euro and Pound Sterling received bullish buyback after EU members stuck a deal on migration issues while the latter was bolstered by hawkish first quarter growth which may warrant for another rate hike by the Bank of England later this year.
Yet, US dollar managed to cap off some of its losses as economic data showed that US inflation hit Federal Reserve’s target last month which paves the way for the Fed to continue its rate hike cycle. According to the Fed preferred inflation measure, Core PCE Price Index which exclude food and energy rose 2% in May, exceeding economist forecast of only 1.9%. Although consumer spending experience slower pace with only 0.2% versus consensus forecast of 0.4%, personal income grew steadily at 0.4% for the month of May.
USD/JPY
US dollar was up 0.25% to 110.77 against the safe-haven Yen during late Friday trading.
EUR/USD
Pair of EUR/USD extended gains by 1.00% while ended the week at $1.1684.
GBP/USD
Pound sterling notched up 1.02% while closing the week at $1.3211 against the greenback.
Market Review (Commodities): June 25 – 29
GOLD
Gold price recovered its prior losses on Friday following broad dollar weakness due to a rebound in Euro and Pound Sterling. The safe-haven commodity was up 0.36% or $4.55 to $1,252.81 a troy ounce during late American trading session.
However, any substantial recovery on the asset were limited due to higher prospect for more rate hike from the Federal Reserve as inflation picks up. In a higher interest rate setting, the appeal for the asset will be diminished as it fails to compete with other yielding asset such as US Treasury or bonds.
Crude Oil
Crude oil price settled more than 1% on Friday as US output portrays signs of a slowdown while traders continue to bet on global crude supply shortage. Price of the black commodity skyrocketed 1.38% or $1.01 while closing the week at $74.39, not far from the psychological threshold of $75.00 per barrel.
According to US oilfield service provider, Baker Hughes reported that the number of active drilling rigs in the region fell by 4 to a total of 858 last week. The report notched in a second weekly decline which raised investors’ hopes that the rampant pace domestic output may slow down due to rising global demand and declining drilling activities.
Moreover, the commodity is also supported by ongoing expectations that global supply may experience some shortage as more countries may back US enforced sanctions against Iran, one of the third largest crude exporters in OPEC that accounts for more than 2 million barrels per day.
Weekly Outlook: July 2 – 6
For the week ahead, investors will place their attention on several key data from the United States which includes ISM and ADP report in anticipation for the coveted release of Nonfarm Payrolls on Friday.
As for oil traders, they will be eyeing on US inventories level reported by API and EIA to gauge the strength of crude demand for world’s largest oil consumer.
Highlighted economy data and events for the week: July 2 – 6
| Monday, July 2 |
Data JPY – Tankan Large Manufacturers Index (Q2) JPY – Tankan Large Non-Manufacturers Index (Q2) CNY – Caixin Manufacturing PMI (Jun) EUR – German Manufacturing PMI (Jun) GBP – Manufacturing PMI (Jun) EUR – Manufacturing PMI (Jun) USD – ISM Manufacturing PMI (Jun) USD – ISM Manufacturing Employment (Jun)
Events N/A
|
| Tuesday, July 3 |
Data AUD – RBA Interest Rate Decision (Jul) GBP – Construction PMI (Jun) EUR – Retail Sales (MoM) (May) USD – Factory Orders (MoM) (May)
Events AUD – RBA Rate Statement
|
| Wednesday, July 4 |
Data CrudeOIL – API Weekly Crude Oil Stock AUD – Retail Sales (MoM) (May) CNY – Caixin Services PMI (Jun) EUR – German Services PMI (Jun) GBP – Services PMI (Jun)
Events N/A
|
| Thursday, July 5 |
Data EUR – German Factory Orders (MoM) (May) USD – ADP Nonfarm Employment Change (Jun) USD – Initial Jobless Claims USD – ISM Non-Manufacturing PMI (Jun) USD – ISM Non-Manufacturing Employment CrudeOIL – Crude Oil Inventories CrudeOIL – Gasoline Inventories
Events N/A
|
|
Friday, July 6
|
Data USD – FOMC Meeting Minutes JPY – Household Spending (MoM) (May) EUR – German Industrial Production (MoM) (May) GBP – Halifax House Price Index (MoM) (Jun) USD – Average Hourly Earnings (MoM) (Jun) USD – Nonfarm Payrolls (Jun) USD – Unemployment Rate (Jun) CAD – Employment Change (Jun) CAD – Unemployment Rate (Jun) CAD – Ivey PMI (Jun) CrudeOIL – Baker Hughes Oil Rig Count
Events N/A
|
Technical Weekly Outlook: July 2 – 6
Dollar Index
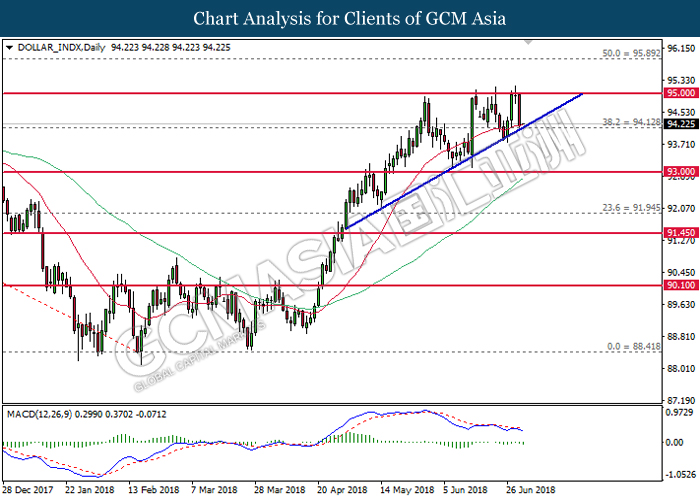
DOLLAR_INDX, Daily: Dollar index was traded lower following prior retracement from the top level of ascending triangle. Although MACD histogram begins to form bearish signal, a break below the triangle is required to attain further confirmation.
Resistance level: 95.00, 95.90
Support level: 94.10, 93.00
GBPUSD
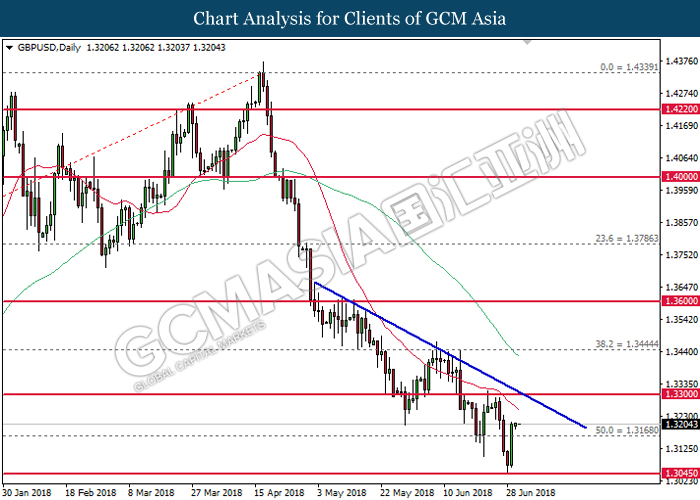
GBPUSD, Daily: GBPUSD was traded higher following prior rebound from the support level of 1.3045. Recent price action suggests the pair to extend it technical correction in short-term, towards the downward trendline.
Resistance level: 1.3300, 1.3445
Support level: 1.3170, 1.3045
USDJPY
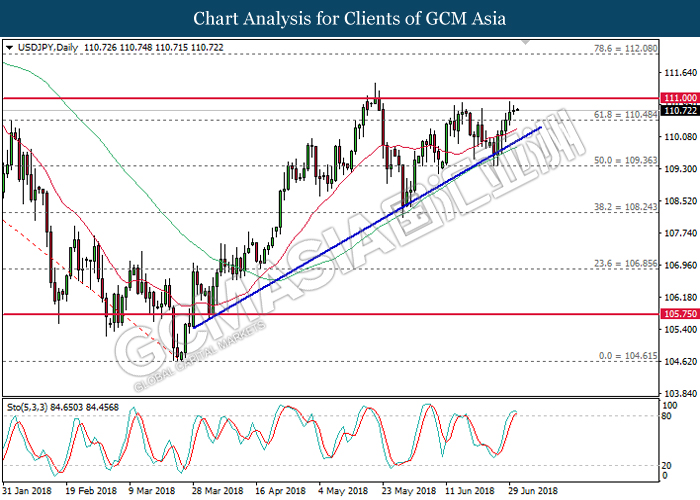
USDJPY, Daily: USDJPY extended gains following prior rebound from the upward trendline. However, Stochastic Oscillator which begins to form a retracement signal from the overbought region may suggest the pair to be traded lower in short-term as technical correction.
Resistance level: 111.00, 112.10
Support level: 110.50, 109.35
EURUSD
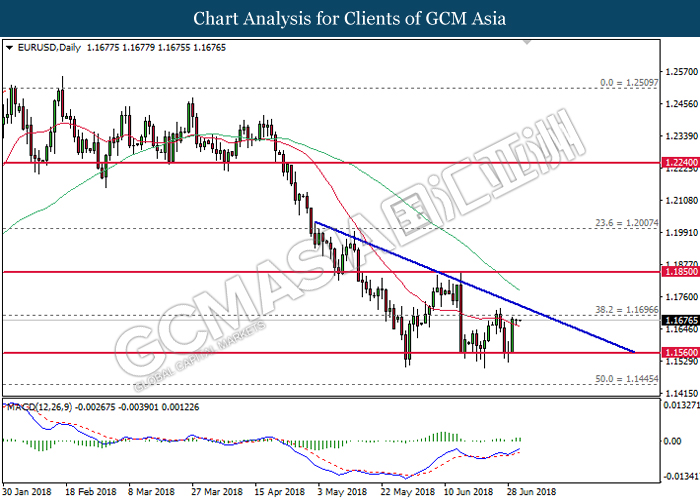
EURUSD, Daily: EURUSD was traded higher following prior rebound from the bottom level of descending triangle. MACD histogram which illustrate upward signal suggest the pair to extend its gains in short-term, towards the upper level of the triangle near 1.1700.
Resistance level: 1.1700, 1.1850
Support level: 1.1560, 1.1445
GOLD
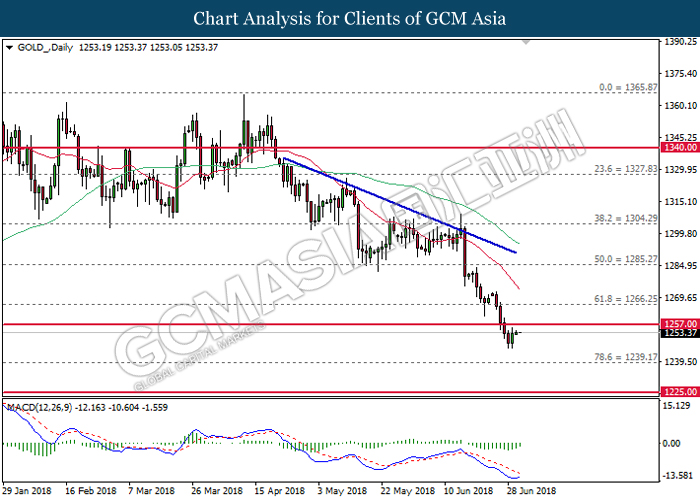
GOLD_, Daily: Gold price was traded higher following a rebound while currently testing at the threshold of 1257.00. MACD histogram which illustrate diminished downward momentum may suggest the pair to be traded higher in short-term as technical correction before continuing its major bearing trend.
Resistance level: 1257.00, 1266.25
Support level: 1239.20, 1225.00
Crude Oil
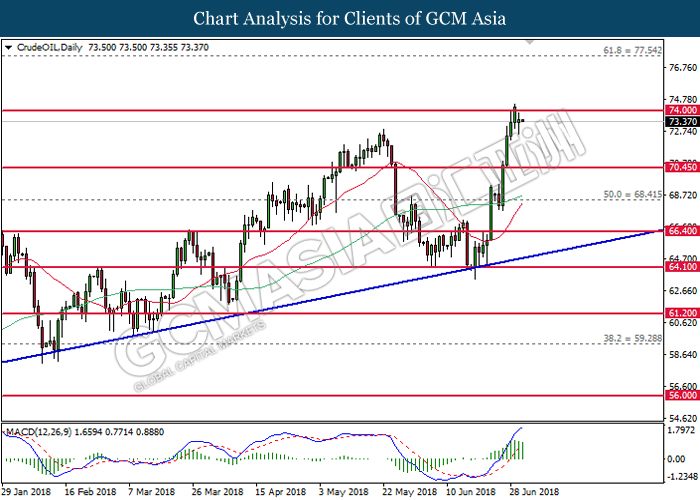
CrudeOIL, Daily: Crude oil was traded lower following prior retracement from the psychological level at 74.00. MACD histogram which illustrate diminished upward momentum suggest the commodity price to be traded lower in short-term as technical correction. Otherwise, long-term trend direction is still subject to current upward trendline.
Resistance level: 74.00, 77.55
Support level: 70.45, 68.40