26 October 2018 Morning Session Analysis
Euro slumps as ECB paints a darker picture.
Greenback rose to two-months high on yesterday while shrugging off bearish US economic data. The dollar index was up 0.05% to 96.30 during early Asian trading session. The US dollar notched its second weekly gain even though its economic data showed some weakness in labor market and slowing momentum of business spending. According to the US Commerce Department, Core Durable Goods Orders rose only 0.1% for last month, missing economist forecast for a 0.5% rise. In addition, US Department of Labor reported that the initial jobless claims for last week increased by 5,000 to 215,000, higher than economist forecast of 214,000. Both data which showed lower than expected reading fail to cap the rise in greenback as pound sterling and euro extended its losses on yesterday. In the EU front, European Central Bank maintains their policy and interest rates unchanged as expected by most of market participants. However, the single common currency was hit with bearish momentum following dovish outlook from the ECB with regards to current underlying risk. On yesterday, ECB President Mario Draghi acknowledge in a press conference that the current economic outlook was dampened as he took note of recent economic data which was “weaker” than expected while highlighting risks from Italy and global trade uncertainty. As of writing, EUR/USD ticked down 0.02% to 1.1372.
In the commodities market, crude oil price was down 0.31% to $66.64 per barrel. The commodity remained under pressure as investors outlook towards the market turn bleak following Saudi Arabia’s pledge to resolve supply issue that arises from Iran’s sanction. On the other hand, gold price ticked down 0.03% to $1,231.92 a troy ounce following a rebound in greenback.
Today’s Holiday Market Close
Time Market Event
N/A
Today’s Highlight Events
Time Market Event
22:00 EUR ECB President Draghi Speaks
Today’s Highlight Economic Data
| Time | Market & Data | Previous | Forecast | Actual |
| 14:00 | EUR – GfK German Consumer Climate (Nov) | 10.6 | 10.5 | – |
| 20:30 | USD – GDP (QoQ) (Q3) | 4.2% | 3.3% | – |
| 22:00 | USD – Michigan Consumer Sentiment (Oct) | 99.0 | 99.0 | – |
| 01:00 | CrudeOIL – US Baker Hughes Oil Rig Count | 873 | – | – |
Technical Analysis
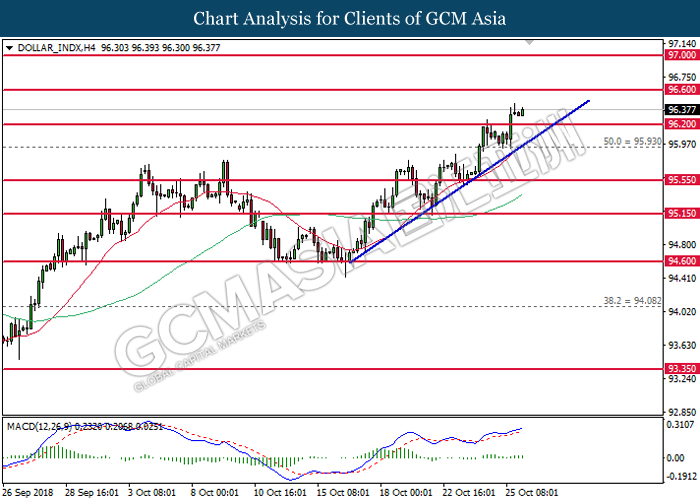
DOLLAR_INDX, H4: Dollar index was traded higher following prior closure above 96.20. MACD which illustrate persistent upward signal suggests the index to extend its gains towards the direction of resistance level at 96.60.
Resistance level: 96.60, 97.00
Support level: 96.20, 95.95
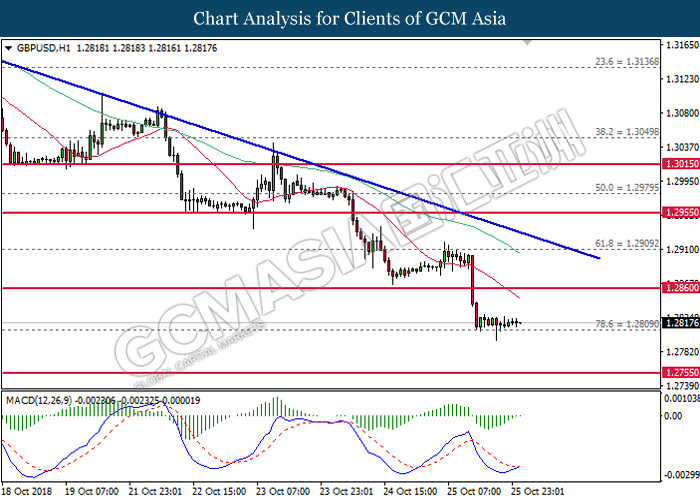
GBPUSD, H1: GBPUSD was traded lower while currently testing at the support level of 1.2810. However, MACD which illustrate the imminent formation of golden cross suggests the pair to be traded higher in short-term as technical correction.
Resistance level: 1.2860, 1.2910
Support level: 1.2810, 1.2755
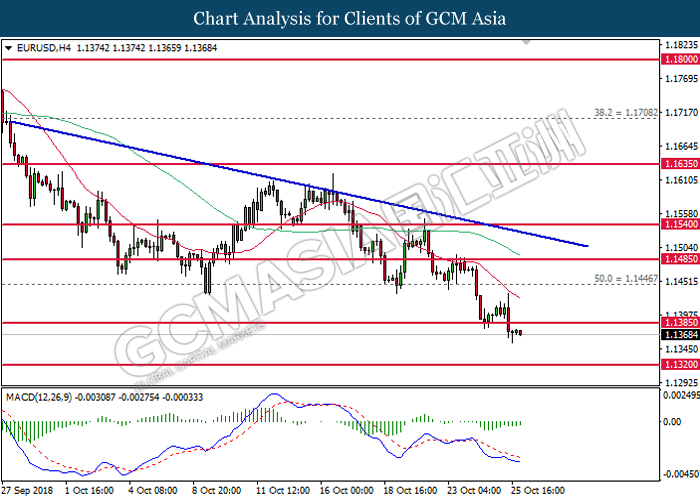
EURUSD, H4: EURUSD was traded lower following prior retrace from the 20-MA line (red). MACD which illustrate bearish signal suggests the pair to extend its losses towards the direction of support level near 1.3200.
Resistance level: 1.1385, 1.1445
Support level: 1.1320, 1.1240
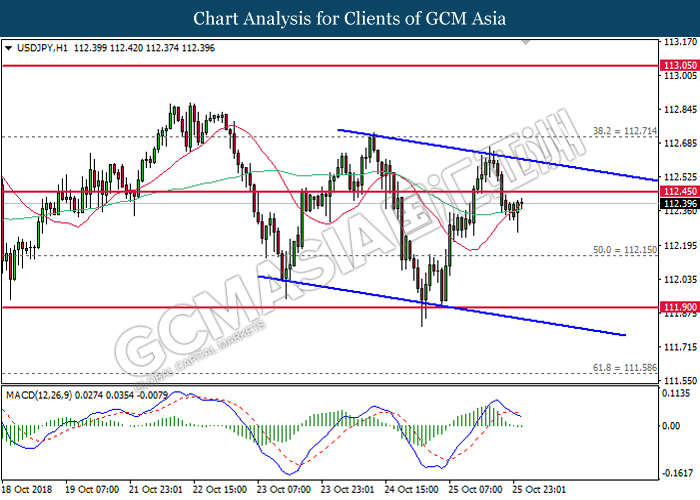
USDJPY, H1: USDJPY remains traded within a descending channel while currently testing at the 60-MA line (green). MACD which has formed a death cross signal suggests the pair to extend its losses after closing below the 60-MA line.
Resistance level: 112.45, 112.70
Support level: 112.15, 111.90
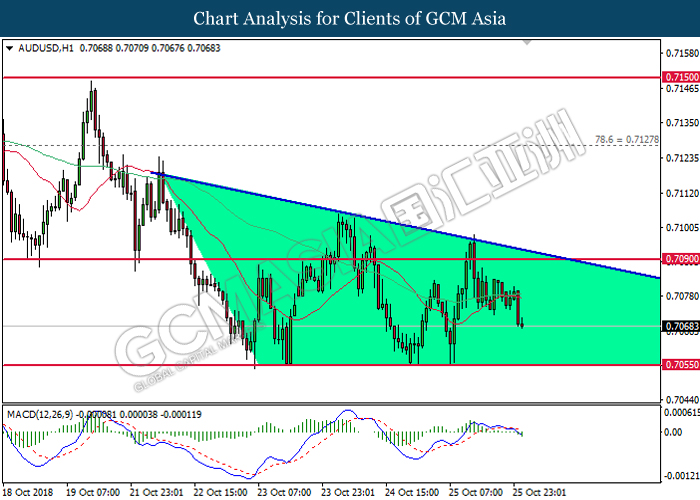
AUDUSD, H1: AUDUSD remains traded within a descending triangle following prior retrace from the top level. MACD which illustrate the formation of death cross signal suggests the pair to be traded lower in short-term, towards the support of 0.7055.
Resistance level: 0.7090, 0.7130
Support level: 0.7055, 0.7000
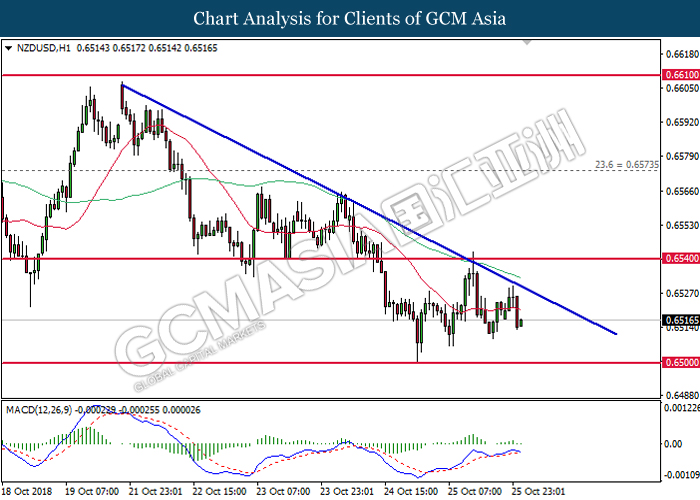
NZDUSD, H1: NZDUSD was traded lower following prior retrace from the downward trendline. MACD which illustrate diminishing upward momentum suggests the pair to extend its losses, towards the support of 0.6500.
Resistance level: 0.6540, 0.6575
Support level: 0.6500, 0.6460
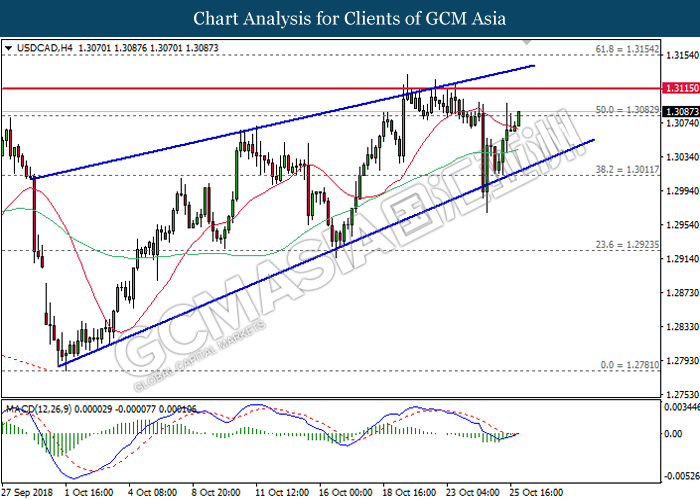
USDCAD, H4: USDCAD was traded higher following prior rebound from the bottom level of ascending channel. MACD which illustrate the formation of golden cross suggests the pair to extend its gains after breaking the resistance level at 1.3080.
Resistance level: 1.3080, 1.3115
Support level: 1.3010, 1.2925
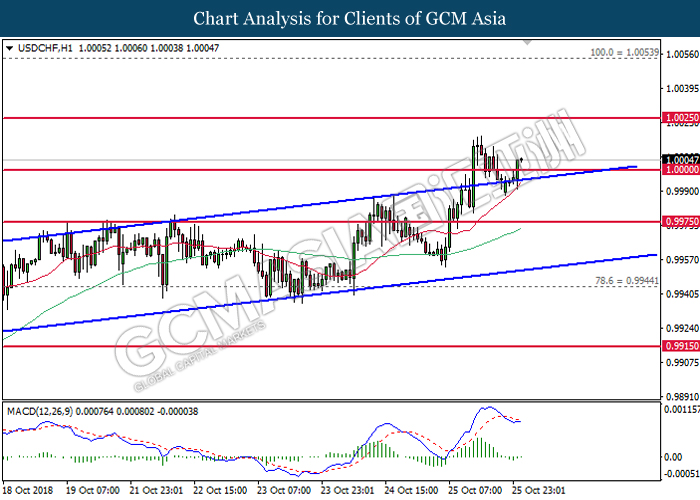
USDCHF, H1: USDCHF was traded higher following prior breakout from the top level of ascending channel. MACD which illustrate diminishing downward momentum suggests the pair to extend its gains, towards the target at 1.0025.
Resistance level: 1.0025, 1.0055
Support level: 1.0000, 0.9975
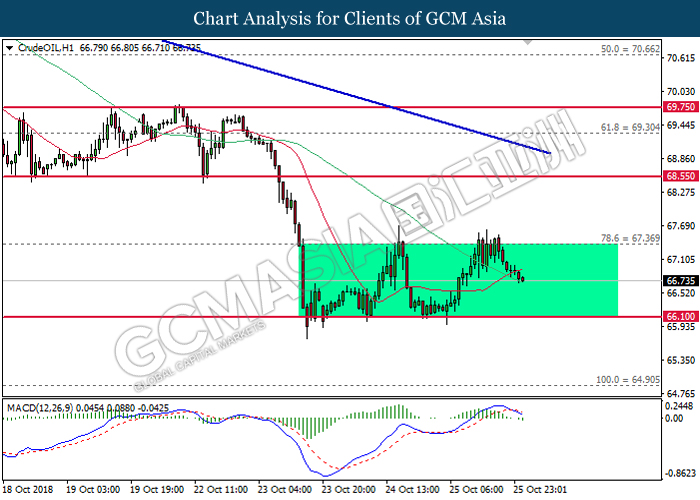
CrudeOIL, H1: Crude oil remains traded within a sideways channel following prior retrace from the top level. MACD which illustrate the formation of bearish signal suggests the commodity price to be traded lower in short-term after closing below the 60-MA line (green).
Resistance level: 67.35, 68.55
Support level: 66.10, 64.90
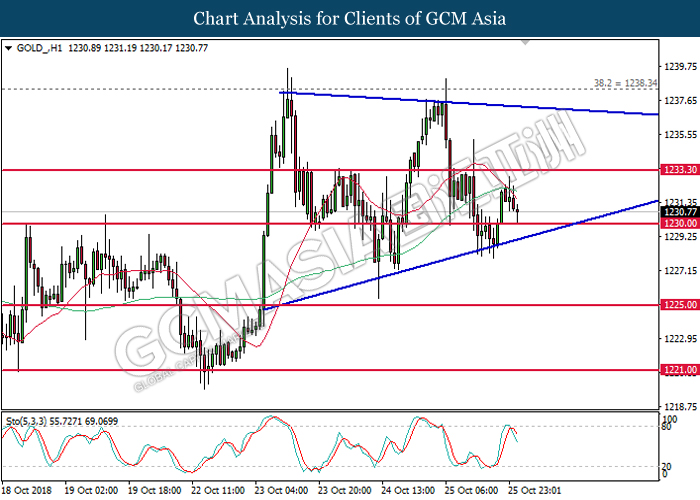
GOLD_, H1: Gold price remains traded within a narrowing triangle while currently testing at the lower levels. Stochastic Oscillator which illustrate bearish signal suggests its price to extend its losses after breaking the bottom level of the triangle.
Resistance level: 1233.30, 1238.35
Support level: 1230.00, 1225.00