29 October 2018 Morning Session Analysis
Trump tax cuts begins to wear off?
US dollar recovered some losses on Monday while investors continues to scrutinize upcoming economic data from the United States to gauge its performance. The dollar index was up 0.09% to 96.15 as of writing. Last Friday, the currency languished near sessions low, retracing from prior two months high as analysts downplayed the stronger third quarter economic growth. According to Commerce Department, GDP for the third quarter came in at 3.5%, significantly higher than economists’ forecast of 3.3%. However, US bond yields fell following its release as a deeper look into the report signaled diminished growth momentum as US President Donald Trump tax cuts initiatives wears off. Analysts postulate that the boost from tax cuts and deregulation is fading quickly as consumer spending were likely to have reach its maximum capacity. On the other hand, pair of EUR/USD tumbled down 0.06% to 1.1395 this morning. The currency failed to initiate any further recovery as European Central Bank President Mario Draghi failed to convince investors that they would pursue further monetary policy tightening during next year as political and economic uncertainty rises.
In the commodities market, crude oil price rose 0.30% to $67.70 per barrel while investors place their attention over looming US sanction against Iran which is set to be enforced on November 4th. Otherwise, gold price tumbled down 0.11% to $1,232.21 a troy ounce following a rebound on the US dollar this morning.
Today’s Holiday Market Close
Time Market Event
N/A
Today’s Highlight Events
Time Market Event
20:30 GBP Autumn Budget
Today’s Highlight Economy Data
| Time | Market & Data | Previous | Forecast | Actual |
| 20:30 | USD – Core PCE Price Index (MoM) (Sep) | 0.0% | 0.1% | – |
| 20:30 | USD – Personal Income (MoM) (Sep) | 0.3% | 0.4% | – |
| 20:30 | USD – Personal Spending (MoM) (Sep) | 0.3% | 0.4% | – |
Technical Analysis
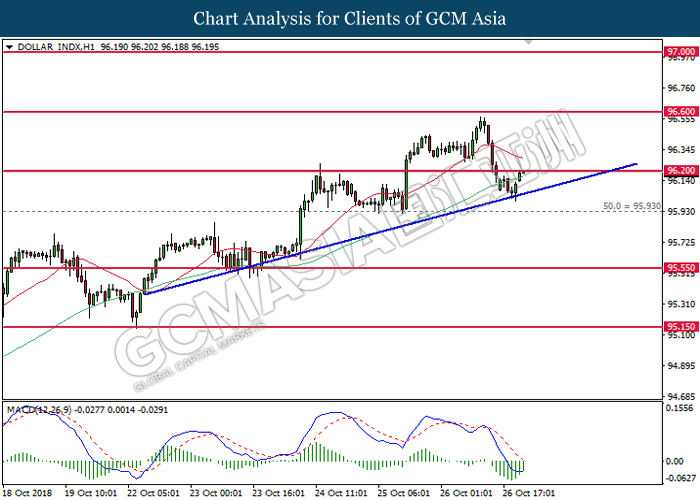
DOLLAR_INDX, H1: Dollar index was traded higher following prior rebound from the upward trendline. MACD which illustrate bullish signal suggests the index to extend its gains after closing above the resistance of 96.20.
Resistance level: 96.20, 96.60
Support level: 95.95, 95.55
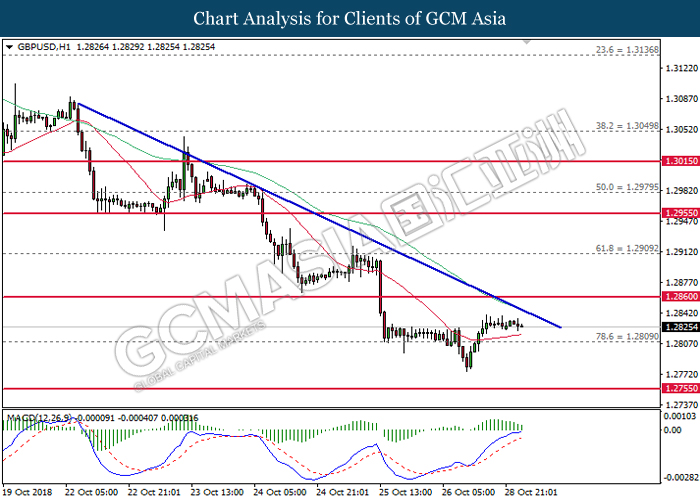
GBPUSD, H1: GBPUSD was traded lower following prior retracement from the downward trendline. MACD which illustrate diminishing upward momentum suggests the pair to extend its losses after closing below 1.2810.
Resistance level: 1.2860, 1.2910
Support level: 1.2810, 1.2755
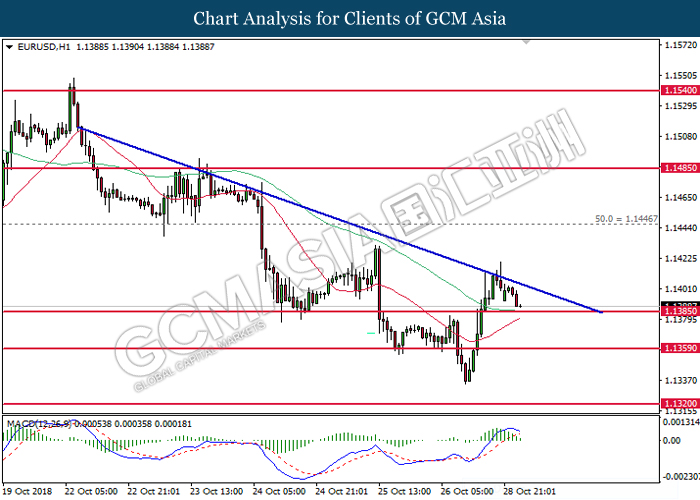
EURUSD, H1: EURUSD was traded lower following prior retracement from the downward trendline. MACD which begins to form death cross signal suggests the pair to extend its losses after breaking the support near 1.1385.
Resistance level: 1.1445, 1.1485
Support level: 1.1385, 1.1360
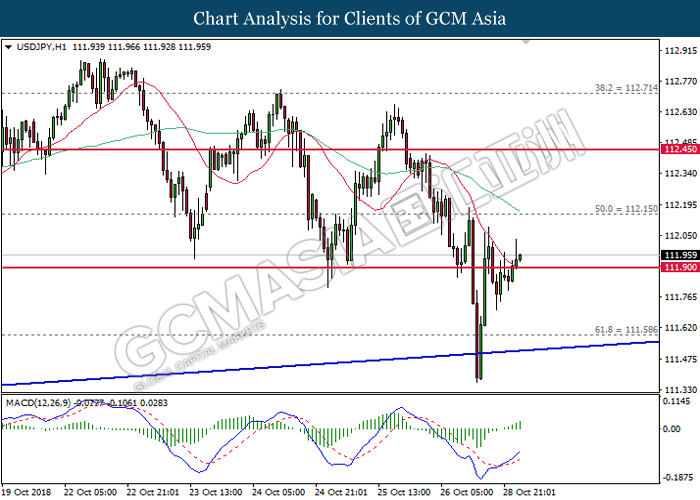
USDJPY, H1: USDJPY was traded higher following prior closure above the 20-MA line (red). MACD which begins to form a golden cross signal suggests the pair to extend its gains, towards the direction of 112.15.
Resistance level: 112.15, 112.45
Support level: 111.90, 111.60
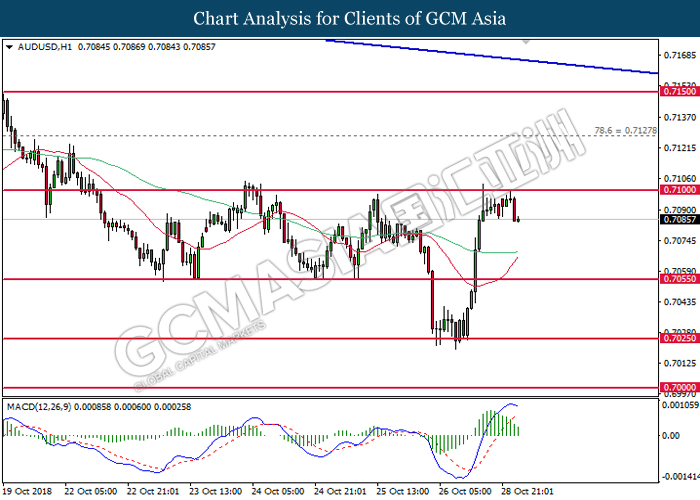
AUDUSD, H1: AUDUSD was traded lower following prior retracement from the resistance level at 0.7100. MACD which illustrate diminishing upward momentum suggests the pair to extend its losses in short-term, towards the direction of 0.7055.
Resistance level: 0.7100, 0.7130
Support level: 0.7055, 0.7025
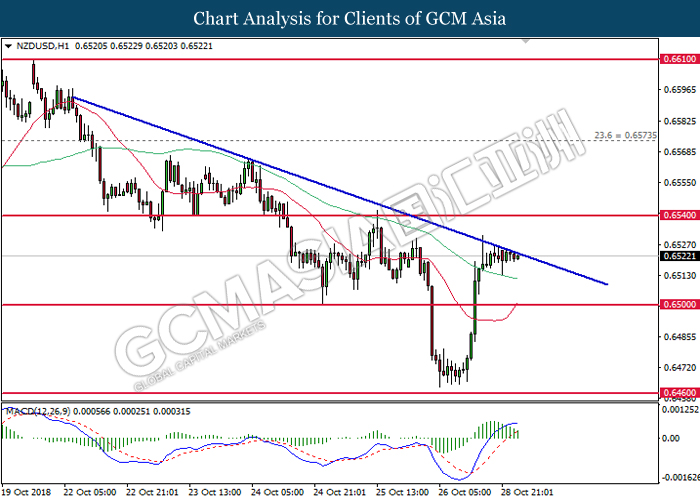
NZDUSD, H1: NZDUSD was traded higher while currently testing near the downward trendline. MACD which illustrate diminishing upward momentum suggests the pair to be traded lower after retracing from the trendline.
Resistance level: 0.6540, 0.6575
Support level: 0.6500, 0.6460
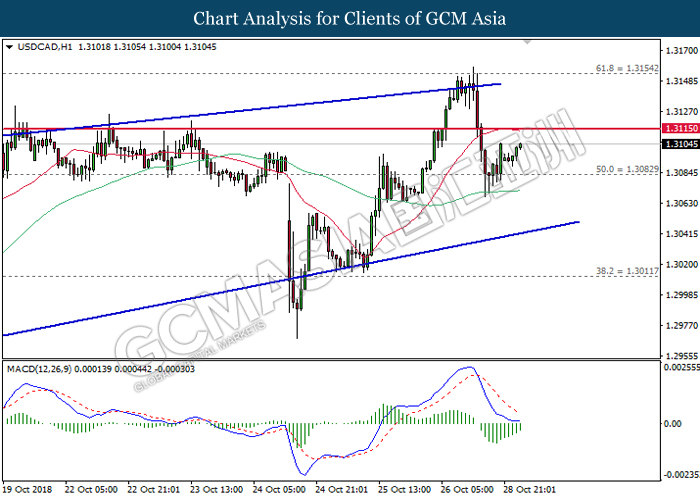
USDCAD, H1: USDCAD was traded higher following prior rebound from the support level at 1.3080. MACD which illustrate diminishing downward momentum suggests the pair to extend its gains after closing above 1.3115.
Resistance level: 1.3115, 1.3155
Support level: 1.3080, 1.3010
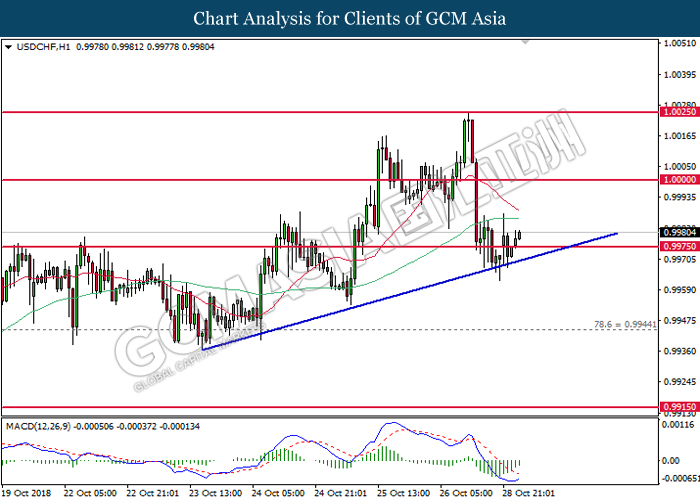
USDCHF, H1: USDCHF was traded higher following prior rebound from the upward trendline. MACD which illustrate diminishing downward momentum suggests the pair to extend its gains in short-term, towards the direction of 1.0000.
Resistance level: 1.0000, 1.0025
Support level: 0.9975, 0.9945
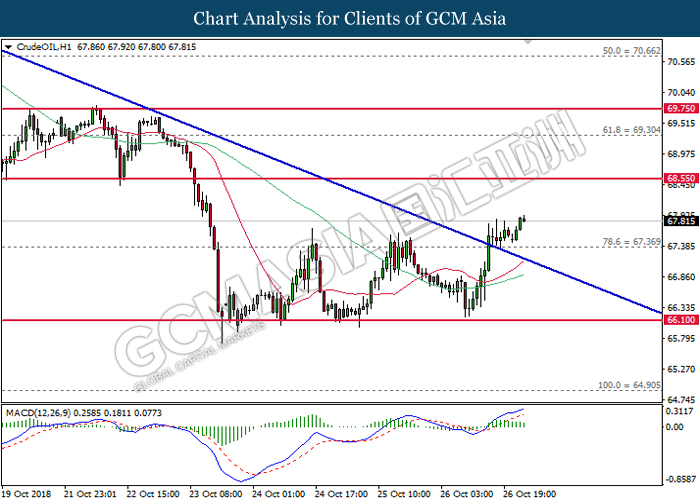
CrudeOIL, H1: Crude oil price was traded higher following prior breakout from the downward trendline. MACD which continues to illustrate upward signal suggests the commodity price to extend its gains, towards the resistance level at 68.55.
Resistance level: 68.55, 69.30
Support level: 67.35, 66.10
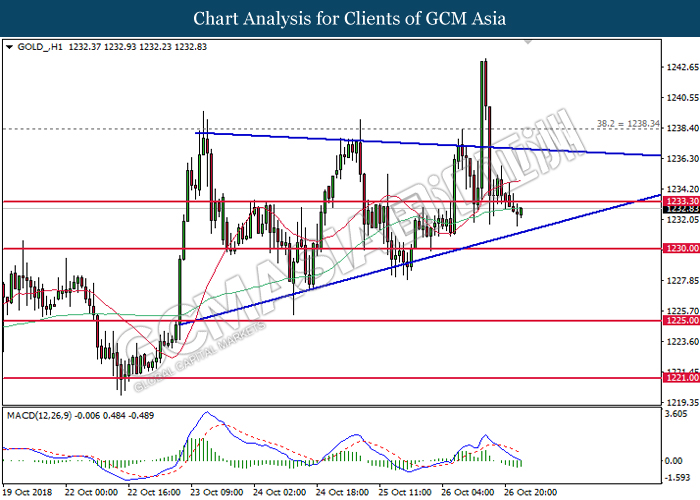
GOLD_, H1: Gold price was traded lower while currently testing at the bottom level of narrowing triangle. MACD which illustrate bearish signal suggests the commodity price to extend its losses after breaking the bottom level of the triangle.
Resistance level: 1233.30, 1238.35
Support level: 1230.00, 1225.00