GCMAsia - USDCHF

USDCHF
2019-04-22
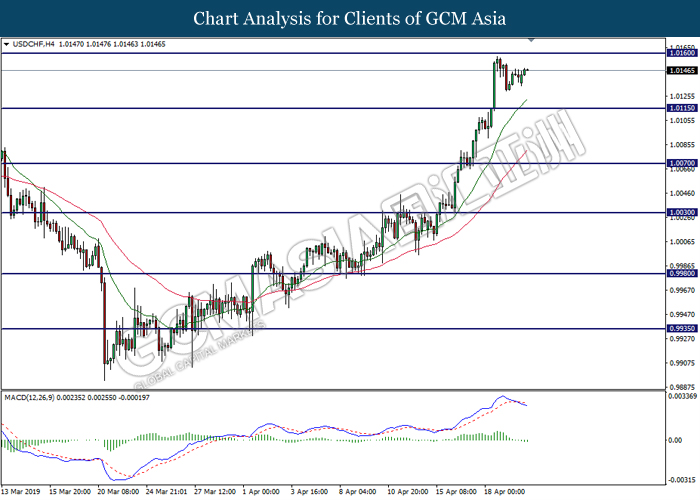
USDCHF, H4: USDCHF was traded higher following prior rebound from lower levels. However, MACD which display bearish momentum with the formation of death cross suggest the pair to undergo short-term technical correction and retrace towards the support level 1.0115.
Resistance level: 1.0160, 1.0225
Support level: 1.0115, 1.0070