GCMAsia - EURUSD

EURUSD
2019-04-23
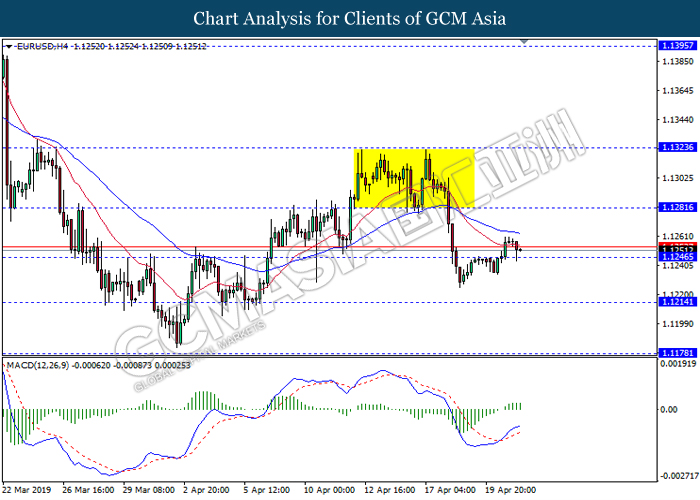
EURUSD, H4: EURUSD was traded lower while currently testing the support level 1.1245. MACD which illustrate diminishing bullish momentum suggest the pair to extend its losses after it breaks below the support level.
Resistance level: 1.1280, 1.1325
Support level: 1.1245, 1.1215