7 May 2018 Weekly Analysis
GCMAsia Weekly Report: May 7 – 11
Market Review (Forex): April 30 – May 4
Greenback hovers near its highest level for the year 2018 as market participants mulled mixed signals from the highly anticipated US jobs market report. The dollar index rose 0.17% while closing off the week at around 92.57 against a basket of six major currencies.
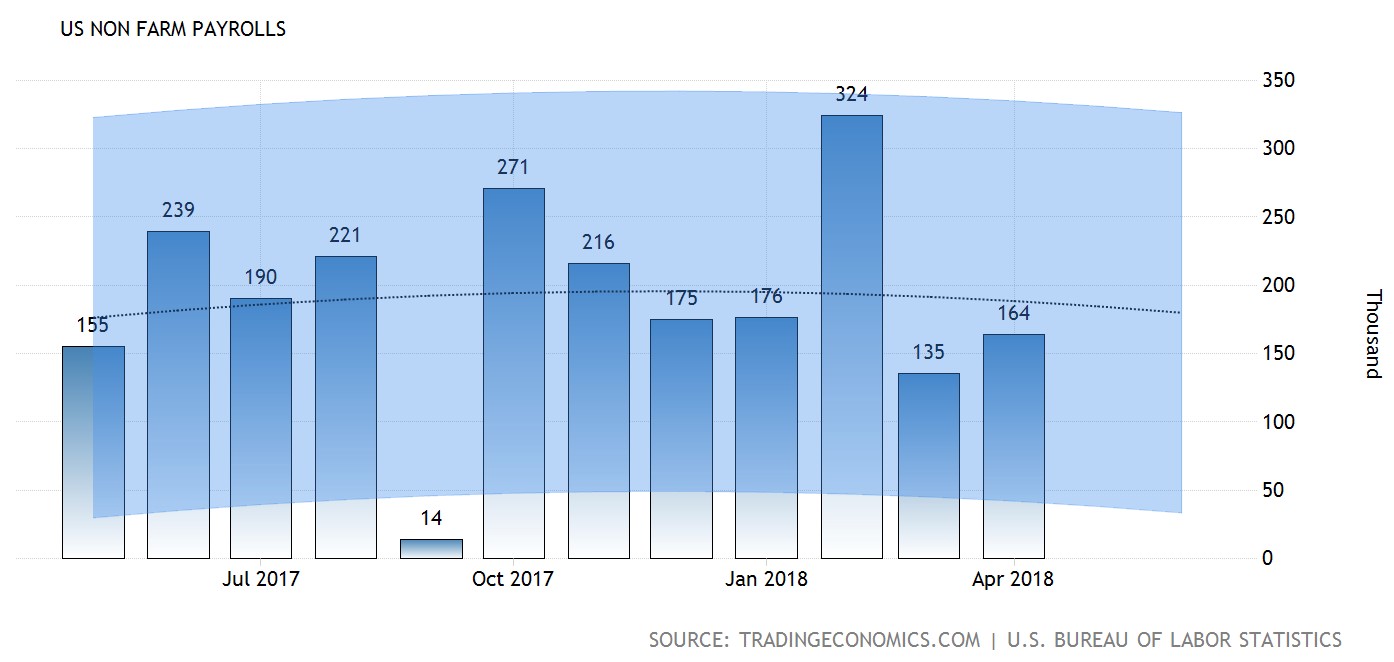
According to the Bureau of Labor Statistics, US economy has generated lesser-than-expected jobs in the month of April, coming in at only 164,000 versus 189,000 seen. US jobs report has been underperformed since the recent two releases after attaining a reading as high as 313,000 jobs generated for the month of January.
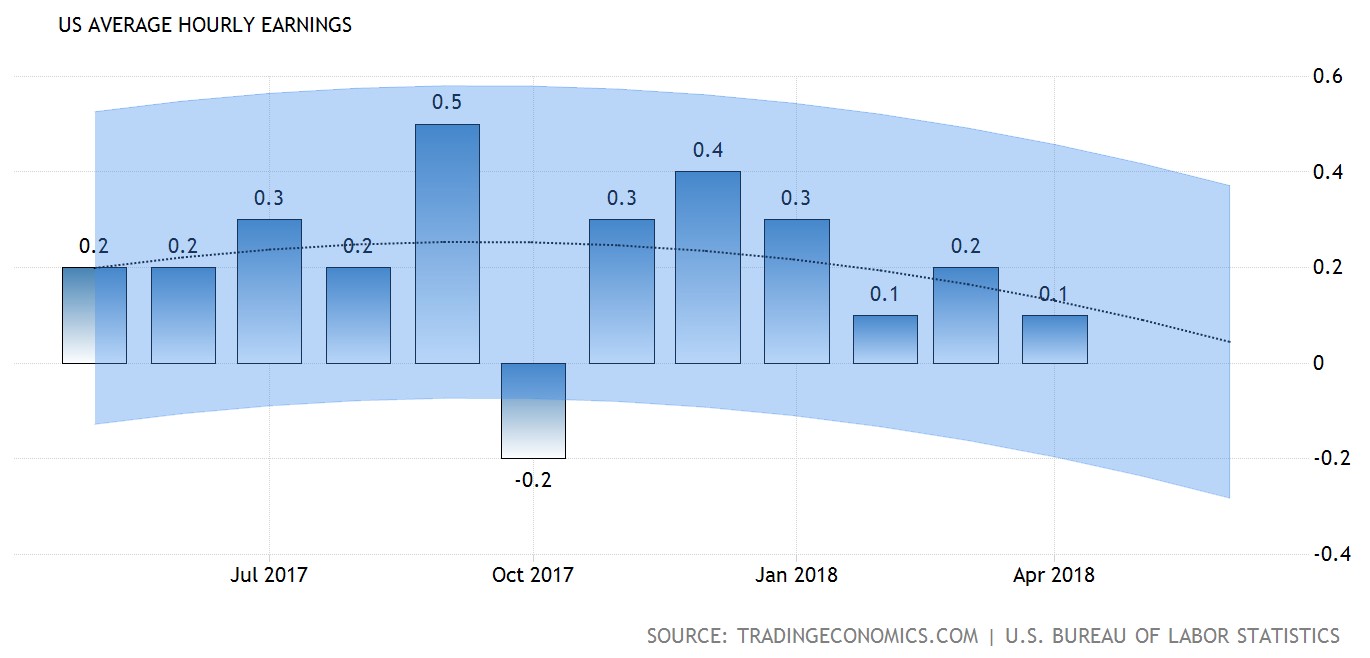
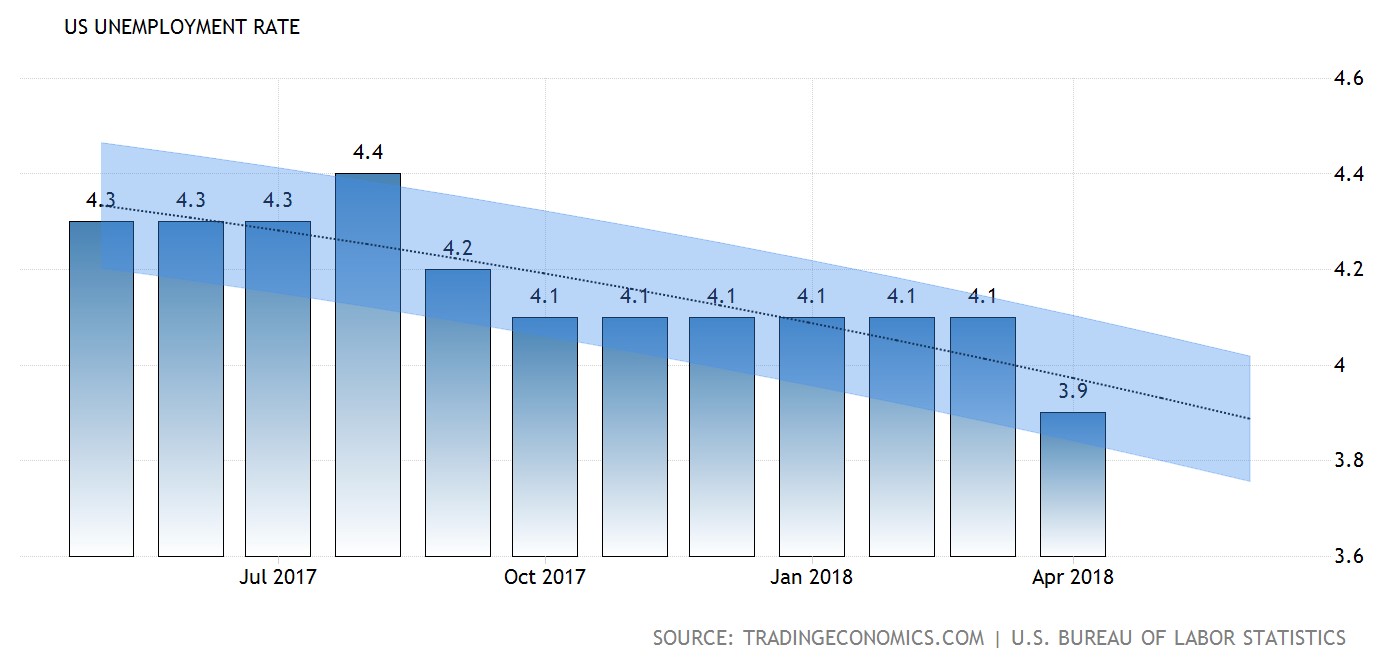
However, what remains as a puzzle to investors is the lower-than-expected wage growth which came in at a minute reading of 0.1% versus economist forecast of 0.2%. Evidently, despite the recent ticked down in unemployment rate by 0.1% to 3.9%, it has failed to spur competitiveness in wages over the backdrop of robust and active hiring. The tepid wage growth may hinder inflationary progression and substantially reduce the chances for a more aggressive rate hike stance from the US Federal Reserve.
Likewise, overall gains on the US dollar remained capped as market participants digests the latest development in US-China trade talks. Overall, uncertainty continues to surround the high-level talks after China’s Vice Premier Liu He and US Treasury Secretary Steven Mnuchin met in Beijing since last Thursday. According to China’s statement, indifferences continues to linger although both parties has reached agreement in some aspects.
The risk for a trade war outburst continues to arise as they approach the US 60-day window for public comment on the proposed tariffs to be enacted upon Chinese imports. China warned that they may retaliate once US tariffs enter effect, substantial escalating trade tensions to the next level while jeopardizing global trade patterns.
US Nonfarm Payrolls
—– Forecast
US Nonfarm Payrolls came in at only 164,000 jobs for the month of April.
US Average Hourly Earnings
—– Forecast
US Average Hourly Earnings misses economist forecast with only 0.1% versus 0.2% for the month of April.
US Unemployment Rate
—– Forecast
US Unemployment rate extended its downward trending, last seen at 3.9% for the month of April.
USD/JPY
Pair of USD/JPY ticked down 0.06% while ending the week at 109.12.
EUR/USD
Pair of EUR/USD extended losses by 0.23% to $1.1961 during late Friday trading. The single common currency remained under pressure following recent weaker-than-expected economic data which has dialed down market’s prospect for European Central Bank to taper their QE anytime soon.
GBP/USD
Pound sterling recorded a loss of 0.33% to $1.3531 against the greenback last Friday. Sterling remains on the back foot for the whole week following a string of weak economic data and political issues within the UK which has spook off market bulls.
Market Review (Commodities): April 30 – May 4
GOLD
Gold price tacked higher during late Friday trading as market participants gear up for higher uncertainty ahead due to lingering geopolitical and trade tensions within the market. Price of the safe-haven asset was up by 0.22% or $2.86, ending the week around $1,315.12 a troy ounce.
Although the yellow metal has averted some of its weekly losses, overall bullish momentum remained capped as prospects for yet another rate hike in the United States remained intact, supporting the recent rally of US dollar. Gold is highly sensitive to interest rates movements in the United States as rising interest may lift the opportunity cost for holding non-yielding assets.
Crude Oil
Crude oil price is a shy away from the psychological threshold of $70 per barrel as market participants increased their bets on the United States to pull out from Iran’s nuclear deal next week. Price of the black commodity rose 1.88% while closing the week at $69.78 per barrel.
Ahead of US President Donald Trump’s decision to stay or withdraw from the Iran nuclear deal, traders appeared to have bet and priced in Trump’s decision for the latter that may reimpose fresh sanctions on the oil producing country. Sanctions may limit their ability to export crude oils and may significantly reduce the bearish pressure over global oversupply glut and oil prices.
However, gains on the oil prices were limited by the rising crude production in the United States. According to oilfield service firm, Baker Hughes reported that the number of active drilling rig rose by 9 to a total of 834. The relentless pace of US oil expansion has achieved its new record high of 10.6 million barrels per day, not far from the world’s biggest oil exporter – Russia which currently hovers around 11 million barrels per day.
Weekly Outlook: May 7 – 11
For the week ahead, investors will be anticipating the results from Bank of England’s policy meeting on Thursdays for further clues with regards to their stance towards interest rate hike. Otherwise, market participants will closely monitor the developments of US-China trade talks to gauge the overall trade war risk and tension that may escalate to a higher market momentum.
As for oil traders, they will be eyeing on US inventories level reported by API and EIA to gauge the strength of crude demand for world’s largest oil consumer.
Highlighted economy data and events for the week: May 7 – 11
| Monday, May 7 |
Data EUR – German Factory Orders (MoM) (Mar) CHF – CPI (MoM) (Apr)
Events USD – FOMC Member Bostic Speaks
|
| Tuesday, May 8 |
Data AUD – Retail Sales (MoM) (Mar) CNY – Trade Balance (USD) (Apr) EUR – German Industrial Production (MoM) (Mar) EUR – German Trade Balance (Mar) GBP – Halifax House Price Index (YoY) (Apr) USD – JOLTs Job Openings (Mar)
Events USD – FOMC Member Kaplan Speaks USD – Fed Chair Powell Speaks
|
| Wednesday, May 9 |
Data CrudeOIL – API Weekly Crude Oil Stock GBP – BRC Retail Sales Monitor (YoY) (Apr) AUD – Westpac Consumer Sentiment (May) USD – PPI (MoM) (Mar) CAD – Building Permits (MoM) (Mar) CrudeOIL – Crude Oil Inventories CrudeOIL – Gasoline Inventories
Events N/A
|
| Thursday, May 10 |
Data NZD – RBNZ Interest Rate Decision CNY – CPI (YoY) (Apr) CNY – PPI (YoY) (Apr) GBP – Manufacturing Production (MoM) (Mar) GBP – Trade Balance (Mar) GBP – BoE Interest Rate Decision (May) USD – Core CPI (MoM) (Apr) USD – Initial Jobless Claims CAD – New Housing Price Index (MoM) (Mar)
Events NZD – RBNZ Rate Statement NZD – RBNZ Press Conference NZD – RBNZ Gov Orr Speaks GBP – BoE Inflation Report
|
|
Friday, May 11
|
Data USD – Import Price Index (MoM) (Apr) CAD – Employment Change (Apr) CAD – Unemployment Rate (Apr) USD – Michigan Consumer Sentiment (May) CrudeOIL – US Baker Hughes Oil Rig Count
Events USD – FOMC Member Bullard Speaks EUR – ECB President Draghi Speaks
|
Technical Weekly Outlook: May 7 – 11
Dollar Index
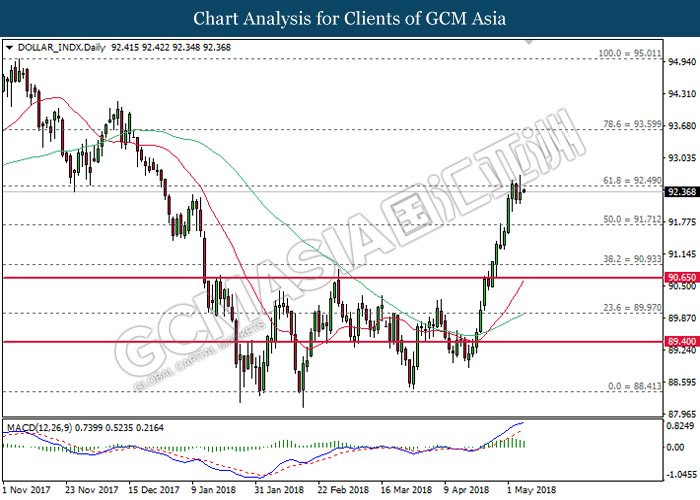
DOLLAR_INDX, Daily: Dollar index was traded lower following prior retracement from the resistance level near 92.50. MACD histogram which illustrate some diminishing upward momentum may suggests the index to be traded lower in short-term as technical correction before extending its bullish bias.
Resistance level: 92.50, 93.60
Support level: 91.70, 90.95
GBPUSD
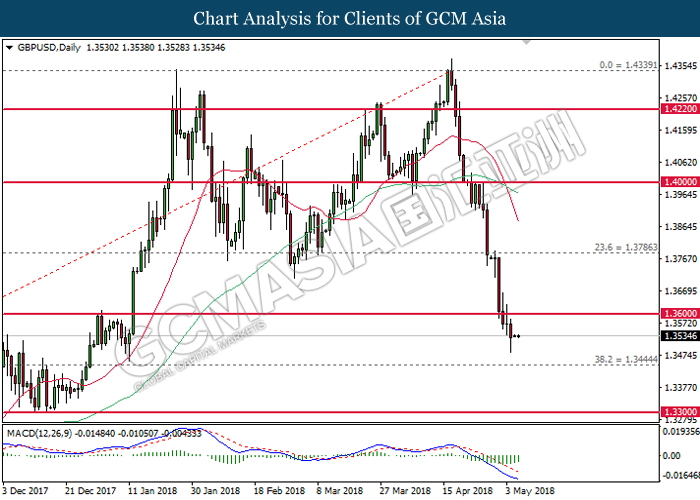
GBPUSD, Daily: GBPUSD extended losses following prior breakout near the support level of 1.3600. MACD histogram which illustrate some diminished downward momentum may suggest the pair to be traded higher in short-term as technical correction before advancing further down in conjunction with current bearish major trend.
Resistance level: 1.3600, 1.3785
Support level: 1.3445, 1.3300
USDJPY
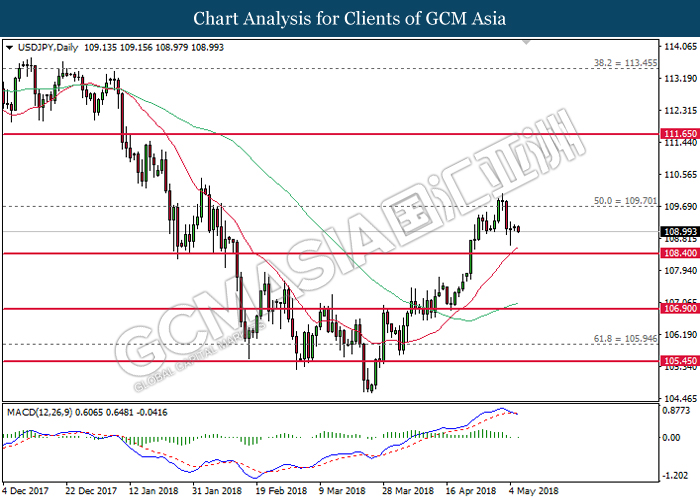
USDJPY, Daily: USDJPY was traded lower following prior retrace from the threshold of 109.70. MACD histogram which begins to form a death cross signal suggests the pair to extend its losses in short-term, towards the direction of 20-MA line (red) near 108.40.
Resistance level: 109.70, 111.65
Support level: 108.40, 106.90
EURUSD
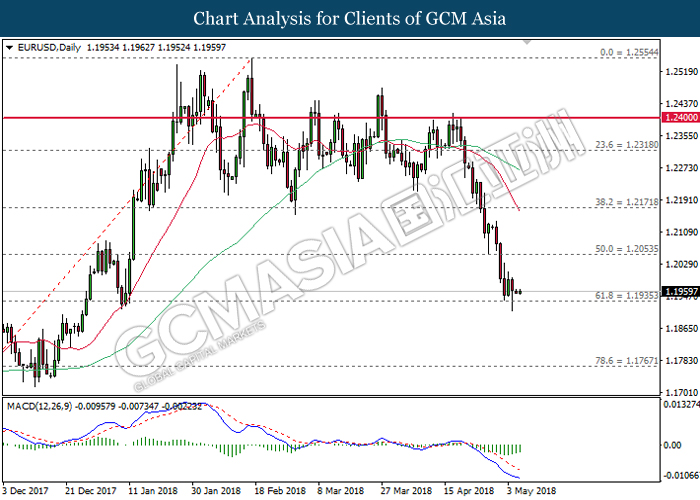
EURUSD, Daily: EURUSD was traded higher following prior rebound while currently testing near the strong support level of 1.1935. MACD histogram which illustrate diminishing downward momentum may suggests the pair to be traded higher in short-term as technical correction. Otherwise, long-term trend direction is skewed towards bearish.
Resistance level: 1.2055, 1.2170
Support level: 1.1935, 1.1770
GOLD
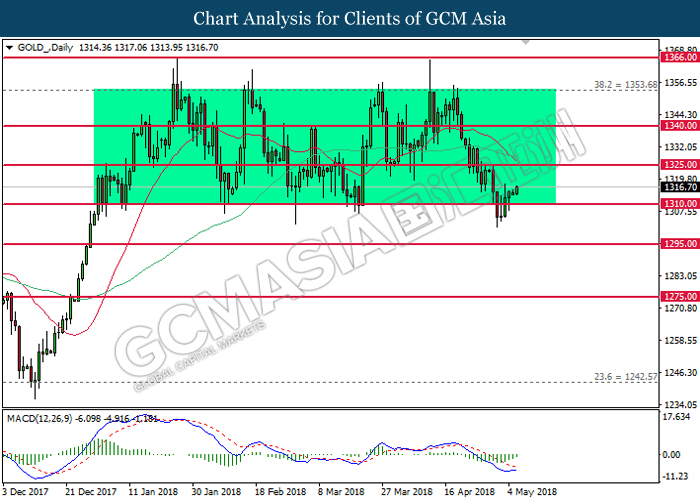
GOLD_, Daily: Gold price re-enters into the sideways channel following prior rebound and closure above the support level at 1310.00. MACD histogram which illustrate diminishing downward momentum may suggest the commodity price to extend its gains after closing above the 20-MA line (red) near 1325.00.
Resistance level: 1325.00, 1340.00
Support level: 1310.00, 1295.00
Crude Oil
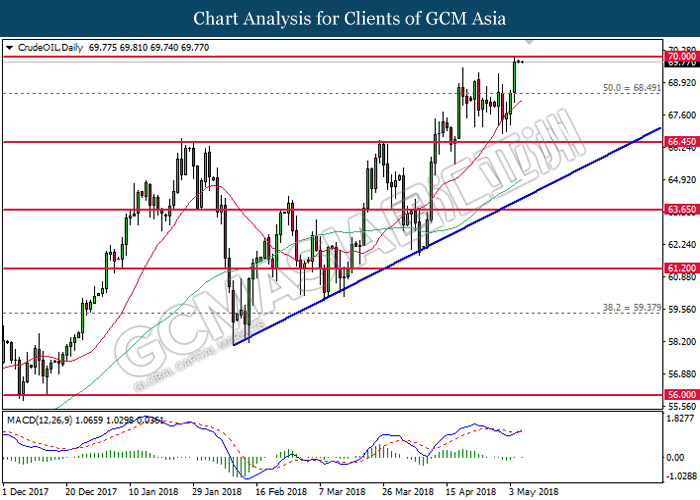
CrudeOIL, Daily: Crude oil price was traded higher following a bullish close above the resistance level at 68.50. MACD histogram which forms a golden cross signal suggests further bullish bias. However, a break above the threshold of 70.00 is required to attain further confirmation.
Resistance level: 70.00, 74.15
Support level: 66.45, 63.65