9 July 2018 Weekly Analysis
GCMAsia Weekly Report: July 9 – 13
Market Review (Forex): July 2 – 6
Greenback extended its losses on Friday following mixed US jobs report while coupled with recent escalation in trade war risk against China. The dollar index was quoted down 0.54%, ending the week at 93.96 against a basket of six major currencies.
According to US Labor Department, the economy added 213,000 jobs in June, exceeding economist forecast of 200,000 jobs. However, unemployment rate ticked up 0.2% from 3.8% to 4.0%, confounding expectations to remain unchanged at 3.8%. Likewise, average hourly earnings grew at a slower pace with only 0.2%, undershooting forecast for 0.3% increase.
Federal Reserve’s view that a tighter labor market would lead to wage growth and increasing inflationary pressure may be undermined as monthly hourly earnings rise slower than expected. The data has prompted investors to ponder whether the Fed could initiate two more interest rate hike during the second half of the year.
In addition, further bearish momentum was evoked after US kicked off trade tariff against China on Friday, raising the prospect for an imminent trade war between the two world largest economic superpowers. Though, the reaction on safe haven asset were muted as it is largely priced in by investors.
USD/JPY
Pair of USD/JPY tumbled down 0.17% to 110.47 during late Friday trading.
EUR/USD
Euro rose 0.47%, ending the week at $1.1745 against the US dollar.
GBP/USD
Pairing of GBP/USD tacked up 0.48%, closing the week at around $1.3287.
Market Review (Commodities): July 2 – 6
GOLD
Gold price extended its losses amid dollar’s weakness following higher prospect for further interest rate hike from the Federal Reserves in the long-run. Price of the yellow metal was down 0.22% or $2.77 to $1,255.02 a troy ounce.
The safe-haven asset failed to snap its three-week losing streak as higher prospect for interest rate hike in the long-term continues to cap any substantial recovery on its prices. Although recent enactment of tariff upon China goods raised higher risk of a trade war, most economist believes that the factor has been mostly priced in prior to the announcement.
Crude Oil
Crude oil price settled higher last Friday following higher prospect for a market supply shortage due to looming sanctions against Iran. Price of the black commodity skyrocketed by 1.04% to $74.00 per barrel during late Friday trading hours.
Investors continue to bet on a global crude supply shortage due to rising oil demand in the market while coupled with a potential drop in oil producing countries such as Iran and Venezuela. Prior, US vowed to slap hefty sanctions upon Iran’s crude exports due to recent drawback in nuclear deal between both countries. Likewise, ongoing challenges in Venezuela oil industry has also further supported the bullish sentiment.
However, gains on the commodity were capped after US oilfield services firm reported a rise in US oil rigs. According to Baker Hughes, the number of active drilling rigs rose by 5 last week to a total of 863. The report shows a sharp rebound in oil production activities that may signal potential expansion and increase in domestic crude output. In addition, Saudi Arabia recently informed OPEC that they raise output by 458,000 barrels per day in order to counter with imminent shortage arising from Venezuela and Iran to control oil prices.
Weekly Outlook: July 9 – 13
For the week ahead, investors will pay attention to major economic release in the United States especially inflation-linked indicators such as CPI and PPI. The data could provide further signals with regards to Federal Reserve’s future monetary policy stance and rate hike prospects.
On the other hand, oil traders will pay attention to monthly report bound to be released by International Energy Agency (IEA) and Organization of the Petroleum Exporting Countries (OPEC) to gauge the strength of global oil demand and supply.
Highlighted economy data and events for the week: July 9 – 13
| Monday, July 9 |
Data EUR – German Trade Balance (May)
Events USD – FOMC Member Kashkari Speaks EUR – ECB President Draghi Speaks
|
| Tuesday, July 10 |
Data CNY – CPI (YoY) (Jun) CNY – PPI (YoY) (Jun) GBP – Manufacturing Production (MoM) (May) EUR – German ZEW Economic Sentiment (Jul) USD – JOLTs Job Openings (May)
Events N/A
|
| Wednesday, July 11 |
Data CrudeOIL – API Weekly Crude Oil Stock USD – PPI (MoM) (Jun) CAD – BoC Interest Rate Decision CrudeOIL – Crude Oil Inventories CrudeOIL – Gasoline Inventories
Events CAD – BoC Monetary Policy Report CAD – BoC Press Conference
|
| Thursday, July 12 |
Data EUR – German CPI (MoM) (Jun) USD – Core CPI (MoM) (Jun) USD – Initial Jobless Claims
Events USD – FOMC Member Williams Speaks EUR – ECB Publishes Account of Monetary Policy Meeting USD – FOMC Member Kashkari Speaks
|
|
Friday, July 13
|
Data CNY – Trade Balance (USD) (Jun) USD – Import Price Index (MoM) (Jun) USD – Michigan Consumer Sentiment (Jul) CrudeOIL – US Baker Hughes Oil Rig Count
Events USD – FOMC Member Harker Speaks USD – FOMC Member Bostic Speaks
|
Technical Weekly Outlook: July 9 – 13
Dollar Index
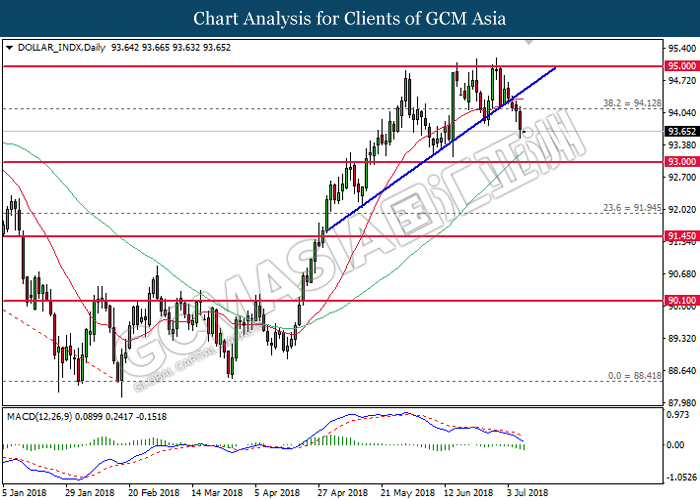
DOLLAR_INDX, Daily: Dollar index extended its losses following prior breakout from the upward trendline. MACD histogram which illustrate persistent bearish signal suggests the index to advance further down, towards the direction of 93.00.
Resistance level: 94.10, 95.00
Support level: 93.00, 91.95
GBPUSD
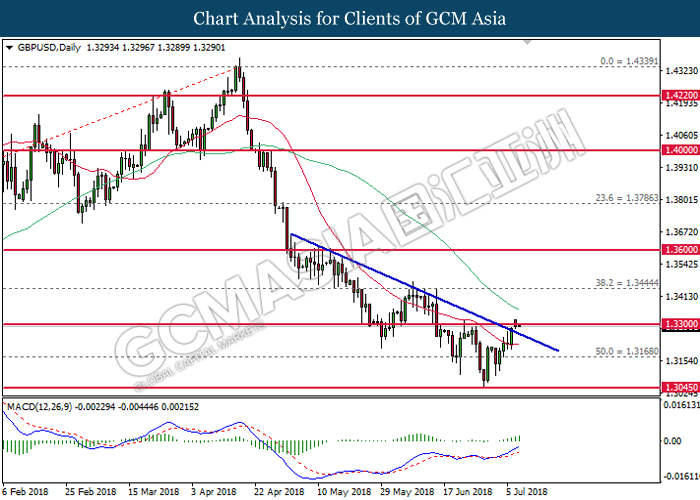
GBPUSD, Daily: GBPUSD was traded higher following prior rebound from the support level of 1.3045. MACD histogram which illustrate bullish signal suggests the pair to extend its gains after successfully closing above the threshold of 1.3300.
Resistance level: 1.3300, 1.3445
Support level: 1.3170, 1.3045
USDJPY
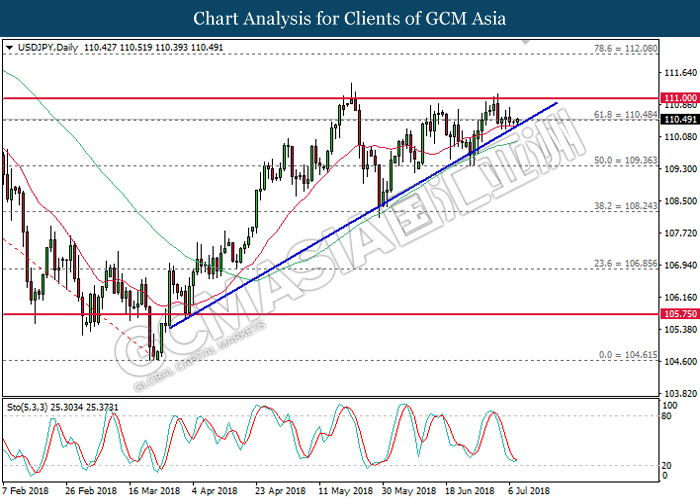
USDJPY, Daily: USDJPY was traded in an ascending triangle formation while currently testing at the bottom level. Although Stochastic Oscillator begins to form a rebound signal, USDJPY requires a bullish closure above the trendline to further validate such bias.
Resistance level: 110.50, 111.00
Support level: 109.35, 108.25
EURUSD
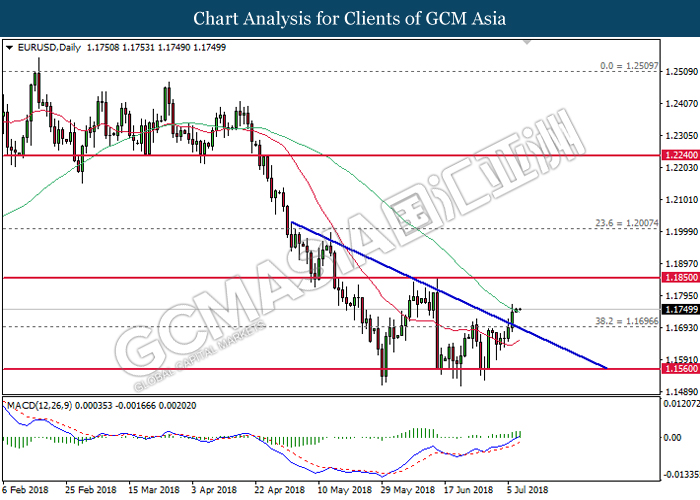
EURUSD, Daily: EURUSD extended gains following prior breakout from the top level of descending triangle. MACD histogram which illustrate persistent upside bias suggests the pair to advance further up after closing above the 60-MA line (green).
Resistance level: 1.1850, 1.2010
Support level: 1.1700, 1.1560
GOLD
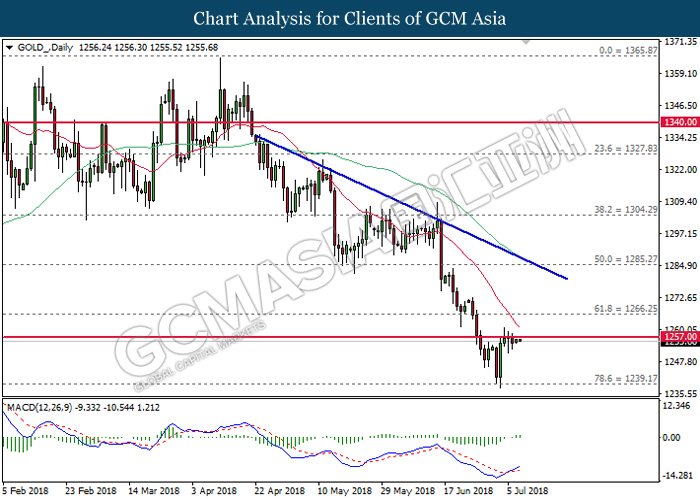
GOLD_, Daily: Gold price was traded higher following prior rebound from the support level of 1239.15. While the MACD histogram begins to form a bullish crossover, a close above 1257.00 is required to attain further confirmation.
Resistance level: 1257.00, 1266.25
Support level: 1239.20, 1225.00
Crude Oil
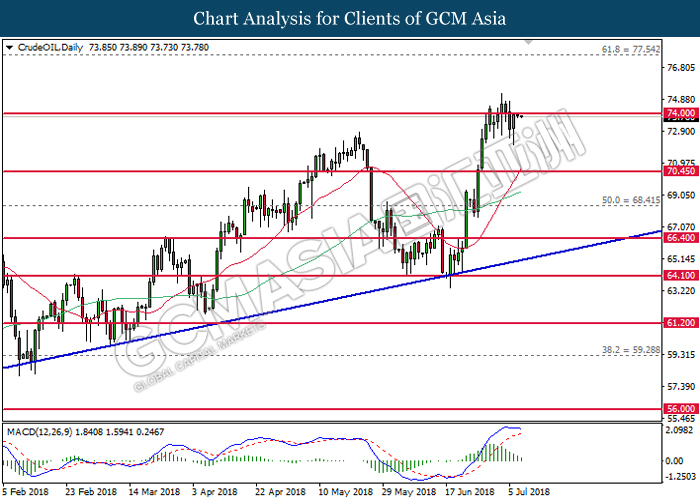
CrudeOIL, Daily: Crude oil price was traded lower following prior retracement from the strong resistance at 74.00. MACD histogram which illustrate diminishing upward momentum suggests the commodity price to be traded lower in short-term as technical correction. Long-term trend direction is still subject to upward trendline.
Resistance level: 74.00, 77.55
Support level: 70.45, 68.40