11 June 2019 Morning Session Analysis
US jobs market slows further.
US dollar was traded flat against other major peers on yesterday while investors digests recent sluggishness in the jobs market. According to JOLTs, its Job Openings survey came in at only 7.449 million vacancies, missing economist forecast for a reading of 7.479 million vacancies. A lower than expected job openings in the month of April was consistent with a slowdown in hiring as seen from last Friday’s Nonfarm Payrolls. Report. The lack of improvement in terms of job openings shows diminishing demand for labor and it has raised more prospect in the market for an interest rate cut from US Federal Reserve later this year. For the time being, investors will shift their attention towards major economic releases throughout the week such as PPI, CPI and Retail Sales to attain further signals. On the other hand, pound sterling received higher short orders on yesterday following the release of bearish economic data. For the month of April, UK’s Gross Domestic Product contracted by -0.4%, missing economist forecast for a contraction of up to -0.1%. As of writing, dollar index ticks up 0.01% to 96.67 while GBP/USD was down by 0.03% to 1.2687.
In terms of commodities, crude oil price rose 0.13% to $53.45 per barrel. Oil prices stabilized during early Asian hours while investors expect OPEC and its allies to extend the oil production cut agreement later this month. On the other hand, gold price notched up 0.06% to $1,328.67 a troy ounce due to lingering risks in the market.
Today’s Holiday Market Close
Time Market Event
N/A
Today’s Highlight Events
Time Market Event
N/A
Today’s Highlight Economic Data
| Time | Market & Data | Previous | Forecast | Actual |
| 16:30 | GBP – Average Earnings Index +Bonus (Apr) | 3.2% | 2.9% | – |
| 16:30 | GBP – Claimant Count Change (May) | 24.7K | 22.9K | – |
| 20:30 | USD – PPI (MoM) (May) | 0.2% | 0.1% | – |
| 05.30
(12th) |
CrudeOIL – API Weekly Crude Oil Stock | 3.545M | – | – |
Technical Analysis
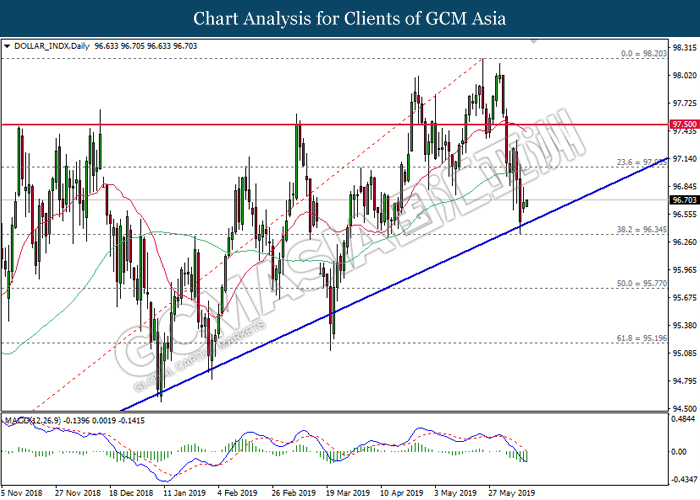
DOLLAR_INDX, Daily: Dollar index was traded higher following prior rebound from the upward trendline. MACD which illustrate diminishing downward momentum suggests the index to be traded higher in short-term as technical correction.
Resistance level: 97.05, 97.50
Support level: 96.35, 95.80
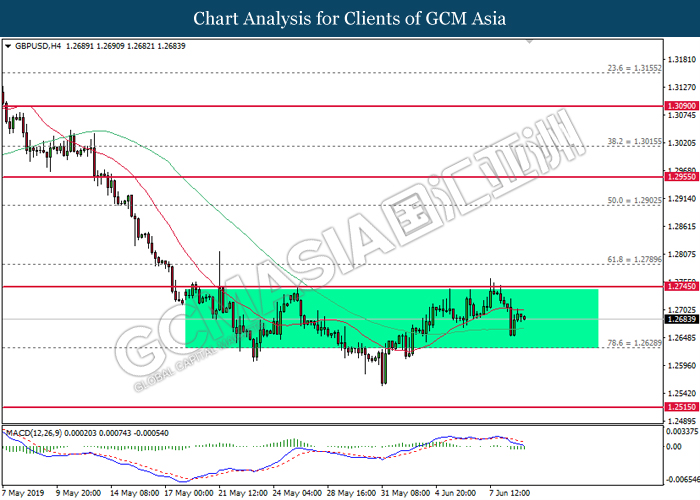
GBPUSD, H4: GBPUSD was traded lower following prior retracement from the top level of sideways channel. MACD which illustrate bearish signal suggests the pair to be traded lower after closing below the 60-MA line (green).
Resistance level: 1.2745, 1.2790
Support level: 1.2630, 1.2515
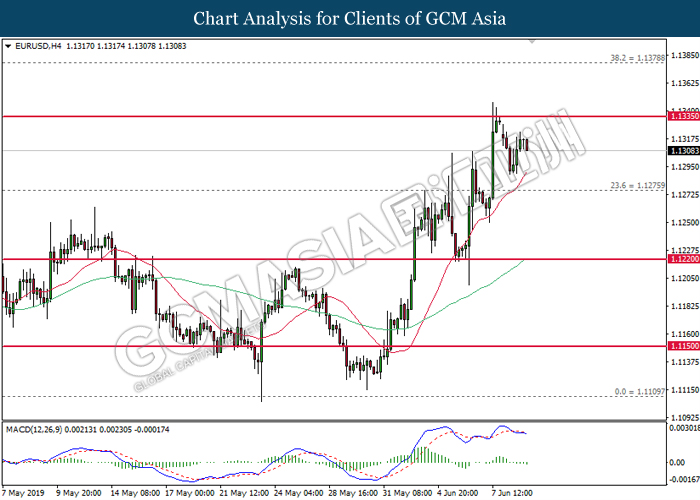
EURUSD, H4: EURUSD was traded lower following prior retracement from the upper level. MACD which begins to form a death cross signal suggests the pair to be traded lower in short-term as technical correction.
Resistance level: 1.1335, 1.1380
Support level: 1.1275, 1.1220
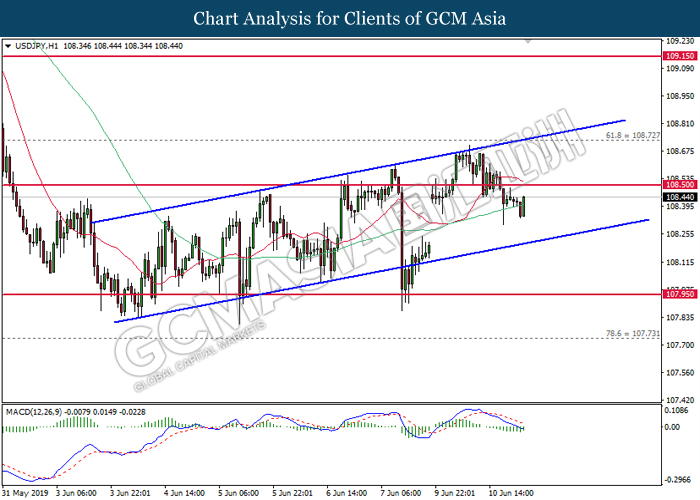
USDJPY, H1: USDJPY remains traded within an upward channel formation. However, MACD which illustrate diminishing downward momentum suggests the pair to be traded higher in short-term as technical correction.
Resistance level: 108.50, 108.70
Support level: 107.95, 107.70
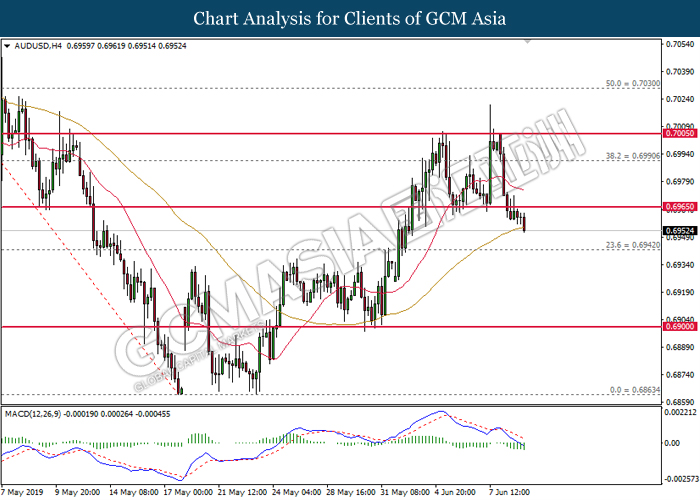
AUDUSD, H4: AUDUSD was traded lower while currently testing near the 60-MA line (green). MACD which illustrate bearish signal suggests the pair to advance further down after closing below the MA line.
Resistance level: 0.6965, 0.6990
Support level: 0.6940, 0.6900
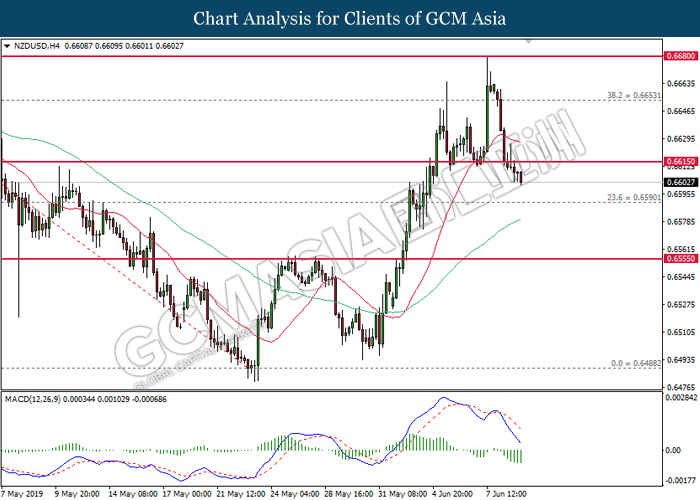
NZDUSD, H4: NZDUSD was traded lower following prior closure below 0.6615. MACD which illustrate bearish signal suggests the pair to extend its losses, towards the direction of 0.6590.
Resistance level: 0.6615, 0.6655
Support level: 0.6590, 0.6555
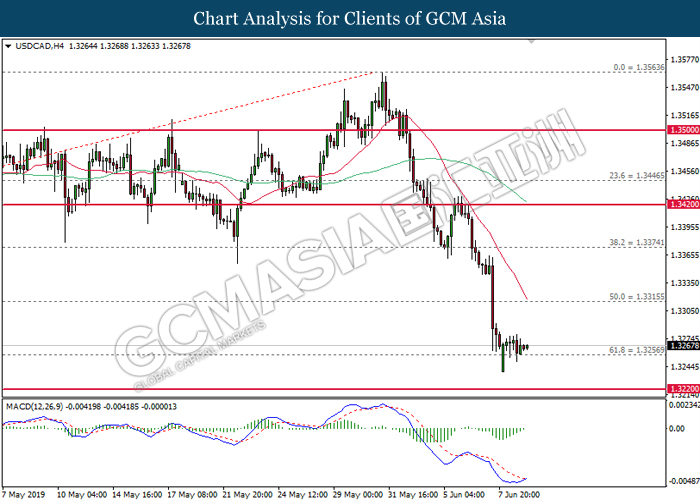
USDCAD, H4: USDCAD was traded higher following prior rebound from lower levels. MACD which illustrate bullish signal suggests the pair to extend its rebound in short-term as technical correction.
Resistance level: 1.3315, 1.3375
Support level: 1.3255, 1.3220
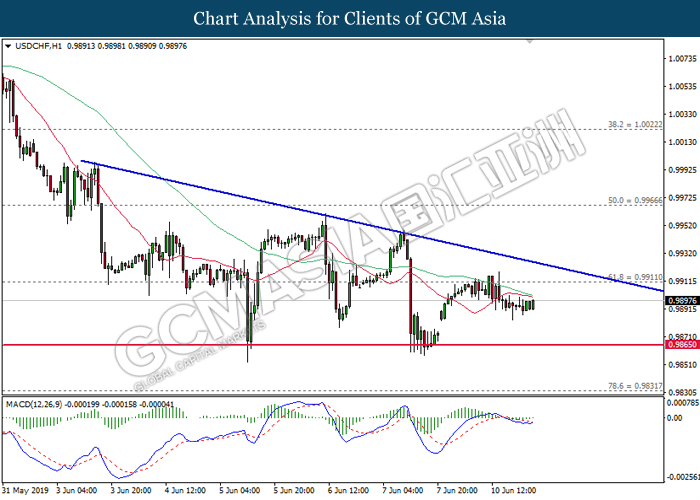
USDCHF, H1: USDCHF remains traded within a descending triangle formation. MACD which illustrate diminishing downward momentum suggests the pair to be traded higher in short-term as technical correction.
Resistance level: 0.9910, 0.9965
Support level: 0.9865, 0.9810
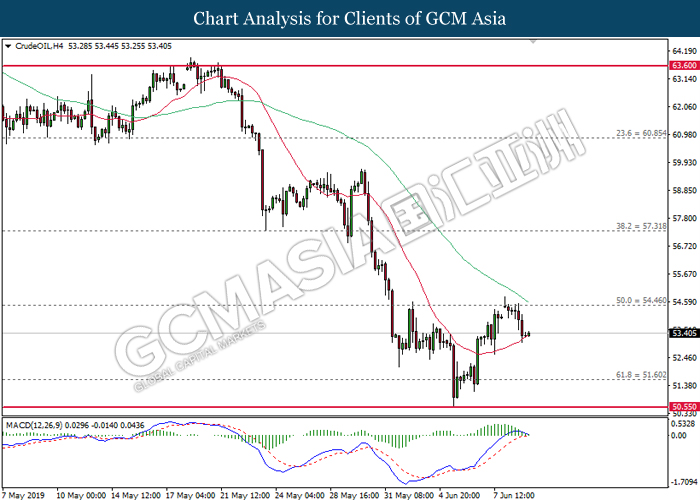
CrudeOIL, H4: Crude oil price was traded lower while currently testing near the 20-MA line (red). MACD which begins to form a bearish signal suggests its prices to be traded lower after closing below the MA line.
Resistance level: 54.45, 57.30
Support level: 51.60, 50.55
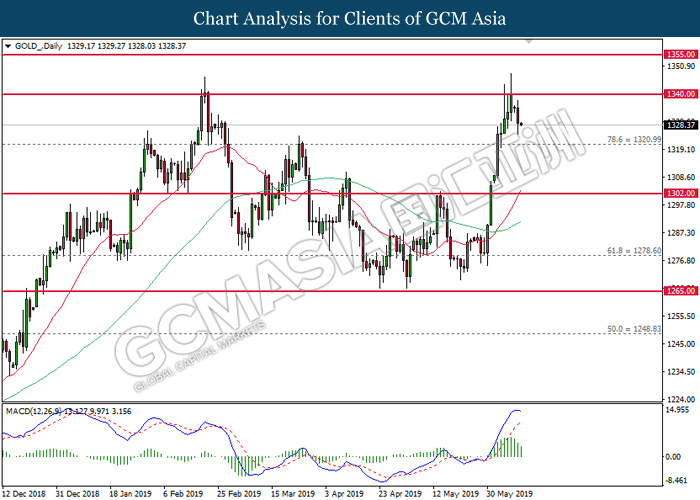
GOLD_, Daily: Gold price was traded lower following prior retracement from the resistance level near 1340.00. MACD which illustrate diminishing upward momentum suggests its prices to be traded lower in short-term as technical correction.
Resistance level: 1340.00, 1355.00
Support level: 1321.00, 1302.00