16 July 2018 Weekly Analysis
GCMAsia Weekly Report: July 16 – 20
Market Review (Forex): July 9 – 13
US Dollar
Greenback retreats from its prior two-weeks high against other major peers last Friday following a sharp rebound of pound sterling. Dollar index recorded a loss of 0.14% while ended the week around 94.68 during late American trading hours.
Overall, dollar-bulls remained subdued throughout the week following Thursday’s release of Consumer Price Index (CPI). According to reports, consumer prices for last month grew slower than expected with only 0.1%, missing economist forecast of 0.2%. The data has raised some concerns that the Federal Reserve may not follow through their aggressive pace of monetary tightening if inflationary pressure remains muted.
However, the current downside on the greenback remains limited as majority of market participants remains optimistic towards US economy in the event of a full-blown trade war between Washington and Beijing. According to reports, more than 70% of US economy relies on services sector, giving them the advantage to sustain recessive risk as compared to its export-reliant peers such as EU or China.
USD/JPY
Pair of USD/JPY was down 0.12% to 112.38 during late Friday trading.
EUR/USD
Euro extended gains by 0.13% to $1.1686 against the US dollar.
GBP/USD
Sterling recovered its losses by 0.23% to $1.3236 against the greenback. The currency rebounds from its 11-day low after US President Donald Trump back tracks his criticism against British Prime Minister Theresa May by claiming that US-UK trade deal is still possible.
Market Review (Commodities): July 9 – 13
GOLD
Gold price threads lower last Friday while a weaker dollar failed to lift overall sentiment towards safe-haven assets. Price of the yellow metal was quoted down 0.44% to $1,241.61 a troy ounce, its lowest level in seven months.
The yellow metal resumed its bearish momentum following hawkish speculation towards the Federal Reserve within the market. Ongoing trade war in between the US and China which slaps tariff at one another may increase domestic consumer prices more rapidly, prompting Federal Reserve to adopt aggressive monetary tightening in the long-run.
Crude Oil
Crude oil price settled higher on Friday although gains remains limited due to rising supply in the global market. Price of the black commodity recovered its losses by 0.24% to $70.59 per barrel.
Earlier this week, crude oil price fell nearly 4% following mixed signals in the market. In the pessimistic front, Libya announced that it would reopen four of its oil export terminals, with an estimation of 0.7 million barrels per day of oil to return into the market supply.
On the other hand, International Energy Agency reported that major oil producers may experience potential capacity crunch and they may fail to curtail an imminent supply shortage that arise from Venezuela and Iran.
All in all, sentiment towards the commodity skewed towards bullish last Friday following the release of weekly report from Baker Hughes. According to the oilfield services provider, US oil rig count remained unchanged at 863, signaling a halt in oil expansion activities.
Weekly Outlook: July 16 – 20
For the week ahead, investors will place their attention on major economic data release from the US, EU and UK in order to gauge respective country’s economic condition and progression.
As for oil traders, they will be eyeing on US inventories level reported by API and EIA to gauge the strength of crude demand for world’s largest oil consumer.
Highlighted economy data and events for the week: July 16 – 20
| Monday, July 16 |
Data CNY – GDP (QoQ) (Q2) USD – Core Retail Sales (MoM) (Jun) USD – Retail Sales (MoM) (Jun) USD – NY Empire State Manufacturing Index (Jul) CAD – Foreign Securities Purchases (May) USD – Business Inventories (MoM) (May)
Events N/A
|
| Tuesday, July 17 |
Data NZD – GDP (QoQ) (Q2) GBP – Average Earnings Index +Bonus (May) GBP – Claimant Count Change (Jun) CAD – Manufacturing Sales (MoM) (May) USD – Industrial Production (MoM) (Jun)
Events AUD – RBA Meeting Minutes USD – Fed Chair Powell Speaks
|
| Wednesday, July 18 |
Data CrudeOIL – API Weekly Crude Oil Stock GBP – CPI (YoY) (Jun) EUR – CPI (YoY) (Jun) USD – Building Permits (Jun) CrudeOIL – Crude Oil Inventories CrudeOIL – Gasoline Inventories
Events USD – Fed Chair Powell Speaks
|
| Thursday, July 19 |
Data AUD – Employment Change (Jun) GBP – Retail Sales (MoM) (Jun) USD – Philadelphia Fed Manufacturing Index (Jul) USD – Philly Fed Employment (Jul)
Events N/A
|
|
Friday, July 20
|
Data JPY – National Core CPI (YoY) (Jun) EUR – German PPI (MoM) (Jun) CAD – Core CPI (MoM) (Jun) CAD – Core Retail Sales (MoM) (May) CrudeOIL – US Baker Hughes Oil Rig Count
Events N/A
|
Technical Weekly Outlook: July 16 – 20
Dollar Index
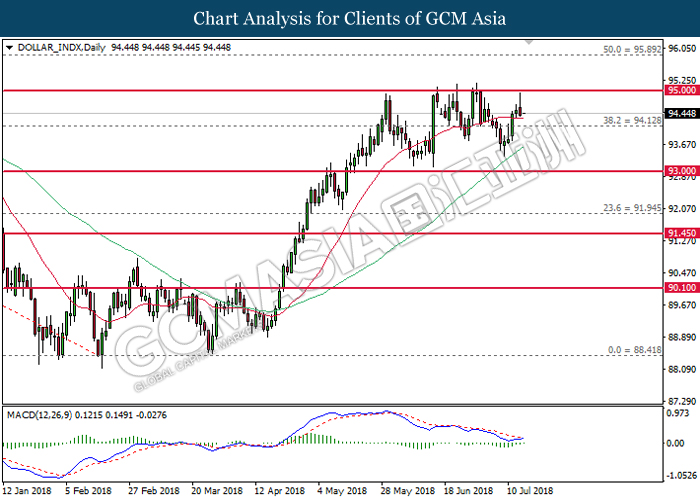
DOLLAR_INDX, Daily: Dollar index was traded higher following prior rebound from and closure above the 20-MA line (red). MACD histogram which illustrate diminishing downward momentum suggests the index to extend its gains and retest near the strong resistance of 95.00.
Resistance level: 95.00, 95.90
Support level: 94.10, 93.00
GBPUSD
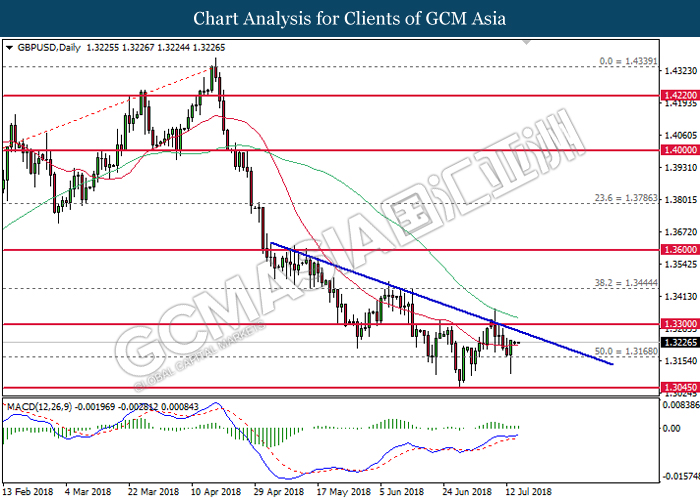
GBPUSD, Daily: GBPUSD was traded higher following prior rebound from the support level at 1.3170. MACD histogram which illustrate persistent bullish signal suggests the pair to extend its gains in short-term towards the bearish trendline.
Resistance level: 1.3300, 1.3445
Support level: 1.3170, 1.3045
USDJPY
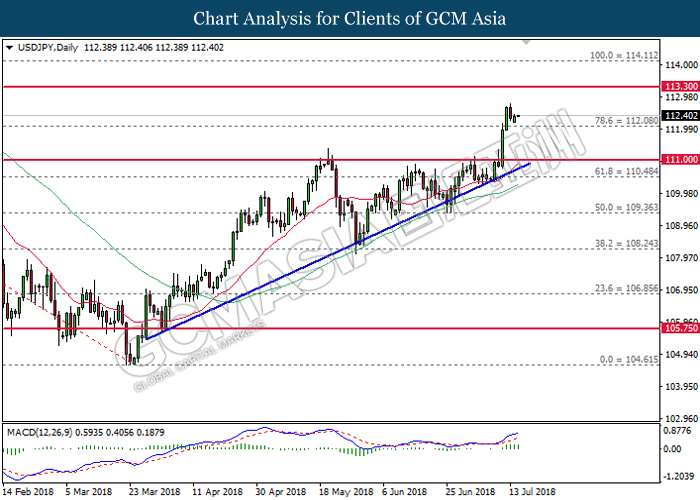
USDJPY, Daily: USDJPY rose sharply following prior breakout from the strong resistance at 111.00. MACD histogram which illustrate ongoing bullish signal suggests the pair to extend its gains, towards the direction of resistance level at 113.30.
Resistance level: 113.30, 114.10
Support level: 112.10, 111.00
EURUSD
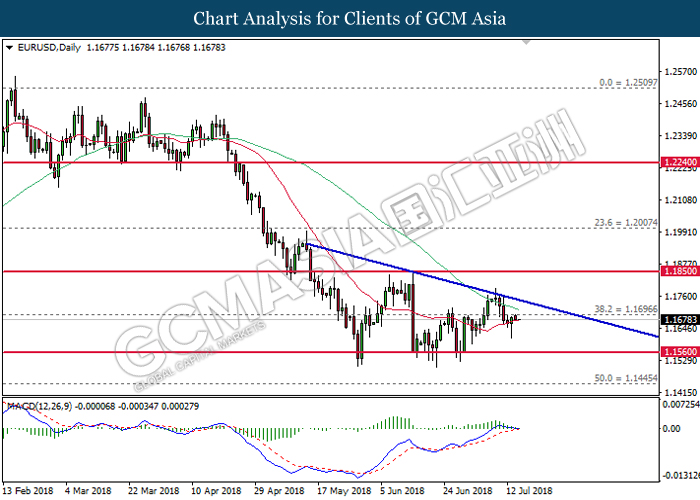
EURUSD, Daily: EURUSD remains traded within a descending triangle following prior retracement from the top level. MACD histogram which begins to form bearish crossover suggests the pair to advance further down in short-term after closing below the 20-MA line (red).
Resistance level: 1.1700, 1.1850
Support level: 1.1560, 1.1445
GOLD
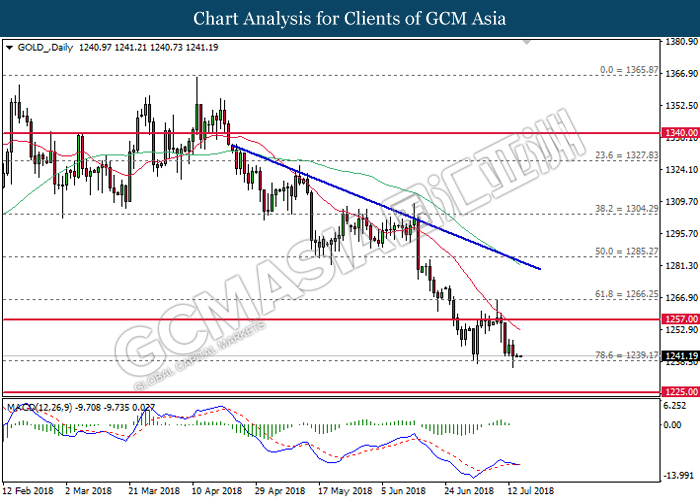
GOLD_, Daily: Gold price extended its losses in tandem with overall trend which skew towards bearish. MACD histogram which begins to form a bearish crossover suggests the commodity price to advance further down after breaking the strong support at 1239.20.
Resistance level: 1257.00, 1266.25
Support level: 1239.20, 1225.00
Crude Oil
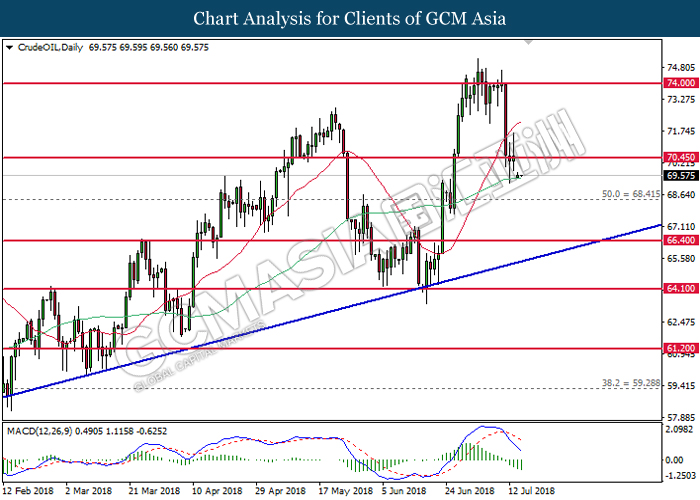
CrudeOIL, Daily: Crude oil price was traded lower following prior retracement from the resistance level of 74.00. MACD histogram which illustrate bearish signal suggests the commodity price to extend its losses. However, a close below 60-MA line (green) is required to validate such bias.
Resistance level: 70.45, 74.00
Support level: 68.40, 66.40