18 September 2017 Weekly Analysis
GCMAsia Weekly Report: September 18 – 22
Market Review (Forex): September 11 – 15
U.S. Dollar
US dollar fell against other major peers on Friday while on track for its first weekly gain since 13th August. The dollar index fell 0.30% to 91.85 during late Friday trading. For the week, it has pared prior losses by 0.55%.
Greenback came under pressure on Friday following sluggish retail sales data which unexpectedly undershot economist consensus in August. According to the Commerce Department, retail sales for the month of August dipped 0.2%, missing economist forecast for a 0.1% rise.
Further weighing on the dollar was heightened geopolitical risk in the Korean Peninsula after North Korea fired a missile over Japan territory into the Pacific Ocean. Such provocation came after United States approved a new wave of economic sanction which includes a ban on textile and restriction on oil product shipments.
US Retail Sales
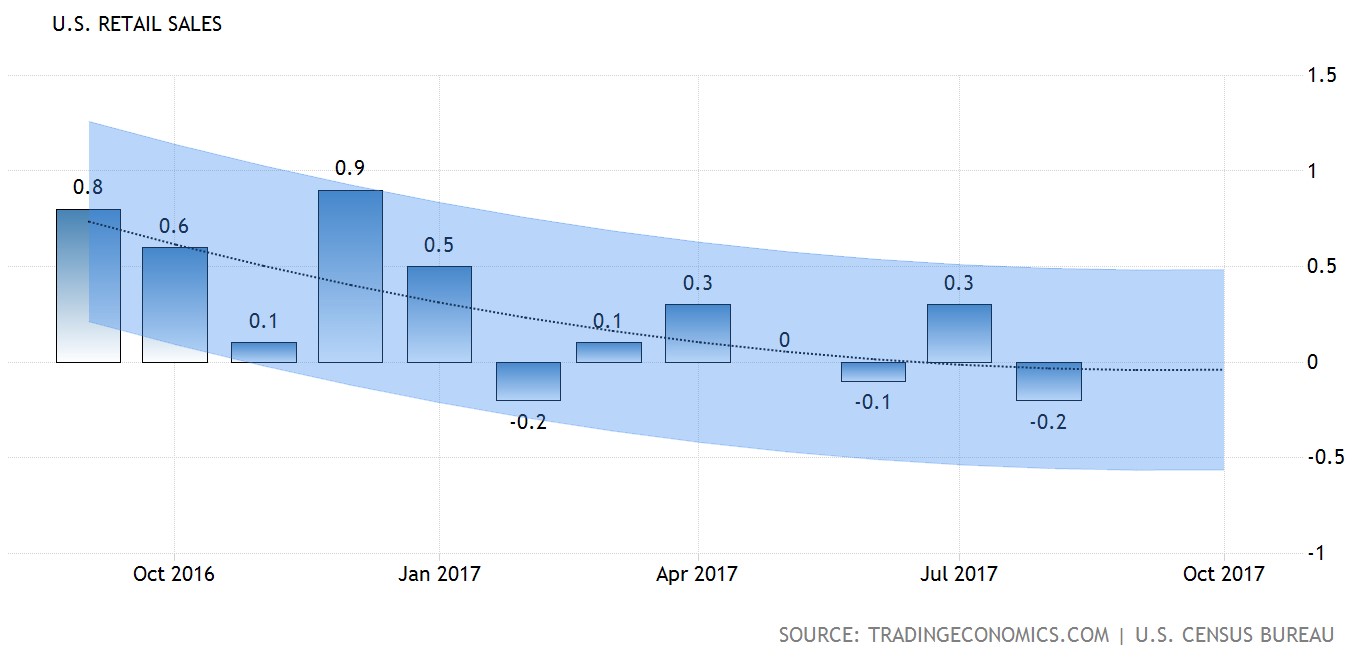
—– Forecast
US retail sales for the month of August fell by 0.2%, missed economist forecast of 0.1% rise.
USD/JPY
Pairing of USD/JPY extended gains, up 0.50% while ended near 7-weeks high of 110.82.
EUR/USD
EUR/USD rose 0.18% while ended the week at $1.1940.
GBP/USD
Pound sterling skyrocketed by 1.47% to $1.3594 against the US dollar during late Friday trading. Demand for the currency rose sharply following Bank of England’s indication on Thursday that interest rates could be raised faster than expected in the event of an accelerated pace of inflation.
Market Review (Commodities): September 11 – 15
GOLD
Gold price fell on Friday as investors shrugged off a rise in geopolitical risk following North Korea’s provocation last Thursday. Price of the yellow metal declined by 0.70% or $9.36 to $1,320.19 a troy ounce while tacking weekly loss of 1.95%.
Demand for safe-haven assets was diminished as the dollar stages its rebound due to rising prospects for an interest rate hike in December after data showed that inflation rose to its highest level in seven months on Thursday. According to the Fed Rate Monitor Tool, more than 50% of traders expected the Fed to hike their interest rate by December.
Crude Oil
Oil prices were traded flat on Friday while racking up its biggest weekly gain since July amid rising expectation that higher oil demand could accelerate the reduction in global oversupply for second half of the year. Crude oil price was held flat at $50.44 while recording a weekly gain of 1.12%.
According to a monthly report released by OPEC, production from Venezuela, Iraq, UAE and Saudi Arabia has fell by 79,000 barrels a day, offsetting rising output from Nigeria. This was followed by a report from International Energy Agency which forecasted a surge in demand for 2017 by 100,000 barrels per day, that could narrow the imbalance in oil market.
The duo of reports has overshadowed data from the US which showed a rise in crude inventories due to Hurricane Harvey which has forced several oil refinery rigs to shut off. Otherwise, US oilfield services firm Baker Hughes reported a decline in active oil rigs by 7 to a total of 749. The second consecutive weekly decline has suggested a slowdown in production which could further support the crude oil prices.
U.S. Baker Hughes Oil Rig Count
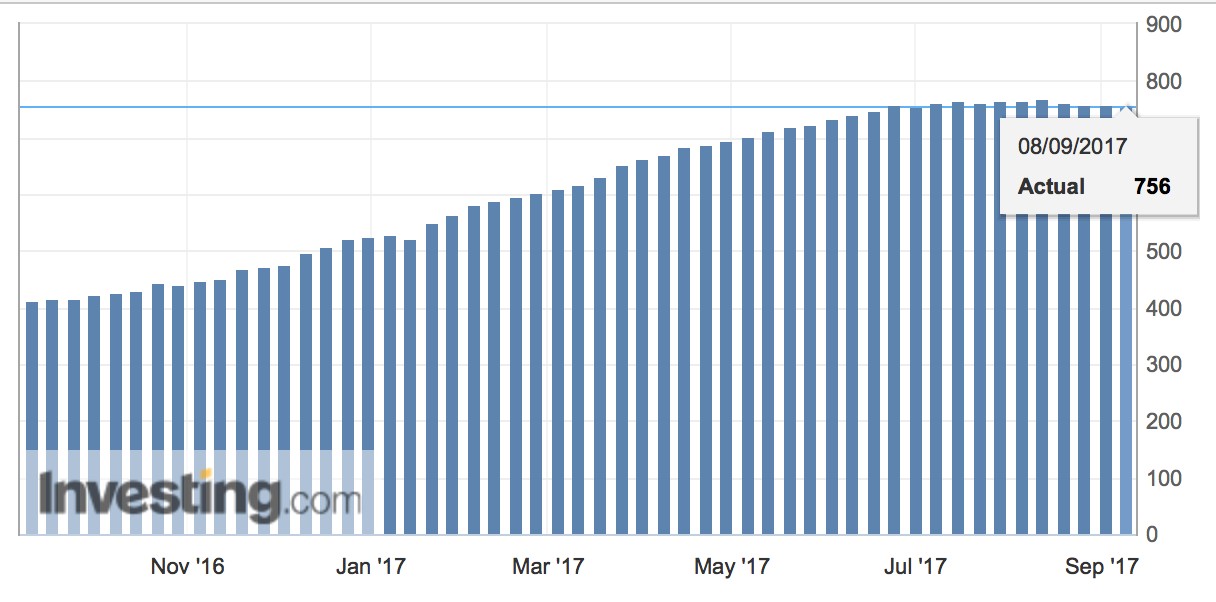
Active drilling rigs in the United States was down by 7 and the total count is currently at 749.
Weekly Outlook: September 18 – 22
For the week, investors will be eyeing on the release of retail sales data from the UK for further signal regarding the health of their economy amid looming Brexit. Likewise, British Prime Minister Theresa May is scheduled to deliver her speech on Saturday with regards to post-Brexit Britain relationship with the single economic zone – EU.
In the other region, market participants would also pay attention to speech by ECB President Mario Draghi and monthly reading of inflation in the EU to gain further signals regarding quantitative easing tapering. In the US, investors will be focusing on FOMC meeting on Thursday morning for further clues regarding next interest rate hike and balance sheet normalization plans.
As for oil traders, they will be scrutinizing on US inventories level by API and EIA to gauge the strength of crude demand for world’s largest oil consumer.
Highlighted economy data and events for the week: September 18 – 22
| Monday, September 18 |
Data EUR – CPI (YoY) (Aug)
Events GBP – BoE Gov Carney Speaks
|
| Tuesday, September 19 |
Data NZD – Westpac Consumer Sentiment (Q3) EUR – German ZEW Economic Sentiment (Sep) USD – Building Permits (Aug) USD – Housing Starts (MoM) (Aug) CAD – Manufacturing Sales (MoM) (Jul)
Events AUD – RBA Meeting Minutes
|
| Wednesday, September 20 |
Data CrudeOIL – API Weekly Crude Oil Stock JPY – Trade Balance GBP – Retail Sales (MoM) (Aug) USD – Existing Home Sales (Aug) CrudeOIL – Crude Oil Inventories USD – FOMC Interest Rate Decision
Events USD – FOMC Economic Projections USD – FOMC Statement USD – FOMC Press Conference
|
| Thursday, September 21 |
Data NZD – GDP (QoQ) (Q2) JPY – BoJ Interest Rate Decision USD – Initial Jobless Claims USD – Philadelphia Fed Manufacturing Index (Sep) CAD – Wholesale Sales (MoM) (Jul)
Events JPY – BoJ Monetary Policy Statement (YoY) JPY – BoJ Press Conference EUR – ECB President Draghi Speaks
|
|
Friday, September 22
|
Data EUR – German Manufacturing PMI (Sep) CAD – Core CPI (MoM) (Aug) CAD – Core Retail Sales (MoM) (Jul) USD – Manufacturing PMI (Sep) USD – Markit Composite PMI USD – Services PMI (Sep) CrudeOIL – US Baker Hughes Oil Rig Count
Events EUR – ECB President Draghi Speaks USD – FOMC Member Williams Speaks USD – FOMC Member George Speaks USD – FOMC Member Kaplan Speaks GBP – UK Prime Minister May Speaks
|
Technical weekly outlook: September 18 – 22
Dollar Index
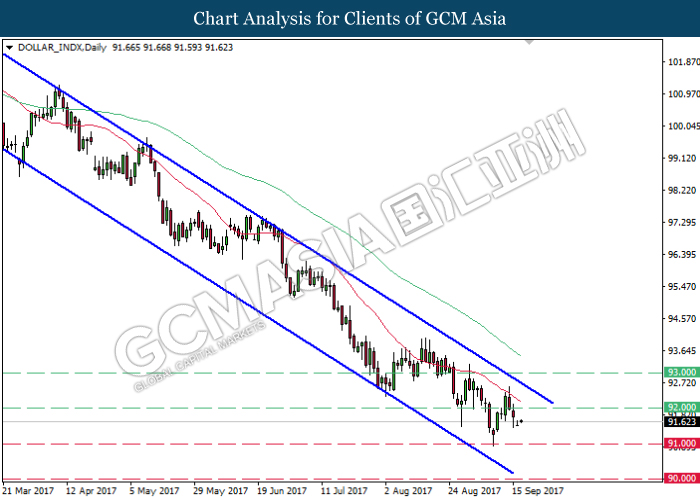
DOLLAR_INDX, Daily: The dollar index remains traded within a downward channel recently rebounded from the mid-level of the channel. Such price action suggests further upside bias for the index to retest at the resistance level of 92.00.
Resistance level: 92.00, 93.00
Support level: 91.00, 90.00
GBPUSD
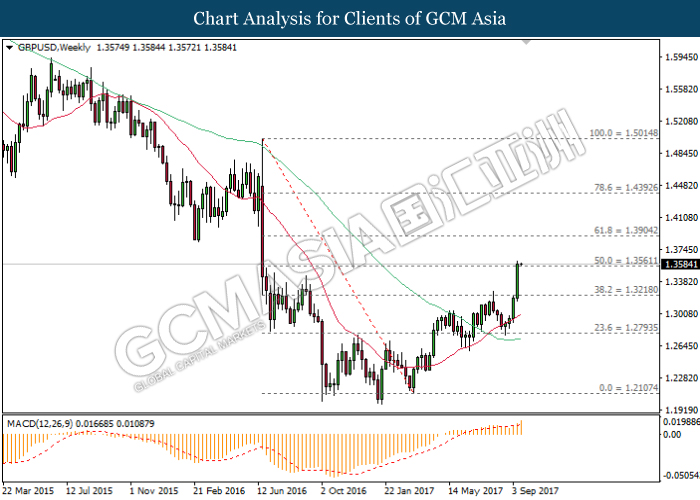
GBPUSD, Weekly: GBPUSD skyrocketed while recently closed above the 50.0 Fibonacci level of 1.3560. MACD indicator which illustrate substantial upward momentum suggests the pair to extend its gains, towards the next target at 1.3900.
Resistance level: 1.3900, 1.4395
Support level: 1.3560, 1.3220
USDJPY
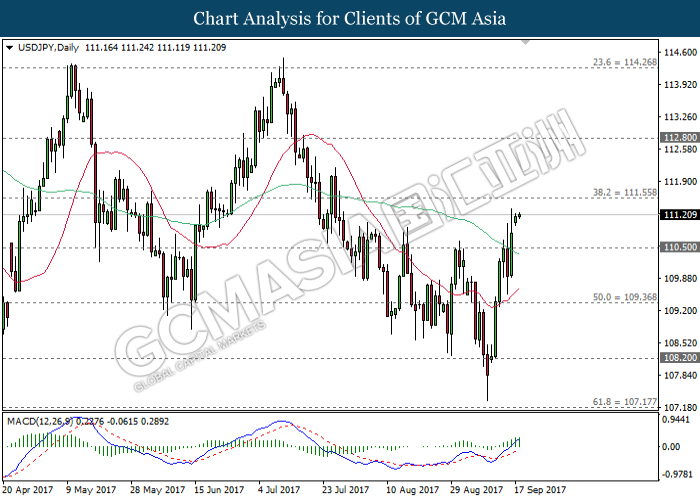
USDJPY, Daily: USDJPY extended its gains following prior closure above the resistance level of 110.50. MACD histogram which illustrate substantial upward signal suggests the pair to extend its upward momentum and retest at the resistance level of 111.55.
Resistance level: 111.55, 112.80
Support level: 110.50, 109.35
EURUSD
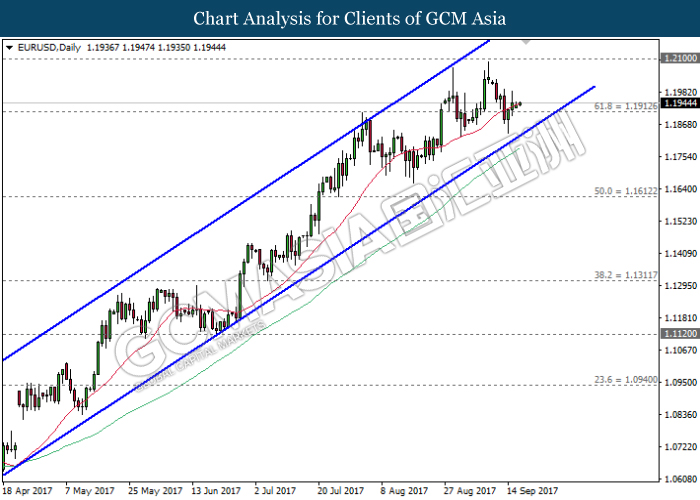
EURUSD, Daily: EURUSD was traded within an upward channel following prior rebound from the bottom level. A successful closure above the 20-MA line (red) would suggest further upside bias, to advance towards the next target at 1.2100.
Resistance level: 1.2100, 1.2340
Support level: 1.1910, 1.1610
GOLD
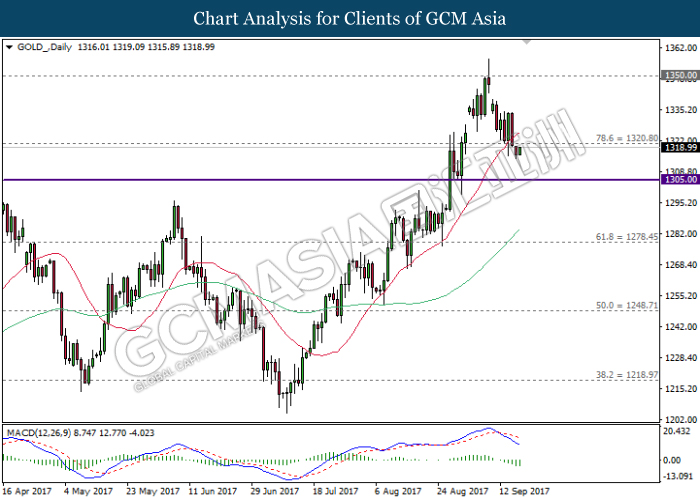
GOLD_, Daily: Gold price was traded lower following prior closure below the 20-MA line (red). MACD histogram indicator which illustrate substantial downward momentum suggests gold price to extend its losses, towards the next target at 1305.00.
Resistance level: 1320.80, 1350.00
Support level: 1305.00, 1278.45
Crude Oil
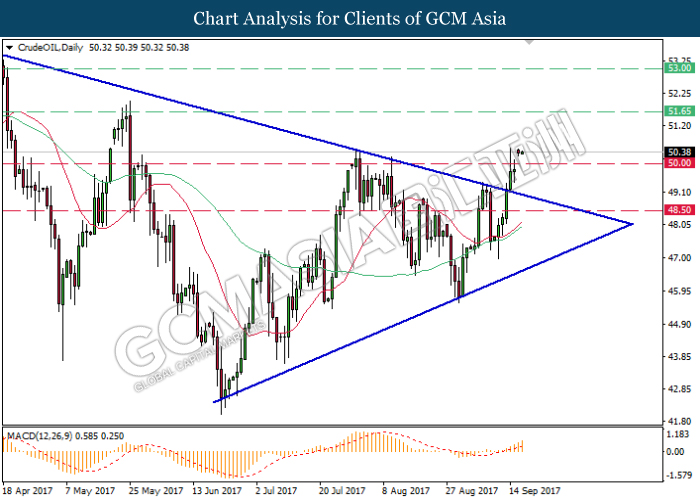
CrudeOIL, Daily: Crude oil price extended gains following prior successful breakout from the top level of narrowing triangle, signaling a change in trend direction to move further upwards. MACD indicator which illustrate substantial upward momentum suggests the price to extend its gains, towards the next target at the resistance level of 51.65.
Resistance level: 51.65, 53.00
Support level: 50.00, 48.50