25 June 2018 Weekly Analysis
GCMAsia Weekly Report: June 25 – 29
Market Review (Forex): June 18 – 22
US dollar extended its losses last Friday following mixed economic data and a rebound in the single common currency – Euro. The dollar index slumped 0.24% while ended the week at 94.52 against a basket of six major currencies.
On Friday, mixed US economic data did little to encourage dollar-bulls to support the currency after preliminary reading of services PMI exceed economist expectation while manufacturing data fell short. For the month of June, Services PMI ticked up to 56.5, beating economist forecast for a fall to 56.4. However, manufacturing PMI came in with 54.6, lesser than economist expectation to attain 56.3.
In addition, the currency received further bearish pressure following ongoing trade tension between the United States and China. Prior, US President Donald Trump signaled to impose an additional 10% tariff upon $200 billion import from China, sparking higher concern for a full blown “trade-war” to occur between the two economic giants.
USD/JPY
Pair of USD/JPY ticked down 0.02% to 109.97 during late Friday trading.
EUR/USD
Euro extended gains by 0.44% to $1.1654 against the US dollar. The single common currency received bullish support over the backdrop of optimistic services data from France and Eurozone, easing investors’ concern over imminent economic slowdown in the region.
GBP/USD
Pair of GBP/USD tacks up 0.17% while ended the week at $1.3264.
Market Review (Commodities): June 18 – 22
GOLD
Gold price rebounds from its session low over the backdrop of sluggish greenback while gains remain limited due to lower demand for the safe-haven asset. Price of the yellow metal rose 0.18% or $2.31 to $1,269.49 a troy ounce.
Although greenback experienced some setbacks, gold price failed to yield substantial recovery as investors places higher prospect for a faster pace of rate hike from the US Federal Reserve. Generally, higher interest rate environment would reduce the appeal of safe-haven asset as alternative investment due to its non-yielding nature.
Crude Oil
Crude oil price rose sharply during last Friday as traders cheer over modest output hike decision from the Organization of Petroleum Exporting Countries (OPEC). Price of the black commodity skyrocketed more than 5% or $3.40 while closing the week at $69.35 per barrel, not far from the psychological level of $70.00.
In OPEC’s 174th official meeting, Saudi Arabia and Iran reached their consensus to increase its output at around 1 million barrels per day (bpd) or 1% of global supply despite Tehran’s initial opposition. OPEC explain in a joint press release that its members had exceeded the required level of conformity to limit their production since 2017 with compliance of up to 152%. Thus, they agreed to drop the compliance to a lower level at around 100%.
The cartel noted that there is no specific allocation for each of its individual members as some countries does not have the capacity to ramp up their output. Although OPEC pledged to increase up to 1 million barrels, the realistic numbers will fall between 700,000 to 770,000 according to two officials from OPEC.
Weekly Outlook: June 25 – 29
For the week ahead, market participants will continue to ponder upon major economic releases from the United States to monitor their pace and condition of economic progression which may warrant for more rate hike from the Federal Reserve in the long run.
As for oil traders, they will be eyeing on US inventories level reported by API and EIA to gauge the strength of crude demand for world’s largest oil consumer.
Highlighted economy data and events for the week: June 25 – 29
| Monday, June 25 |
Data EUR – German Ifo Business Climate Index USD – New Home Sales (May)
Events N/A
|
| Tuesday, June 26 |
Data USD – CB Consumer Confidence (Jun)
Events N/A
|
| Wednesday, June 27 |
Data CrudeOIL – API Weekly Crude Oil Stock USD – Core Durable Goods Orders (MoM) (May) USD – Pending Home Sales (MoM) (May) CrudeOIL – Crude Oil Inventories CrudeOIL – Gasoline Inventories
Events USD – FOMC Member Bostic Speaks USD – FOMC Member Kaplan Speaks GBP – BoE Gov Carney Speaks
|
| Thursday, June 28 |
Data NZD – RBNZ Interest Rate Decision EUR – German Retail Sales (MoM) (May) EUR – GfK German Consumer Climate (Jul) USD – GDP (QoQ) (Q1) USD – GDP Price Index (QoQ) (Q1) USD – Initial Jobless Claims USD – Real Consumer Spending (Q1)
Events USD – FOMC Member Rosengren Speaks NZD – RBNZ Rate Statement EUR – EU Leaders Summit USD – FOMC Member Bullard Speaks
|
|
Friday, June 29
|
Data JPY – Tokyo Core CPI (YoY) (Jun) JPY – Industrial Production (MoM) (May) EUR – German Unemployment Change (Jun) EUR – German Unemployment Rate (Jun) GBP – GDP (QoQ) (Q1) EUR – CPI (YoY) (Jun) USD – Core PCE Price Index (YoY) (May) USD – Personal Income (MoM) (May) USD – Personal Spending (MoM) (May) CAD – GDP (MoM) (Apr) USD – Michigan Consumer Sentiment (Jun) CrudeOIL – US Baker Hughes Oil Rig Count
Events EUR – EU Leaders Summit
|
Technical Weekly Outlook: June 25 – 29
Dollar Index
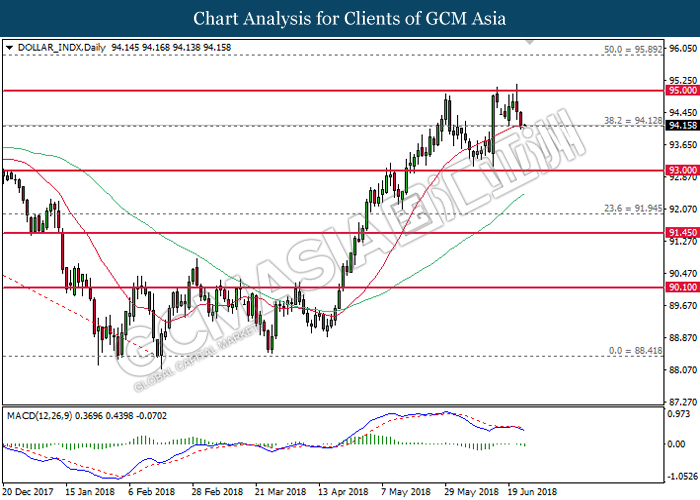
DOLLAR_INDX, Daily: Dollar index was traded lower following prior retracement from 95.00 while forming a double top. MACD histogram which illustrate bearish signal may suggest the index to extend its losses after closing below the 20-MA line (red) near 94.10.
Resistance level: 95.00, 95.90
Support level: 94.10, 93.00
GBPUSD
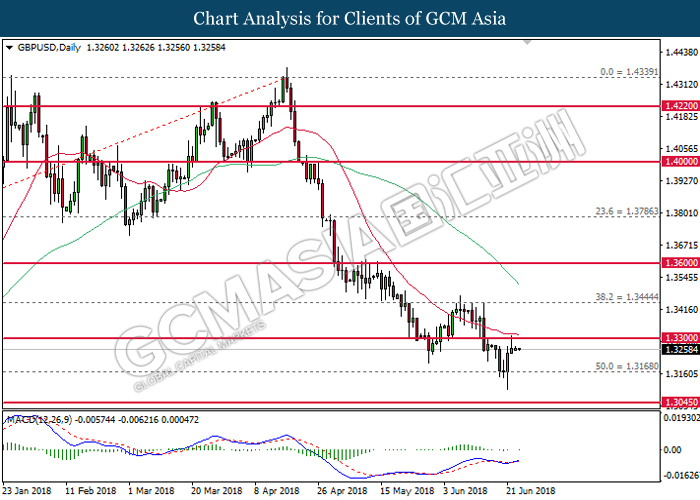
GBPUSD, Daily: GBPUSD was traded higher following prior rebound from the support level of 1.3170. MACD histogram which illustrate upside bias suggests the pair to be traded higher in short-term as technical correction before extending its bearish major trend thereafter.
Resistance level: 1.3300, 1.3445
Support level: 1.3170, 1.3045
USDJPY
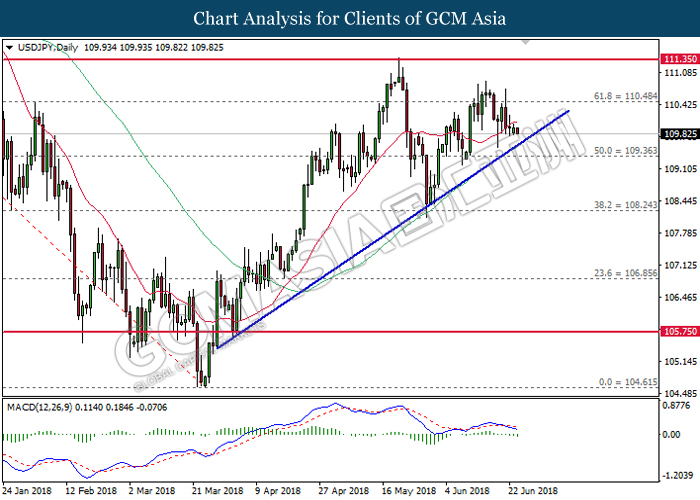
USDJPY, Daily: USDJPY was traded lower following prior retracement from the resistance level of 110.50. MACD histogram which illustrate bearish signal suggests the pair to extend its losses, towards the direction of upward trendline.
Resistance level: 110.50, 111.35
Support level: 109.35, 108.25
EURUSD
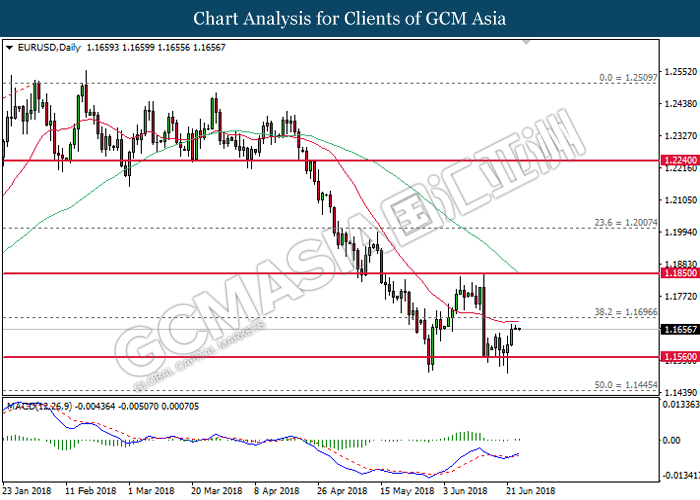
EURUSD, Daily: EURUSD was traded higher following prior rebound from the strong support of 1.1560. MACD histogram which begins to form bullish signal suggests the pair to extend its gains in the event of a closure above the target of 1.1700.
Resistance level: 1.1700, 1.1850
Support level: 1.1560, 1.1445
GOLD
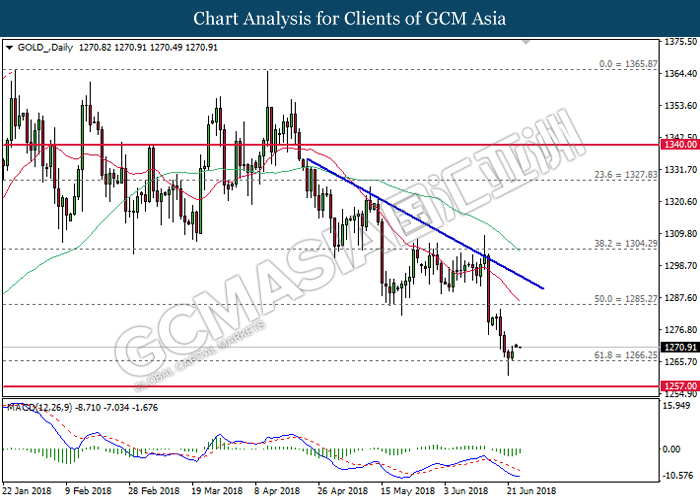
GOLD_, Daily: Gold price was traded higher following prior rebound from the support level of 1266.25. MACD histogram which illustrate diminishing downward momentum may suggest the pair to be traded higher in short-term as technical correction.
Resistance level: 1285.30, 1304.30
Support level: 1266.25, 1257.00
Crude Oil
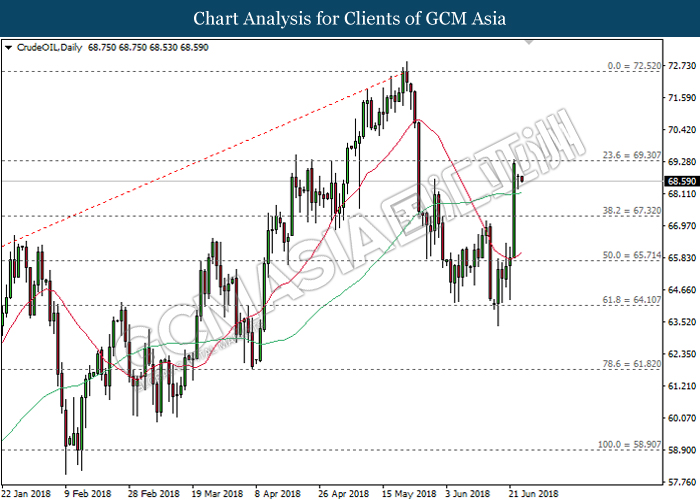
CrudeOIL, Daily: Crude oil price rose sharply following prior rebound from the strong support of 64.10. However, recent retracement from 69.30 may suggest the commodity price to be traded lower in short-term as technical correction before extending its bullish bias.
Resistance level: 69.30, 72.50
Support level: 67.30, 65.70