25 September 2017 Weekly Analysis
GCMAsia Weekly Report: September 25 – 29
Market Review (Forex): September 18 – 22
U.S. Dollar
US dollar slipped against other major currencies on Friday following fresh tension between the United States and North Korea. The dollar index lost 0.12% while last quoted around 92.14.
Investors flock to safe haven instruments such as Japanese Yen and Swiss Franc after North Korea stated that they could test a hydrogen bomb at the Pacific Ocean. Such provocation came after US President Donald Trump threatened to “totally destroy” the country in front of the United Nations if North Korea continues to pursue their nuclear weapon ambition.
Prior to this, the dollar hit its highest level since mid-July against the Yen on Thursday after the Bank of Japan kept their interest rate unchanged. Likewise, overall losses posted on the greenback were suppressed after US Federal Reserve signaled to raise their interest rate for the third time by year-end.
USD/JPY
Pair of USD/JPY sheds 0.43% to 111.98 during late Friday trading.
EUR/USD
Euro edged further up against the greenback, posting gains of 0.13% to $1.1957.
GBP/USD
GBP/USD tumbled 0.53% to $1.3510 during late Friday trading session. The pound sterling received higher selling pressure after credit rating agency Moody downgraded United Kingdom’s credit rating to Aa2 from Aa1.
Market Review (Commodities): September 18 – 22
GOLD
Gold prices pushed higher on Friday, shedding its prior losses as risk aversion escalates due to heightened geopolitical risk at the Korean Peninsula. Price of the yellow metal rose 0.51% and settled the week at $1,301.45.
Market demand for the safe haven assets were invigorated after North Korea sparks possibilities to detonate a hydrogen bomb over the Pacific Ocean, in a retaliation towards US President Donald Trump’s speech in front of the United Nations. Investors would flock to safe-havens in the event of higher risk in the market in order to secure their capital value.
Crude Oil
Crude oil price edged higher on Friday, hovering near its highest close in several months due to optimistic outlook for a rebalancing in the global market. Its prices were up 11 cents or 0.2% to $50.66 a barrel. For the week, its prices have gained around 1.5%, cashing in profit for third consecutive week thus far.
Such optimism was sparked after a major meeting between members and non-members of OPEC on Friday boasted record compliance level with their production-cut agreement. The cartel and other major producers has successfully curb their output with a compliance rate of 116% for the month of August, a strong increase from previous month with only 94%.
In the United States, market participants cheered over industrial data which shows a decline pattern in active drilling rigs, suggesting a possible tightening in domestic production. Oilfield services provider Baker Hughes reported that its weekly count of oil rigs was down by 5 to a total of 744, marking its third weekly decline in a row.
However, gains on the crude oil price were remained limited due to ongoing increase in the US crude inventories. According to the Energy Information Administration, crude oil stock increased for its third consecutive week by 4.591 million barrels last week, reflecting prior shutdown of oil refineries due to onset Hurricane Harvey.
U.S. Baker Hughes Oil Rig Count
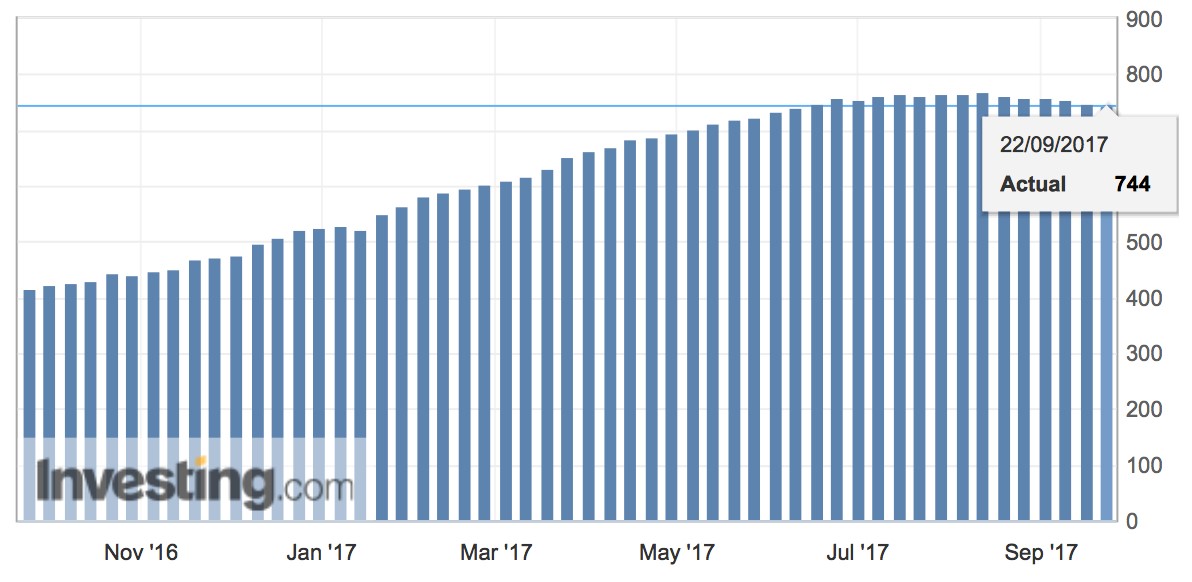
Active drilling rigs in the United States was down by 5 and the total count is currently at 744.
US Crude Oil Stocks Change
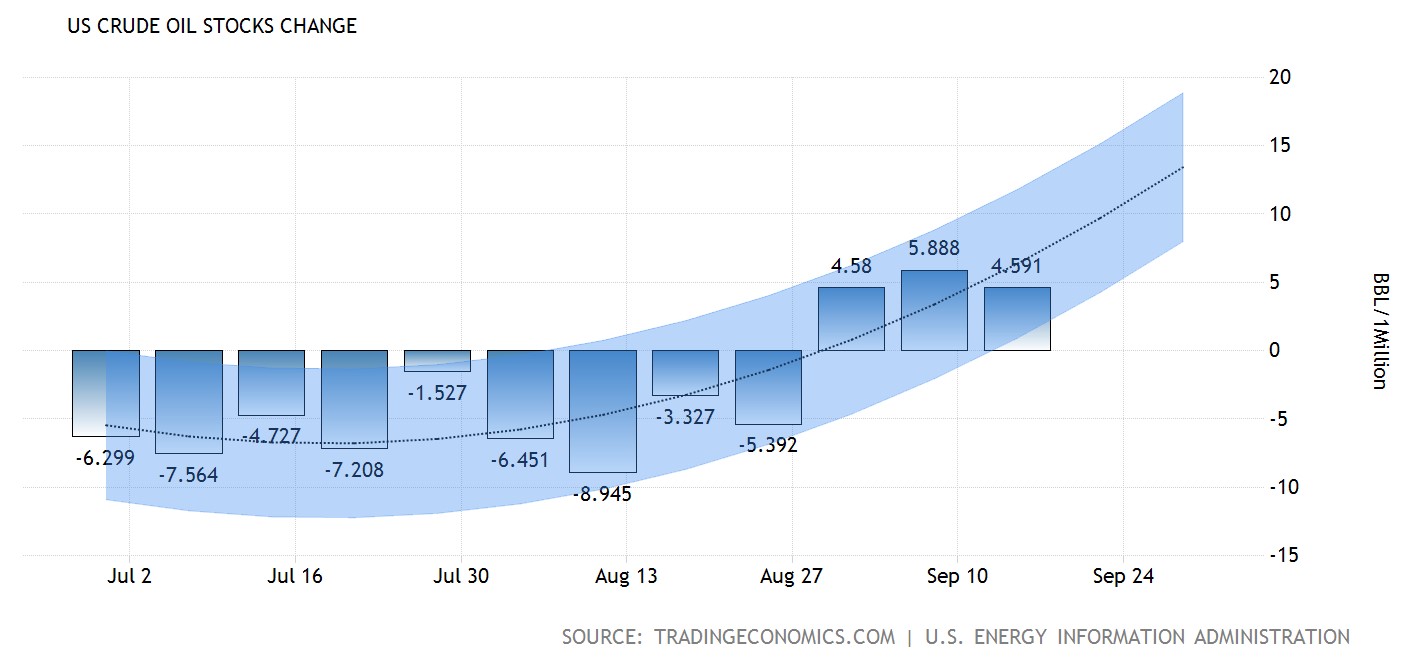
—– Forecast
US crude oil stock rose for its third consecutive week by 4.591 million barrels last week.
Weekly Outlook: September 25 – 29
For the week ahead, market participants will turn their attention to Fed Chair Janet Yellen whom will be giving her speech on Tuesday for further clues regarding the next rate hike. Likewise, a pair of speech by ECB President Mario Draghi will be scrutinized for further signals regarding their monetary policy tapering initiatives.
As for oil traders, they will be eyeing on US inventories level reported by API and EIA to gauge the strength of crude demand for world’s largest oil consumer.
Highlighted economy data and events for the week: September 25 – 29
| Monday, September 25 |
Data EUR – German Ifo Business Climate Index (Sep)
Events JPY – BoJ Governor Kuroda Speaks USD – FOMC Member Dudley Speaks EUR – ECB President Draghi Speaks
|
| Tuesday, September 26 |
Data NZD – ANZ Business Confidence (Sep) USD – CB Consumer Confidence (Sep) USD – New Home Sales (Aug)
Events USD – FOMC Member Kashkari Speaks USD – FOMC Member Mester Speaks USD – FOMC Member Brainard Speaks USD – Fed Chair Yellen Speaks
|
| Wednesday, September 27 |
Data CrudeOIL – API Weekly Crude Oil Stock USD – Core Durable Goods Orders (MoM) (Aug) USD – Pending Home Sales (MoM) (Aug) CrudeOIL – Crude Oil Inventories
Events CAD – BoC Gov Poloz Speaks USD – FOMC Member Bullard Speaks USD – FOMC Member Brainard Speaks
|
| Thursday, September 28 |
Data NZD – RBNZ Interest Rate Decision EUR – German CPI (YoY) (Sep) USD – GDP (QoQ) (Q2) USD – Initial Jobless Claims
Events NZD – RBNZ Rate Statement USD – FOMC Member Rosengren Speaks JPY – BoJ Governor Kuroda Speaks GBP – BoE Gov Carney Speaks USD – FOMC Member George Speaks USD – FOMC Member Stanley Fischer Speaks
|
|
Friday, September 29
|
Data CNY – Caixin Manufacturing PMI (Sep) EUR – German Unemployment Change (Sep) GBP – GDP (QoQ) (Q2) EUR – CPI (YoY) (Sep) USD – Core PCE Price Index (MoM) (Aug) USD – Personal Spending (MoM) (Aug) CAD – GDP (MoM) (Jul) USD – Chicago PMI (Sep) CrudeOIL – US Baker Hughes Oil Rig Count
Events EUR – ECB President Draghi Speaks GBP – BoE Gov Carney Speaks USD – FOMC Member Harker Speaks
|
Technical weekly outlook: September 25 – 29
Dollar Index
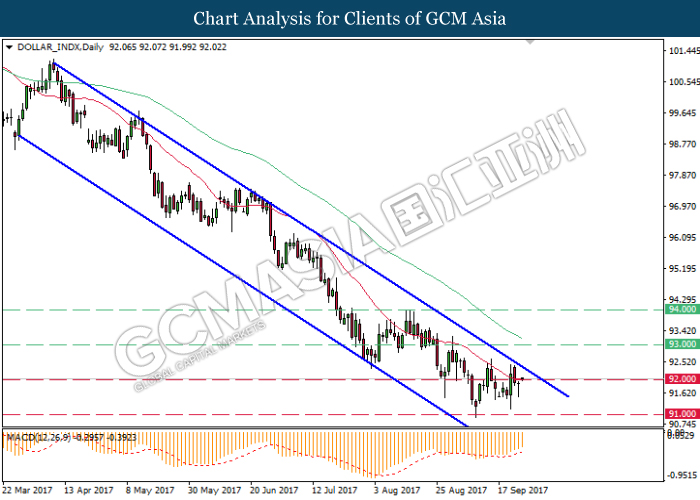
DOLLAR_INDX, Daily: The dollar index mends some losses following prior rebound while currently testing at the support level of 92.00. MACD indicator which illustrate diminishing downward momentum suggests the dollar index to extend further up and retest near the top level of downward channel.
Resistance level: 93.00, 94.00
Support level: 92.00, 91.00
GBPUSD
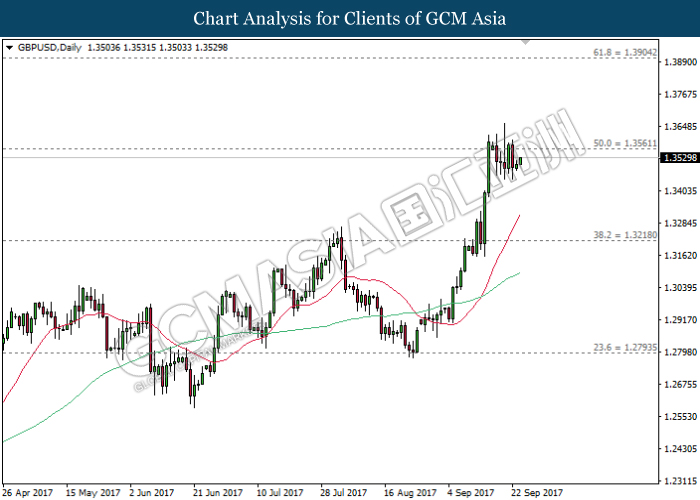
GBPUSD, Daily: GBPUSD was traded higher following prior rebound while currently testing near the resistance level of 1.3560. Both MA lines which continues to expand further up after the formation of golden cross suggest the pair to extend its gains after closing above the target of 1.3560.
Resistance level: 1.3560, 1.3905
Support level: 1.3220, 1.2795
USDJPY
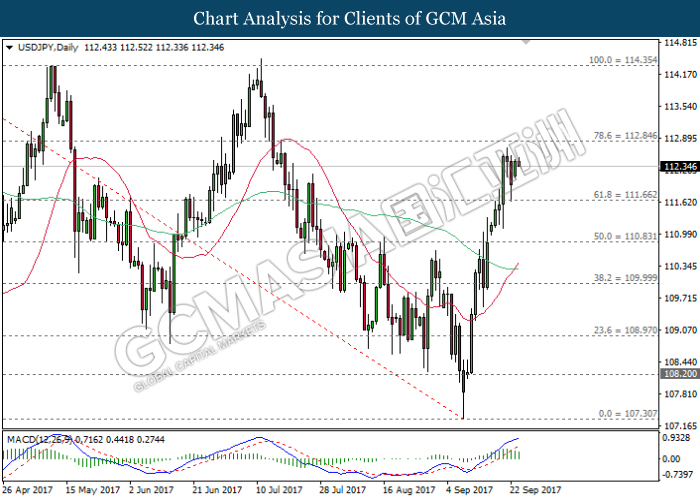
USDJPY, Daily: USDJPY pared its prior losses following a rebound from the support level of 111.65. MACD histogram which illustrate diminishing upward signal may suggest USDJPY to be traded lower in short-term as technical correction. Otherwise, a close above the target of 112.85 would further validate its current upward momentum thereafter.
Resistance level: 112.85, 114.35
Support level: 111.65, 110.85
EURUSD
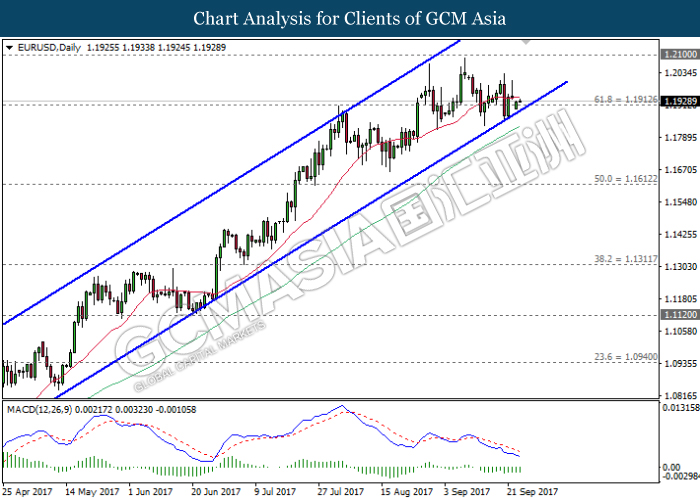
EURUSD, Daily: EURUSD remains traded within an upward channel while currently testing at the bottom level. MACD histogram which shows substantial downward momentum suggests possibility to occur a breakout and signal a change in trend direction to move further downwards thereafter.
Resistance level: 1.2100, 1.2340
Support level: 1.1910, 1.1610
GOLD
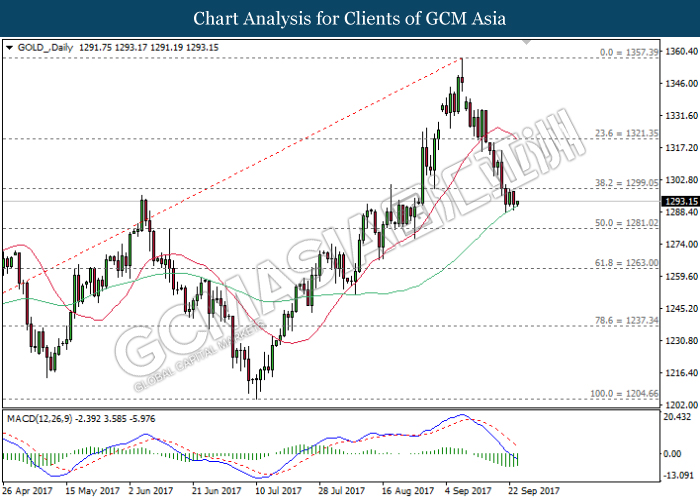
GOLD_, Daily: Gold price was traded lower following prior retracement from the resistance level of 1299.05. Both signal line from MACD histogram which continues to expand downwards suggests gold price to extend its downward momentum after closing below the 60-MA line (green).
Resistance level: 1299.05, 1321.35
Support level: 1281.00, 1263.00
CrudeOil
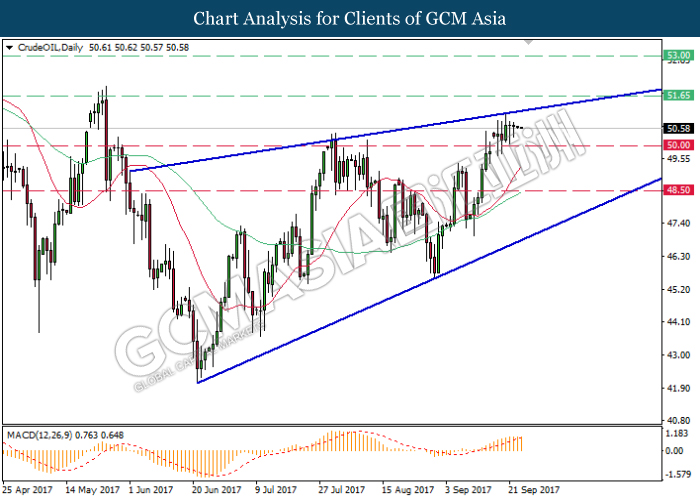
CrudeOIL, Daily: Crude oil price was traded within an upward wedge following prior retracement from the top level. MACD indicator which illustrate diminishing upward momentum suggests its prices to be traded lower in short-term, towards the support level of 50.00.
Resistance level: 51.65, 53.00
Support level: 50.00, 48.50