28 August 2017 Weekly Analysis
GCMAsia Weekly Report: August 28 – September 1
Market Review (Forex): August 21 – 25
U.S. Dollar
Greenback fell against a basket of other major peers on Friday while investors digested the speeches given by global central bankers at Jackson Hole symposium. The dollar index plunged 0.82% while hanging at 93.47 during late Friday trading. Thus far, the dollar has fallen around 10% within this year amid ongoing uncertainty that surrounds US economic agenda by President Donald Trump and doubts over the next interest rate hike by Federal Reserve.
In essence, Yellen in a speech titled “Financial Stability a Decade after the Onset of the Crisis” focused on the fact that any changes made on the financial regulation should be modest while stating that “substantial” progress was made under Fed’s mandate. The 15-page document did not touch on the future stance of monetary policy nor balance sheet normalization which has caused the downfall of greenback.
USD/JPY
Pair of USD/JPY slides down 0.17% while touching 109.36.
EUR/USD
Euro hits its highest level in two years at $1.1941 against the US dollar after skyrocketing more than 1.06% on Friday. The single common currency received a bullish push after speech by European Central Bank President Mario Draghi avoids to give any new indication on their plans to taper its economic stimulus program but acknowledging considerable recovery with the Eurozone.
GBP/USD
Sterling stacked up 0.61% to $1.2878 against the US dollar on late Friday trading.
Market Review (Commodities): August 21 – 25
GOLD
Gold price ended higher on Friday in a volatile trading session as the US dollar weakened substantially after Fed Chair Janet Yellen did not specifically address their future monetary policy stance or outlook.
Its prices settled up 0.3% while closing the week at $1,295.95 after touching a low of $1,281.30 earlier. The demand for gold increased modestly after Yellen failed to discuss the outlook of monetary policy, which in return disappoints some investors whom has been hoping for more hawkish signal.
Crude Oil
Crude oil price ended the week with gains on Friday as Hurricane Harvey threatened to disrupt production and refinery activity along the Gulf Coast. It prices added up 44 cents or 0.9% during late Friday trading while closing the week at $47.87 per barrel.
Approximately 25% of US Gulf of Mexico oil production rigs were closed due to the onset Hurricane Harvey as reported by the US department of Interior’s Bureau of Safety and Environmental Enforcement. Such closure reflects approximately 428,568 barrels of oil per day out of roughly 1.75 million bpd being produced along the Gulf Coast.
In addition, price of the black commodities received further bullish attention after oilfield services firm Baker Hughes showed a reduction in oil rigs for the second consecutive week in a row. According to its weekly rig count, the number of oil rig were reduced by 4, down to a total of 759.
However, the rise in oil prices remained limited as investors continued to ponder over the rising US shale output which has canceled out production cuts done by OPEC and non-OPEC members.
U.S. Baker Hughes Oil Rig Count
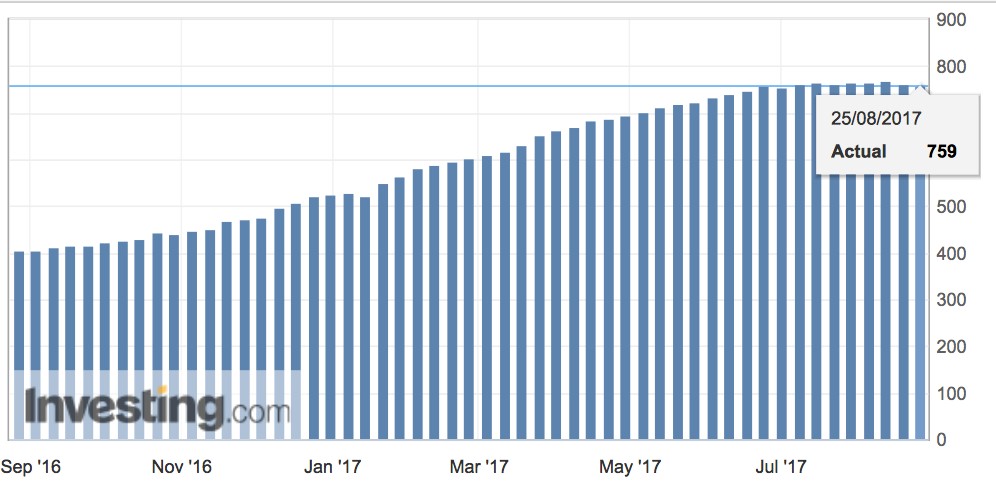
Active drilling rigs in the United States was down by 4 and the total count is currently at 759.
Weekly Outlook: August 28 – September 1
For the week ahead, investors will be focusing on the highly anticipated US jobs report for the month of August to gauge its impact on the path of Federal Reserve monetary policy. Likewise, investors will also be focusing on the revised reading of US second quarter growth and euro zone’s preliminary inflation data to further gauge the prospect of respective currencies.
As for oil traders, they will be keeping a close eye on fresh weekly information regarding US stockpiles of crude and refined products on Tuesday and Wednesday to gauge the strength of demand from the world’s largest oil consumer. Meanwhile, comments from major oil producers will be fully scrutinized for further indication on their compliance to production cut deal.
Highlighted economy data and events for the week: August 28 – September 1
| Monday, August 28 |
Data N/A
Events N/A
|
| Tuesday, August 29 |
Data JPY – Household Spending (MoM) (Jul) CAD – RMPI (MoM) (Jul) USD – CB Consumer Confidence (Aug)
Events N/A
|
| Wednesday, August 30 |
Data CrudeOIL – API Weekly Crude Oil Stock AUD – Building Approvals (MoM) (Jul) AUD – Construction Work Done (QoQ) (Q2) GBP – Net Lending to Individuals EUR – German CPI (MoM) (Aug) USD – ADP Nonfarm Employment Change (Aug) USD – GDP (QoQ) (Q2) CrudeOIL – Crude Oil Inventories
Events USD – FOMC Member Powell Speaks
|
| Thursday, August 31 |
Data CNY – Manufacturing PMI (Aug) CNY – Non-Manufacturing PMI (Aug) NZD – ANZ Business Confidence (Aug) AUD – Private New Capital Expenditure (QoQ) (Q2) EUR – German Retail Sales (MoM) (Jul) EUR – German Unemployment Change (Aug) EUR – CPI (YoY) (Aug) USD – Core PCE Price Index (MoM) (Jul) USD – Initial Jobless Claims USD – Personal Spending (MoM) (Jul) CAD – GDP (MoM) (Jun) USD – Chicago PMI (Aug) USD – Pending Home Sales (MoM) (Jul)
Events N/A
|
|
Friday, September 1
|
Data CNY – Caixin Manufacturing PMI EUR – German Manufacturing PMI GBP – Manufacturing PMI USD – Average Hourly Earnings (MoM) (Aug) USD – Nonfarm Payrolls (Aug) USD – Unemployment Rate (Aug) USD – ISM Manufacturing PMI (Aug) USD – Michigan Consumer Sentiment (Aug) CrudeOIL – Baker Hughes Oil Rig Count
Events N/A
|
Technical weekly outlook: August 28 – September 1
Dollar Index
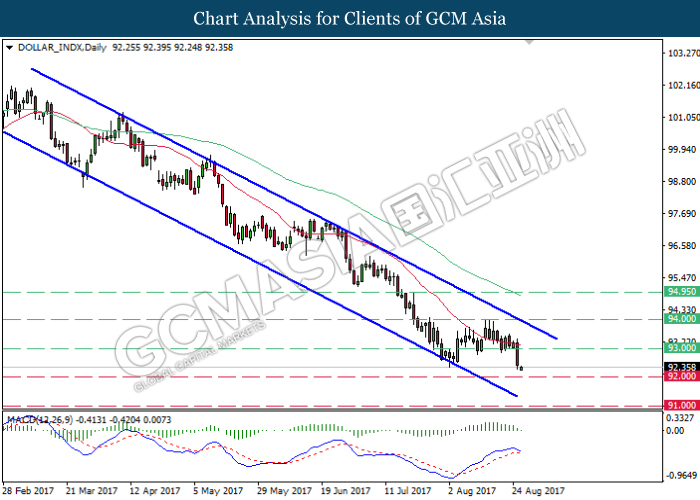
DOLLAR_INDX, Daily: The dollar index remained traded within a downward channel while recently closed below the support level of 93.00. MACD histogram which illustrate diminishing upward signal suggests further downside bias towards the next target at 92.00.
Resistance level: 94.00, 94.95
Support level: 93.00, 92.00
GBPUSD
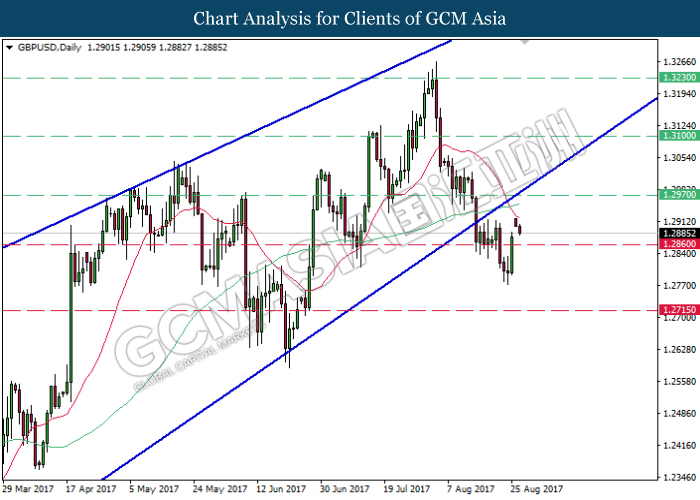
GBPUSD, Daily: GBPUSD was traded lower following a retracement from the 20-MA line (red). Both moving average line which continues to expand downwards after the formation of death cross suggests GBPUSD to advance further down, towards the support level of 1.2860.
Resistance level: 1.2970, 1.3100, 1.3230
Support level: 1.2860, 1.2715
USDJPY
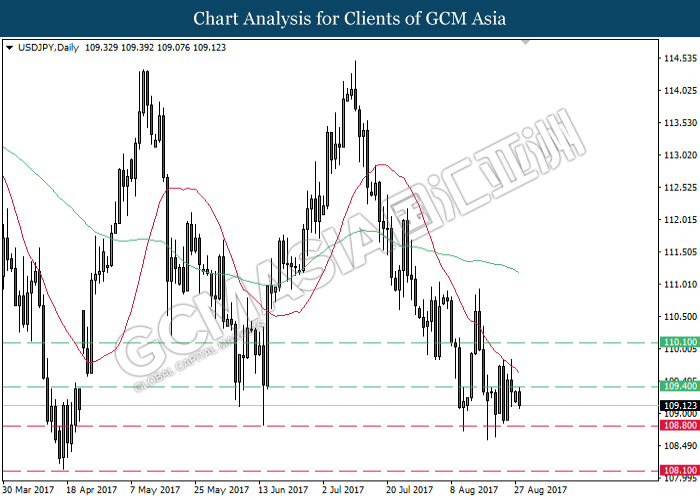
USDJPY, Daily: USDJPY remains under pressure after both MA lines continues to expand downwards after the formation of death cross. A retracement from the resistance level of 109.40 would suggest USDJPY to extend its losses towards the strong support level near 108.80.
Resistance level: 109.40, 110.10
Support level: 108.80, 108.10
EURUSD
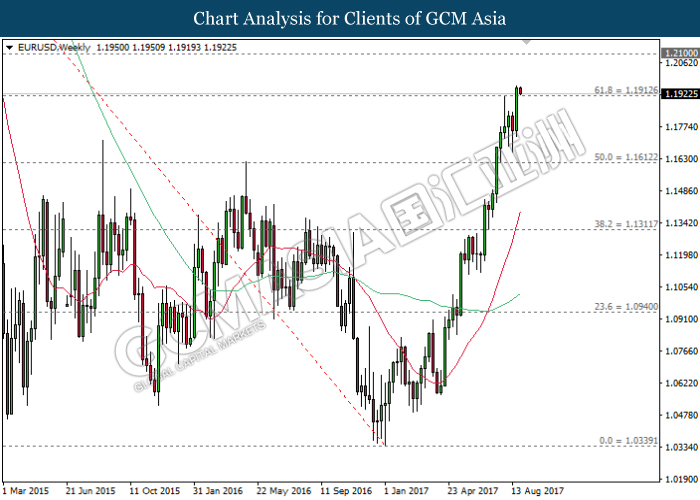
EURUSD, Weekly: EURUSD received further bullish momentum after closing above the resistance level of 1.1910. Both moving average line which continues to expand upwards after the formation of golden cross suggest further upside bias towards the next target at 1.2100.
Resistance level: 1.2100, 1.2340
Support level: 1.1910, 1.1610
GOLD
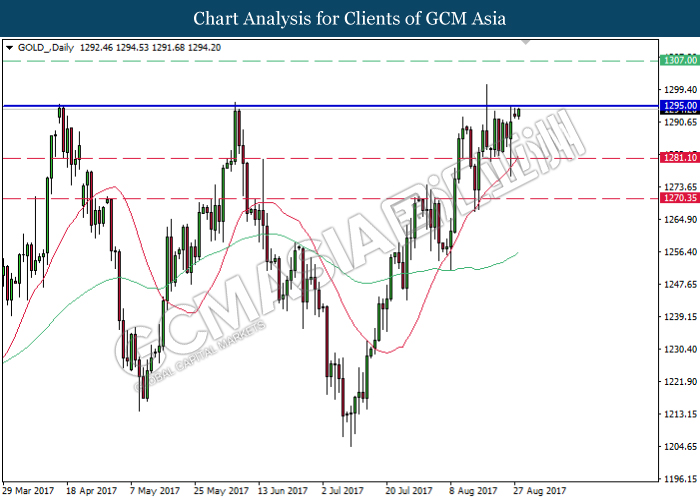
GOLD_, Daily: Gold price was traded higher following a successful rebound near the strong support level of 1281.10. A successful closure above the resistance level of 1295.00 would suggest further upside bias towards the next target at 1307.00.
Resistance level: 1295.00, 1307.00
Support level: 1281.10, 1270.35
Crude Oil
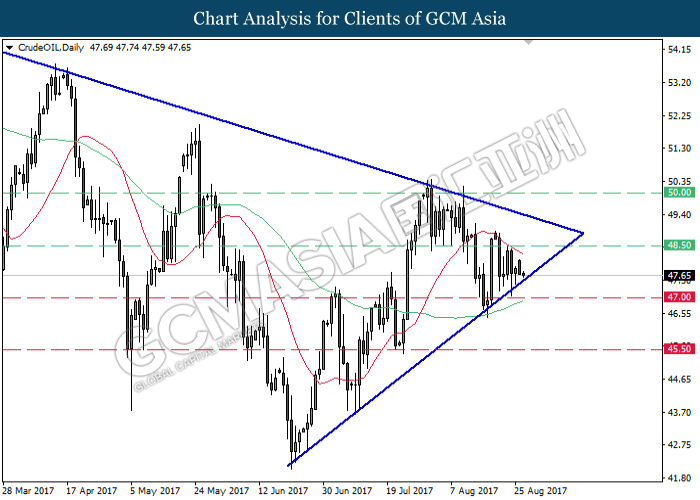
CrudeOIL, Daily: Crude oil price remains traded within a narrowing triangle while currently testing at the bottom level of the triangle. A successful breakout from this level would signal a change in trend direction to move further downwards while the next target would be at 47.00.
Resistance level: 48.50, 50.00
Support level: 47.00, 45.50