180917 Weekly Analysis
18 September 2017 Weekly Analysis
GCMAsia Weekly Report: September 18 – 22
Market Review (Forex): September 11 – 15
U.S. Dollar
US dollar fell against other major peers on Friday while on track for its first weekly gain since 13th August. The dollar index fell 0.30% to 91.85 during late Friday trading. For the week, it has pared prior losses by 0.55%.
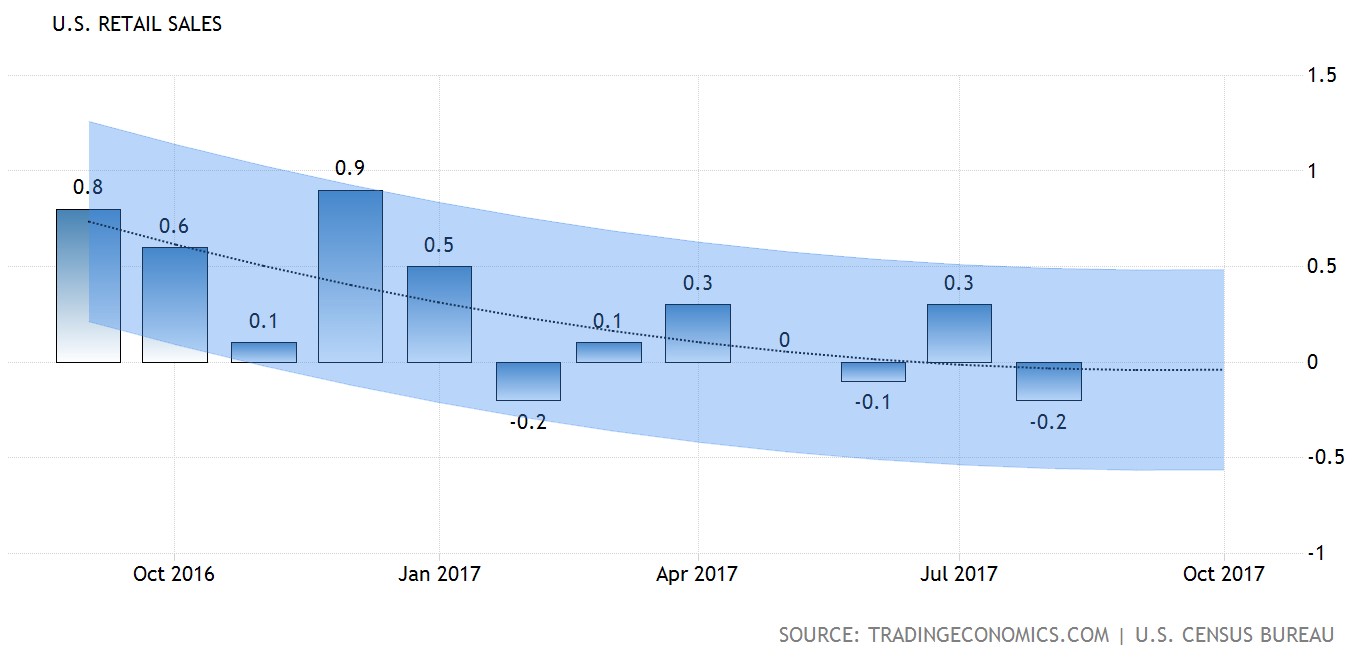
Greenback came under pressure on Friday following sluggish retail sales data which unexpectedly undershot economist consensus in August. According to the Commerce Department, retail sales for the month of August dipped 0.2%, missing economist forecast for a 0.1% rise.
Further weighing on the dollar was heightened geopolitical risk in the Korean Peninsula after North Korea fired a missile over Japan territory into the Pacific Ocean. Such provocation came after United States approved a new wave of economic sanction which includes a ban on textile and restriction on oil product shipments.
US Retail Sales
—– Forecast
US retail sales for the month of August fell by 0.2%, missed economist forecast of 0.1% rise.
USD/JPY
Pairing of USD/JPY extended gains, up 0.50% while ended near 7-weeks high of 110.82.
EUR/USD
EUR/USD rose 0.18% while ended the week at $1.1940.
GBP/USD
Pound sterling skyrocketed by 1.47% to $1.3594 against the US dollar during late Friday trading. Demand for the currency rose sharply following Bank of England’s indication on Thursday that interest rates could be raised faster than expected in the event of an accelerated pace of inflation.
Market Review (Commodities): September 11 – 15
GOLD
Gold price fell on Friday as investors shrugged off a rise in geopolitical risk following North Korea’s provocation last Thursday. Price of the yellow metal declined by 0.70% or $9.36 to $1,320.19 a troy ounce while tacking weekly loss of 1.95%.
Demand for safe-haven assets was diminished as the dollar stages its rebound due to rising prospects for an interest rate hike in December after data showed that inflation rose to its highest level in seven months on Thursday. According to the Fed Rate Monitor Tool, more than 50% of traders expected the Fed to hike their interest rate by December.
Crude Oil
Oil prices were traded flat on Friday while racking up its biggest weekly gain since July amid rising expectation that higher oil demand could accelerate the reduction in global oversupply for second half of the year. Crude oil price was held flat at $50.44 while recording a weekly gain of 1.12%.
According to a monthly report released by OPEC, production from Venezuela, Iraq, UAE and Saudi Arabia has fell by 79,000 barrels a day, offsetting rising output from Nigeria. This was followed by a report from International Energy Agency which forecasted a surge in demand for 2017 by 100,000 barrels per day, that could narrow the imbalance in oil market.
The duo of reports has overshadowed data from the US which showed a rise in crude inventories due to Hurricane Harvey which has forced several oil refinery rigs to shut off. Otherwise, US oilfield services firm Baker Hughes reported a decline in active oil rigs by 7 to a total of 749. The second consecutive weekly decline has suggested a slowdown in production which could further support the crude oil prices.
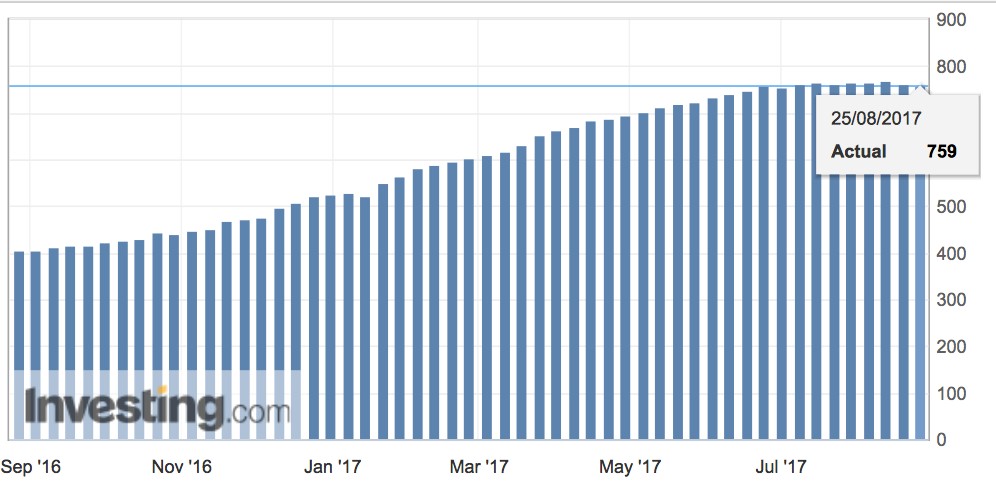
U.S. Baker Hughes Oil Rig Count
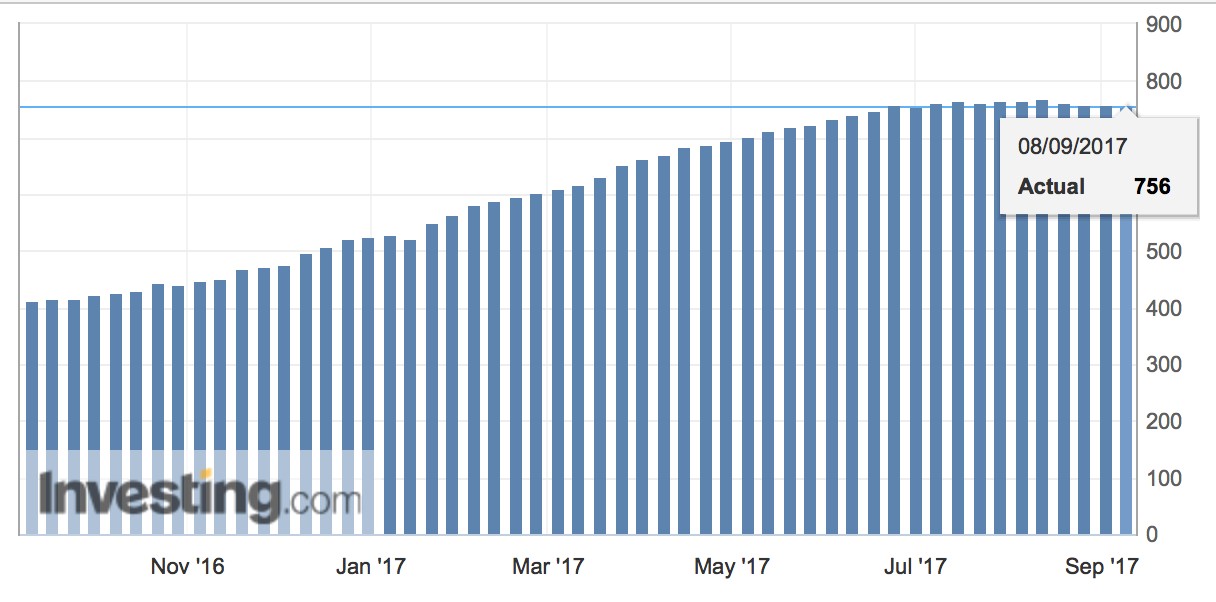
Active drilling rigs in the United States was down by 7 and the total count is currently at 749.
Weekly Outlook: September 18 – 22
For the week, investors will be eyeing on the release of retail sales data from the UK for further signal regarding the health of their economy amid looming Brexit. Likewise, British Prime Minister Theresa May is scheduled to deliver her speech on Saturday with regards to post-Brexit Britain relationship with the single economic zone – EU.
In the other region, market participants would also pay attention to speech by ECB President Mario Draghi and monthly reading of inflation in the EU to gain further signals regarding quantitative easing tapering. In the US, investors will be focusing on FOMC meeting on Thursday morning for further clues regarding next interest rate hike and balance sheet normalization plans.
As for oil traders, they will be scrutinizing on US inventories level by API and EIA to gauge the strength of crude demand for world’s largest oil consumer.
Highlighted economy data and events for the week: September 18 – 22
| Monday, September 18 |
Data EUR – CPI (YoY) (Aug)
Events GBP – BoE Gov Carney Speaks
|
| Tuesday, September 19 |
Data NZD – Westpac Consumer Sentiment (Q3) EUR – German ZEW Economic Sentiment (Sep) USD – Building Permits (Aug) USD – Housing Starts (MoM) (Aug) CAD – Manufacturing Sales (MoM) (Jul)
Events AUD – RBA Meeting Minutes
|
| Wednesday, September 20 |
Data CrudeOIL – API Weekly Crude Oil Stock JPY – Trade Balance GBP – Retail Sales (MoM) (Aug) USD – Existing Home Sales (Aug) CrudeOIL – Crude Oil Inventories USD – FOMC Interest Rate Decision
Events USD – FOMC Economic Projections USD – FOMC Statement USD – FOMC Press Conference
|
| Thursday, September 21 |
Data NZD – GDP (QoQ) (Q2) JPY – BoJ Interest Rate Decision USD – Initial Jobless Claims USD – Philadelphia Fed Manufacturing Index (Sep) CAD – Wholesale Sales (MoM) (Jul)
Events JPY – BoJ Monetary Policy Statement (YoY) JPY – BoJ Press Conference EUR – ECB President Draghi Speaks
|
|
Friday, September 22
|
Data EUR – German Manufacturing PMI (Sep) CAD – Core CPI (MoM) (Aug) CAD – Core Retail Sales (MoM) (Jul) USD – Manufacturing PMI (Sep) USD – Markit Composite PMI USD – Services PMI (Sep) CrudeOIL – US Baker Hughes Oil Rig Count
Events EUR – ECB President Draghi Speaks USD – FOMC Member Williams Speaks USD – FOMC Member George Speaks USD – FOMC Member Kaplan Speaks GBP – UK Prime Minister May Speaks
|
Technical weekly outlook: September 18 – 22
Dollar Index
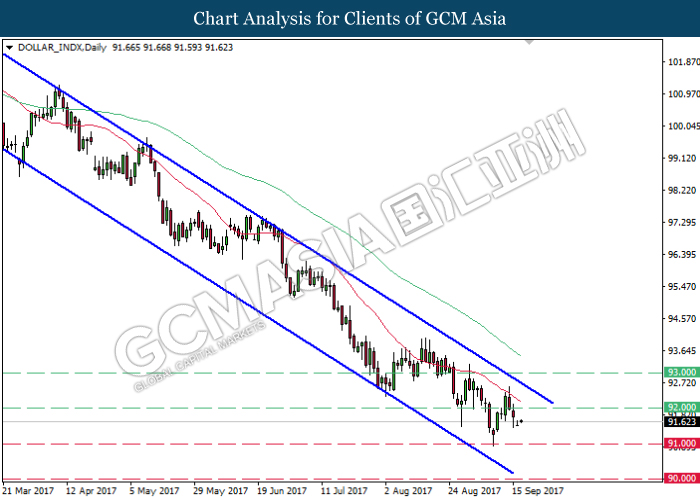
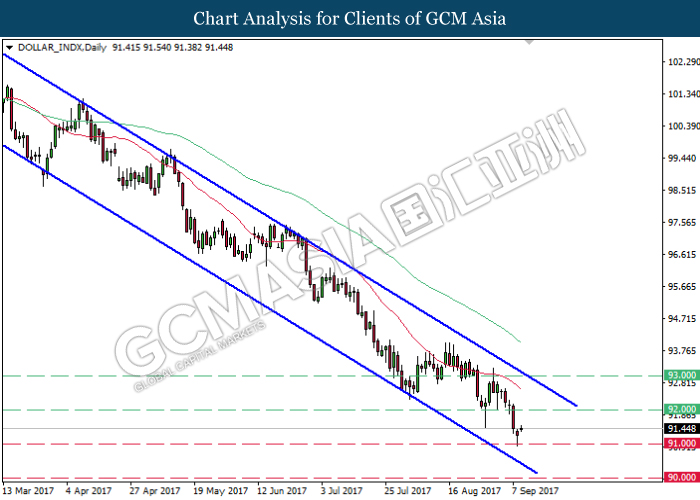
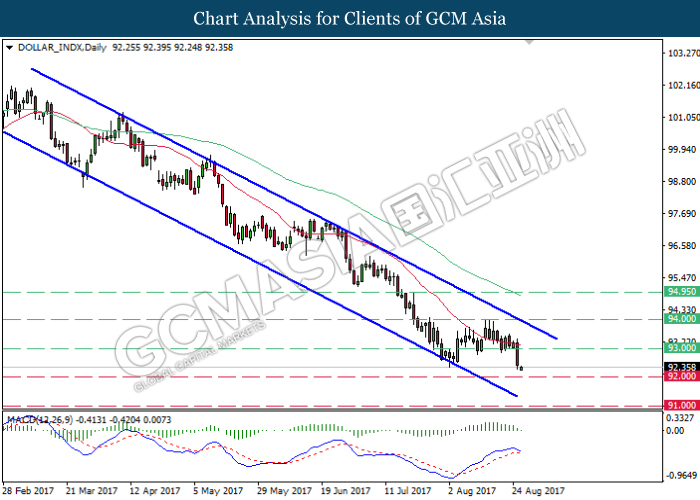
DOLLAR_INDX, Daily: The dollar index remains traded within a downward channel recently rebounded from the mid-level of the channel. Such price action suggests further upside bias for the index to retest at the resistance level of 92.00.
Resistance level: 92.00, 93.00
Support level: 91.00, 90.00
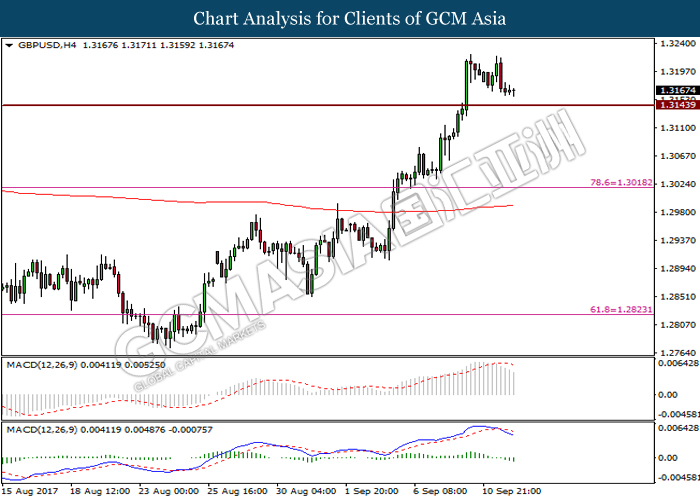
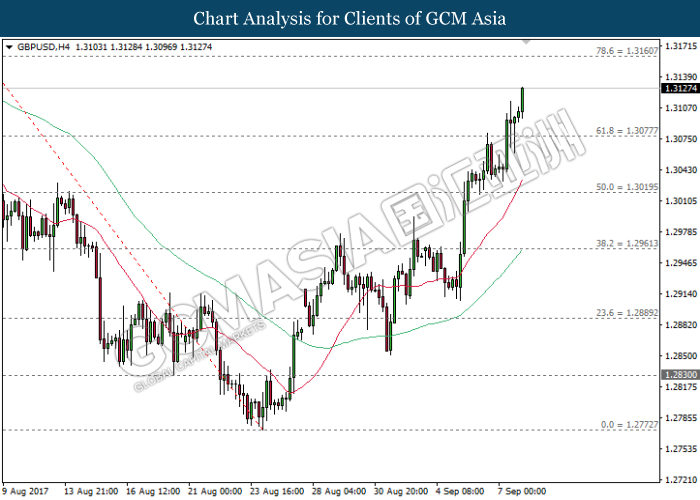
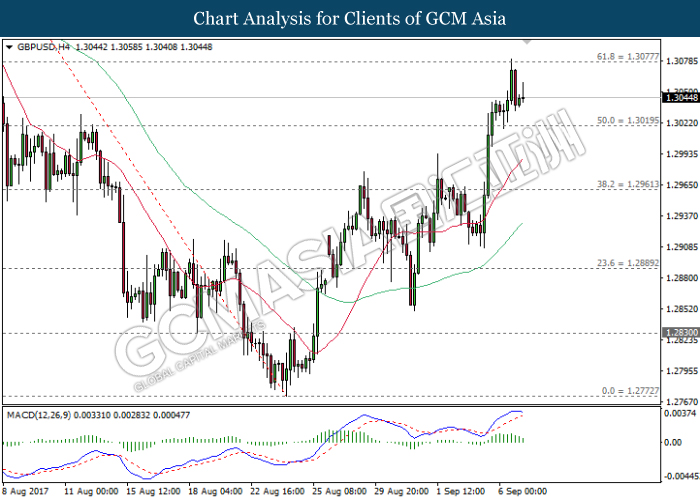
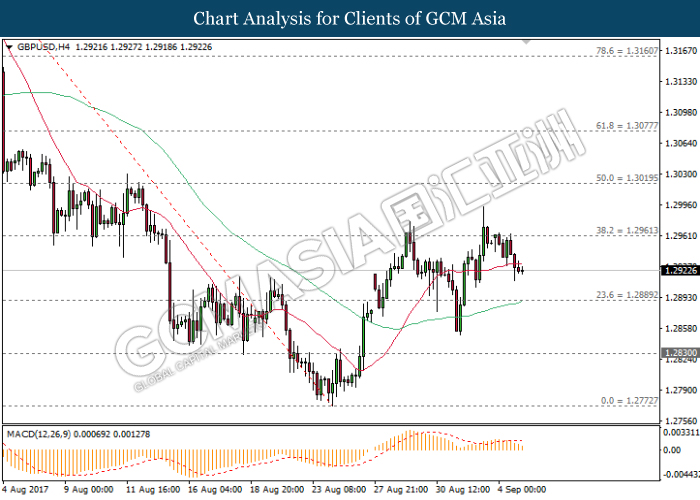
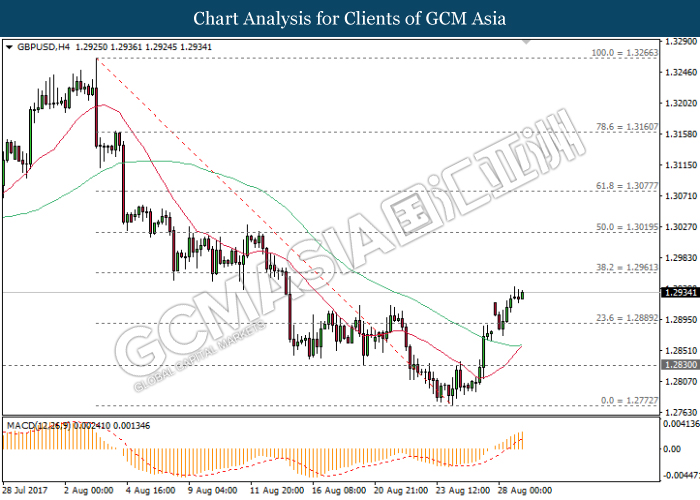
GBPUSD
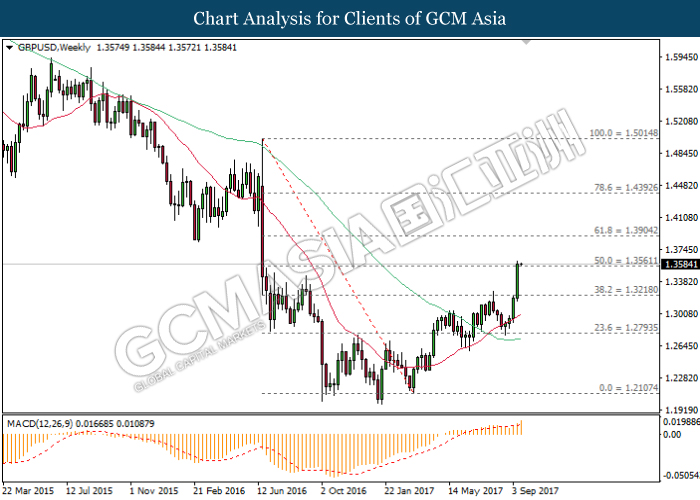
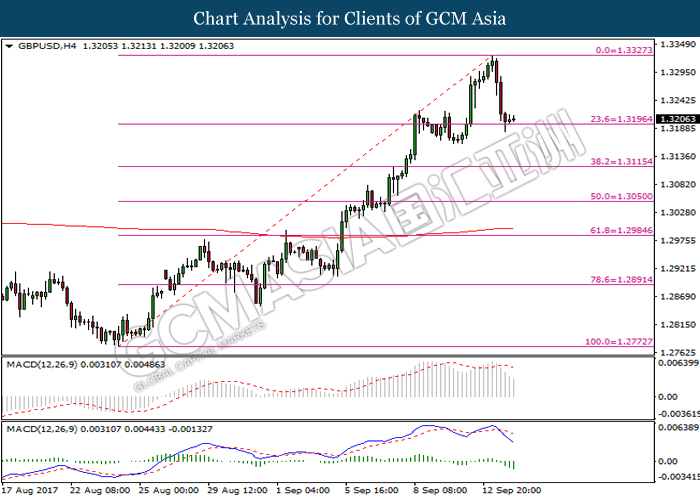
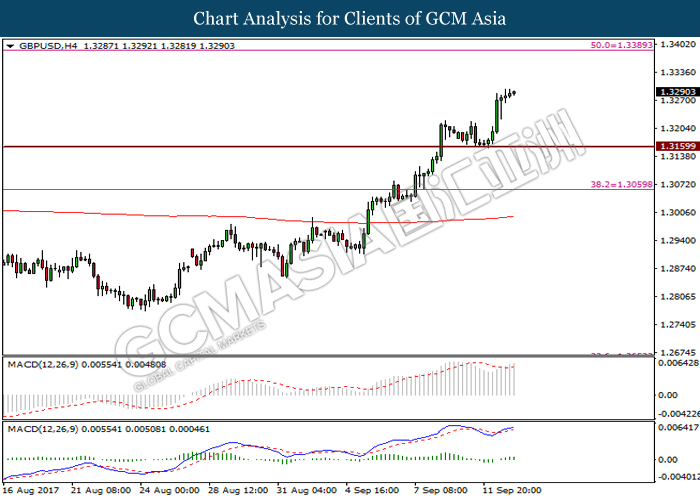
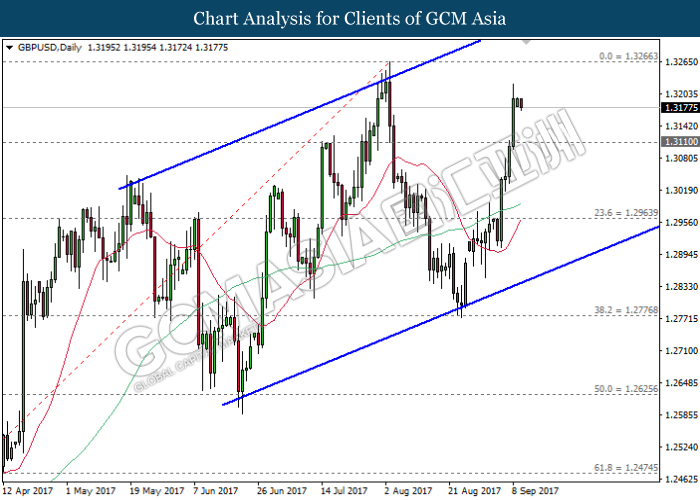
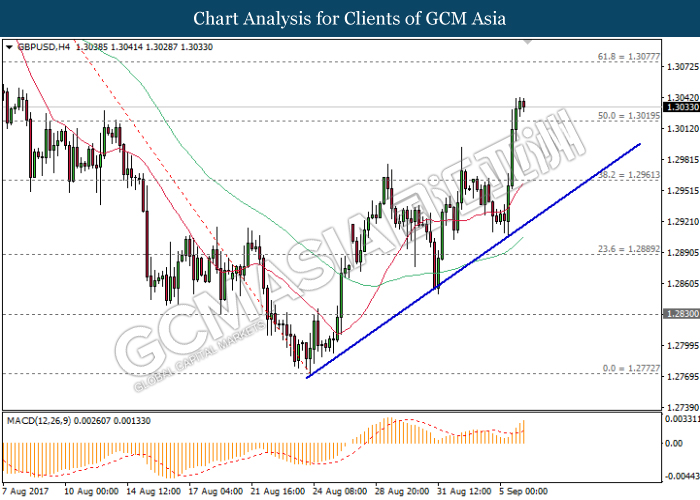
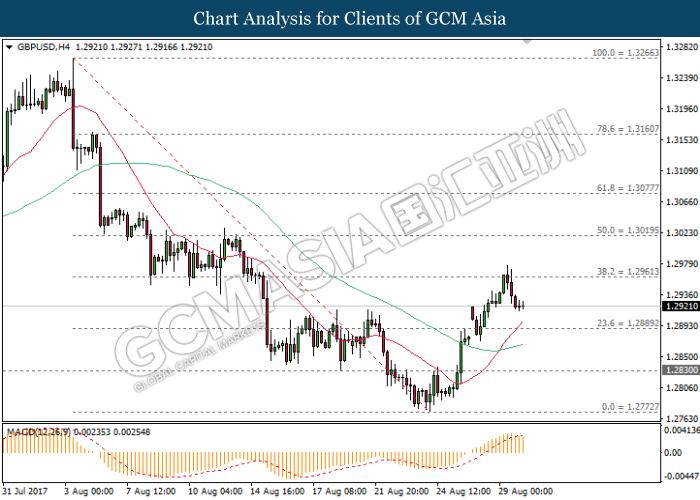
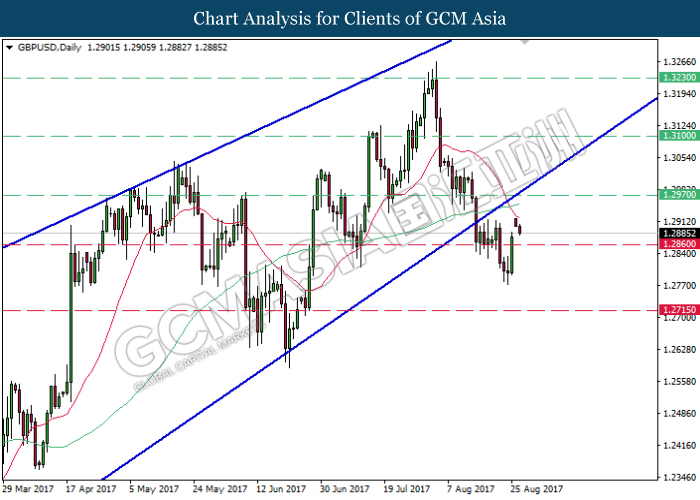
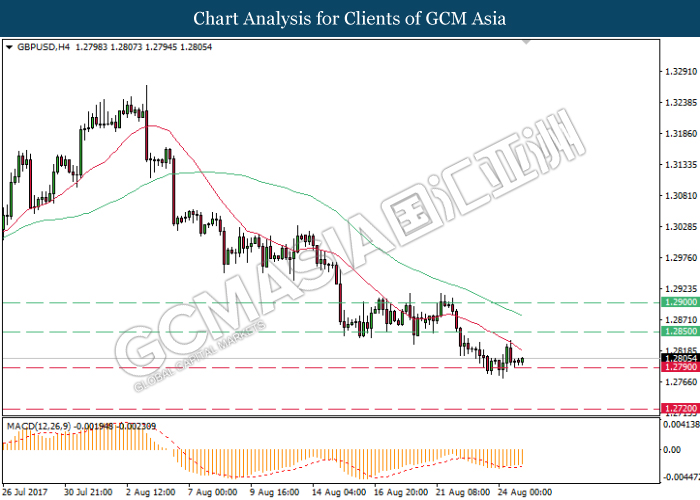
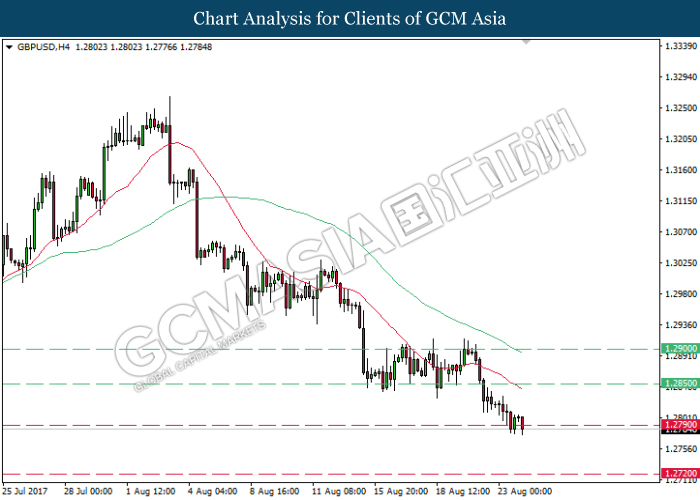
GBPUSD, Weekly: GBPUSD skyrocketed while recently closed above the 50.0 Fibonacci level of 1.3560. MACD indicator which illustrate substantial upward momentum suggests the pair to extend its gains, towards the next target at 1.3900.
Resistance level: 1.3900, 1.4395
Support level: 1.3560, 1.3220
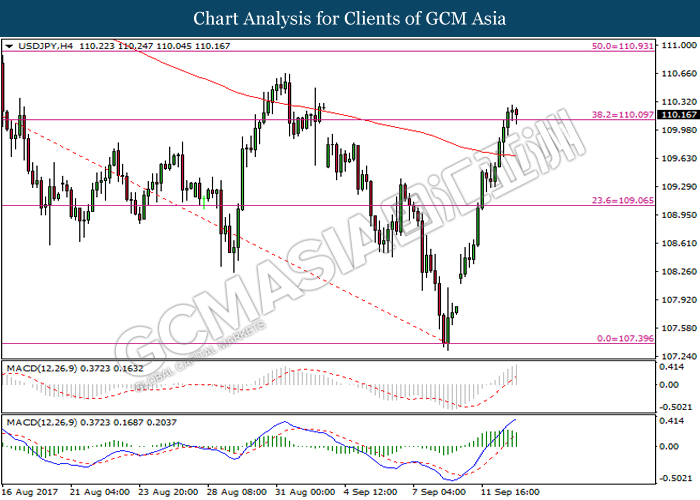
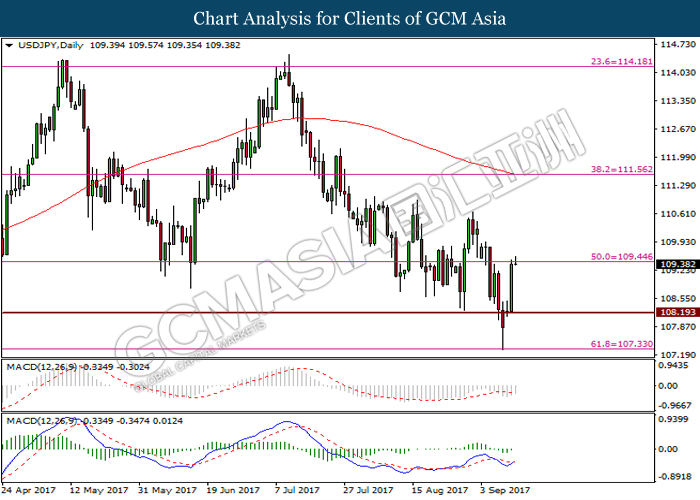
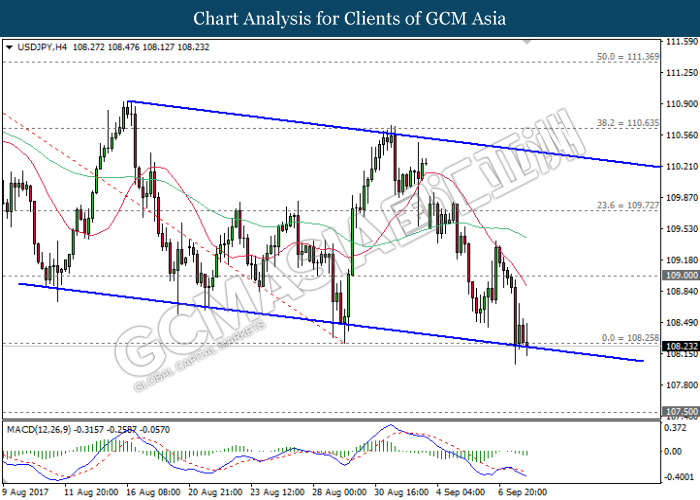
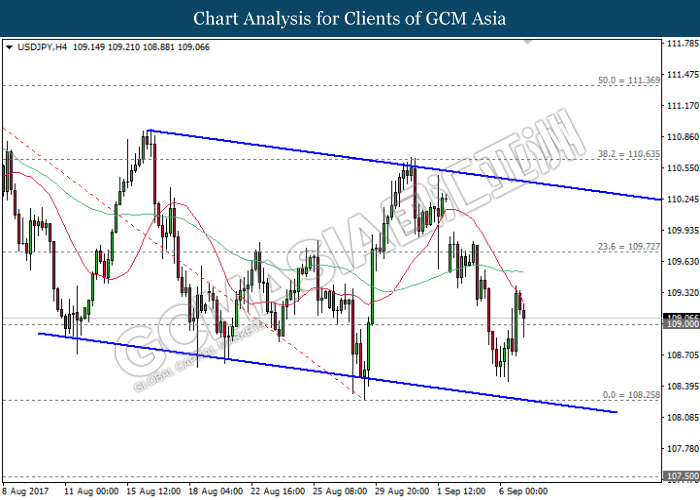
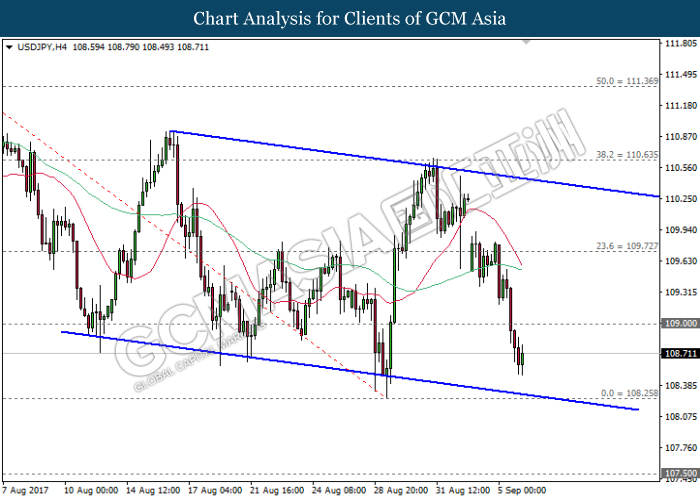
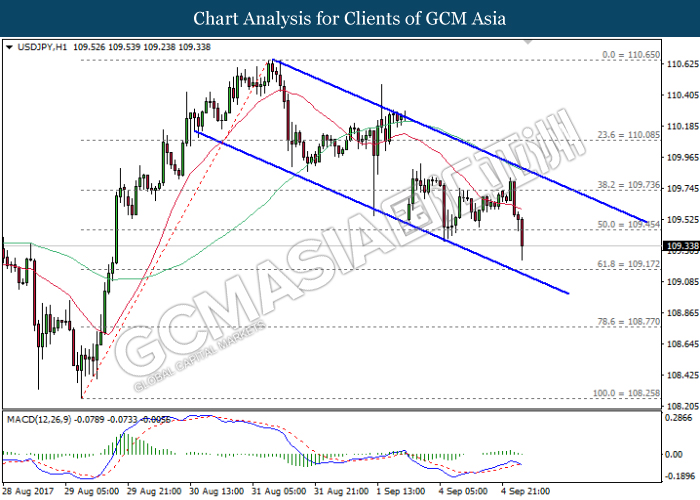
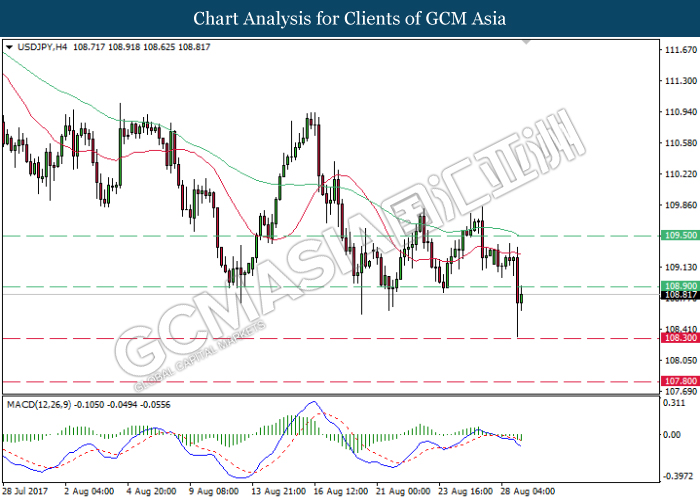
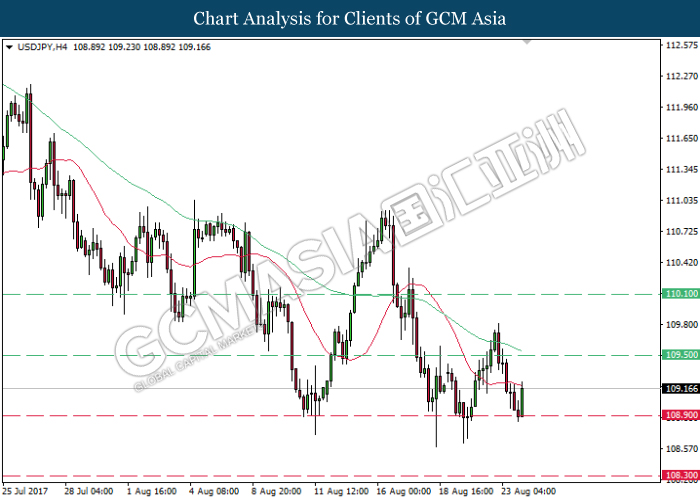
USDJPY
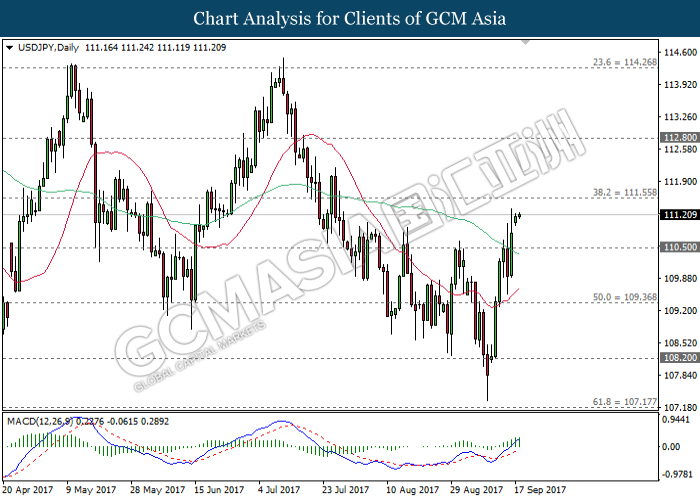
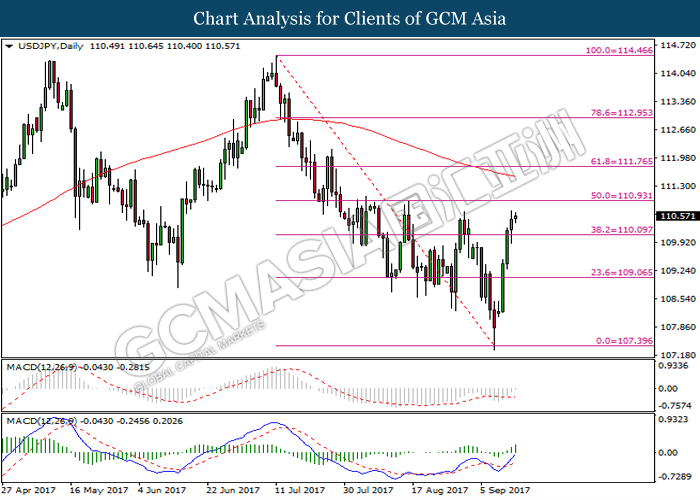
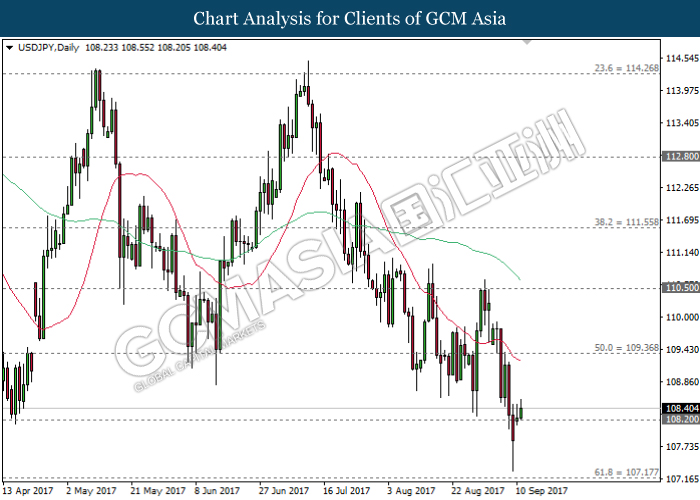
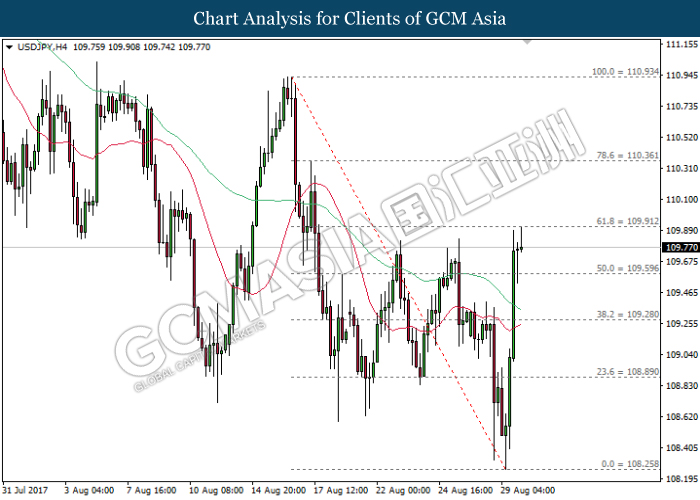
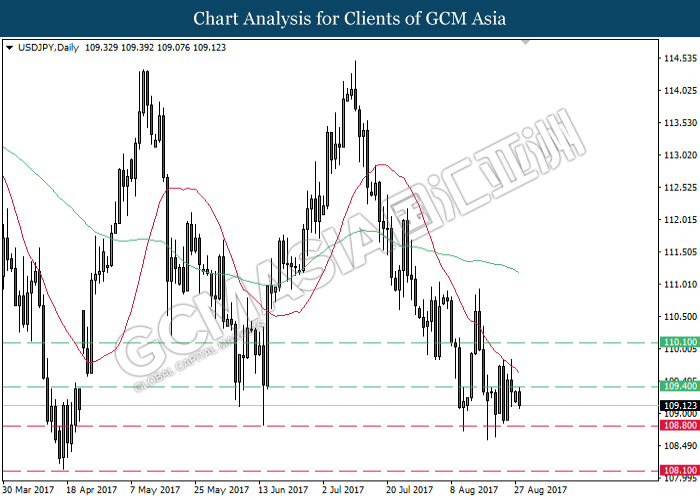
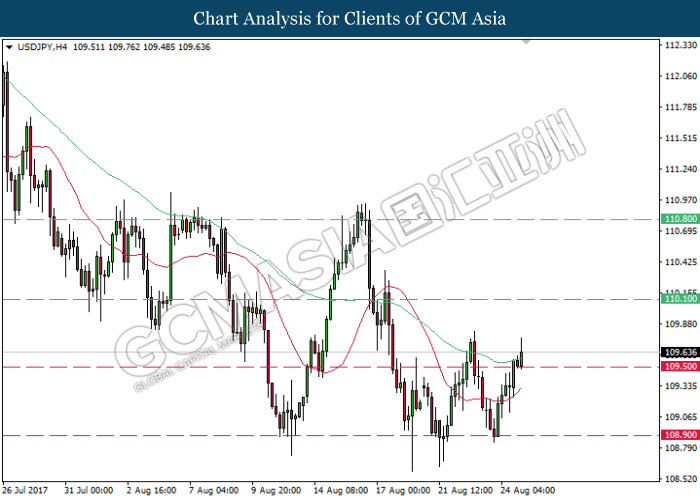
USDJPY, Daily: USDJPY extended its gains following prior closure above the resistance level of 110.50. MACD histogram which illustrate substantial upward signal suggests the pair to extend its upward momentum and retest at the resistance level of 111.55.
Resistance level: 111.55, 112.80
Support level: 110.50, 109.35
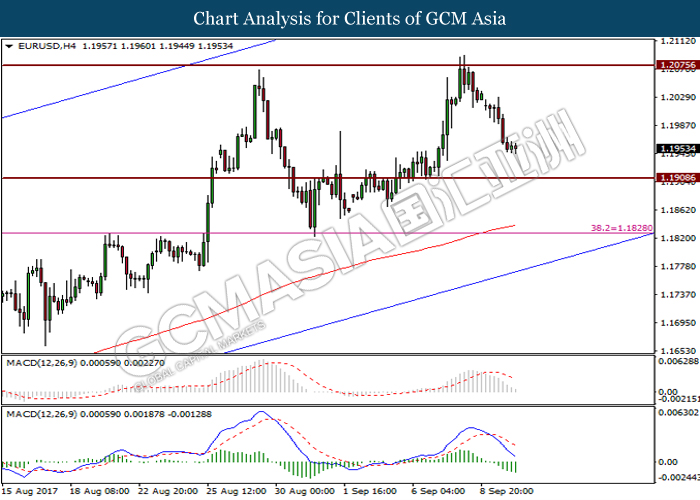
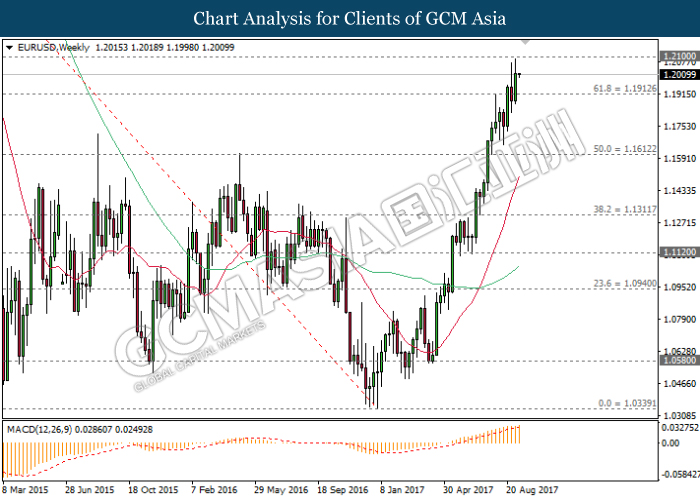
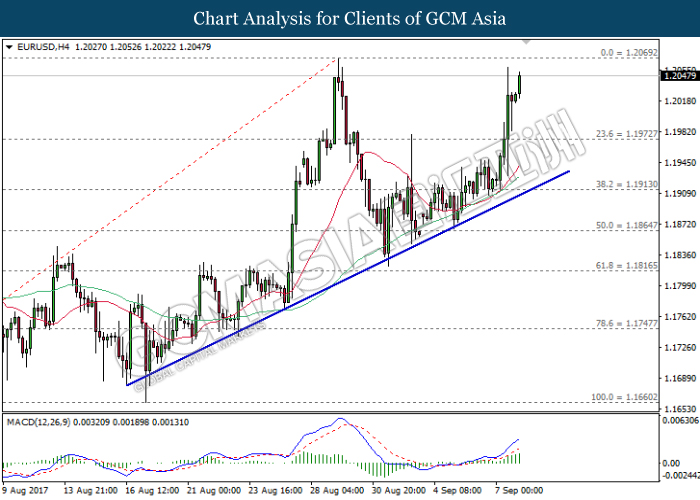
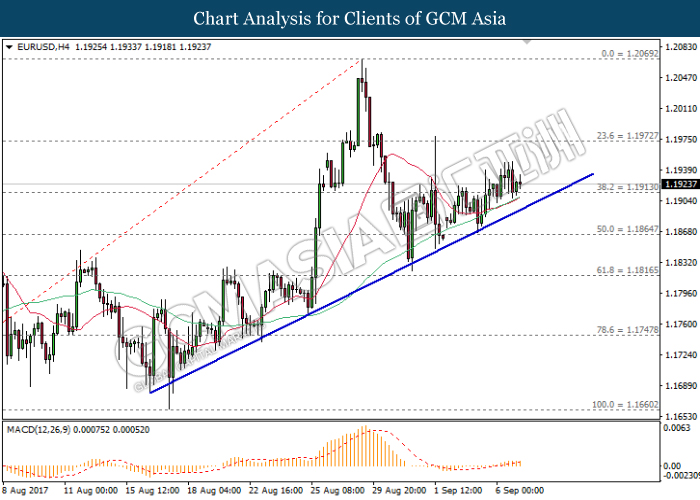
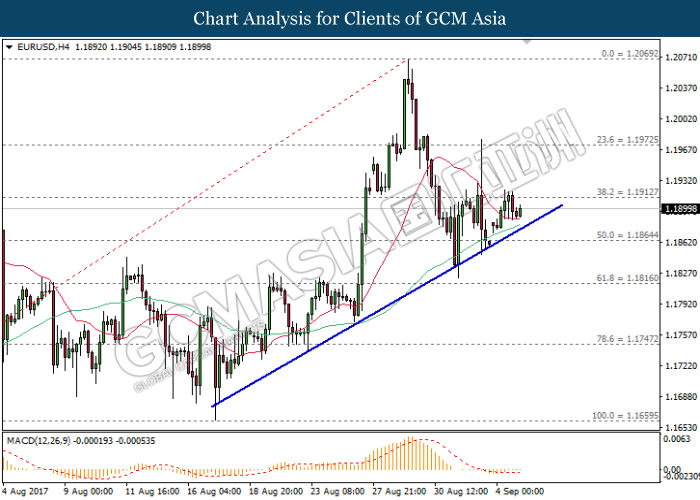
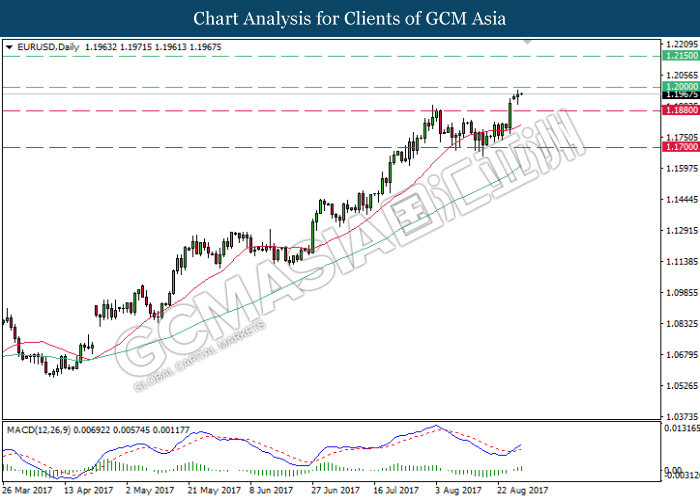
EURUSD
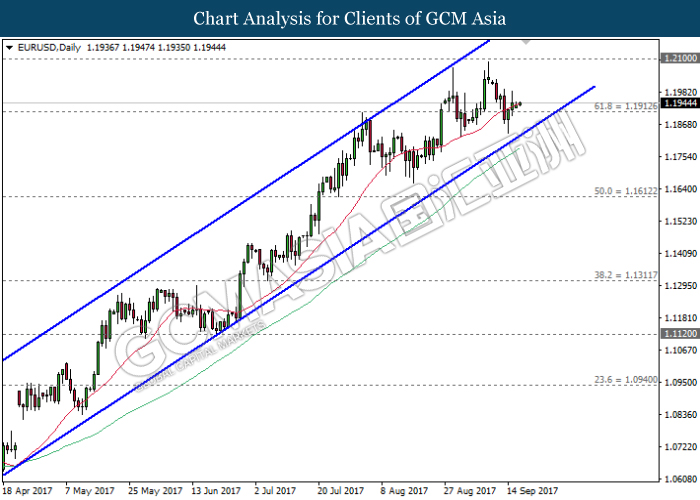
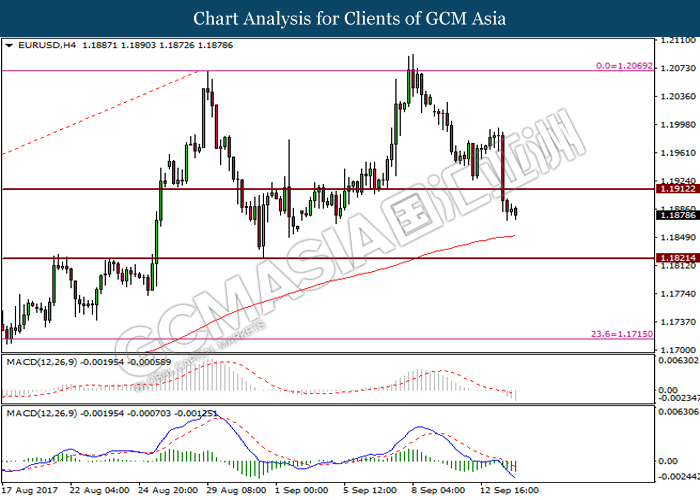
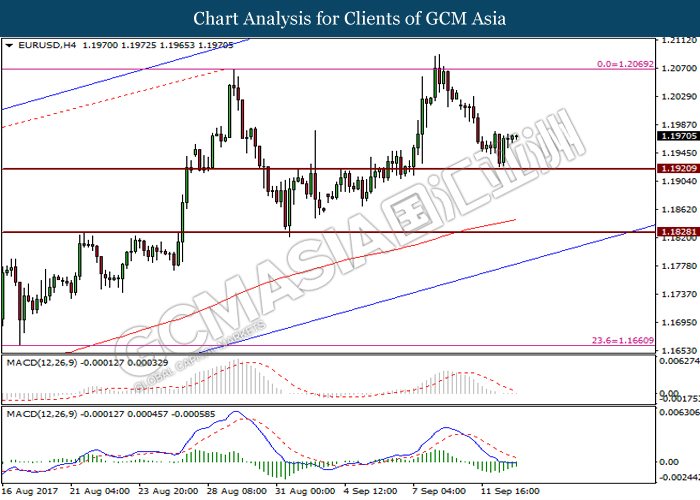
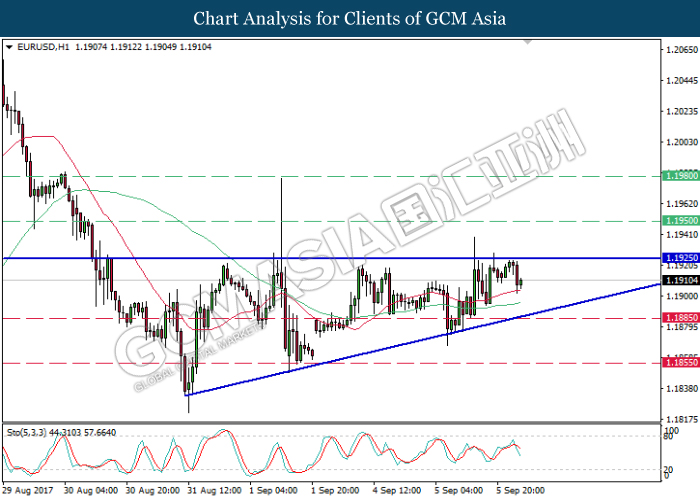
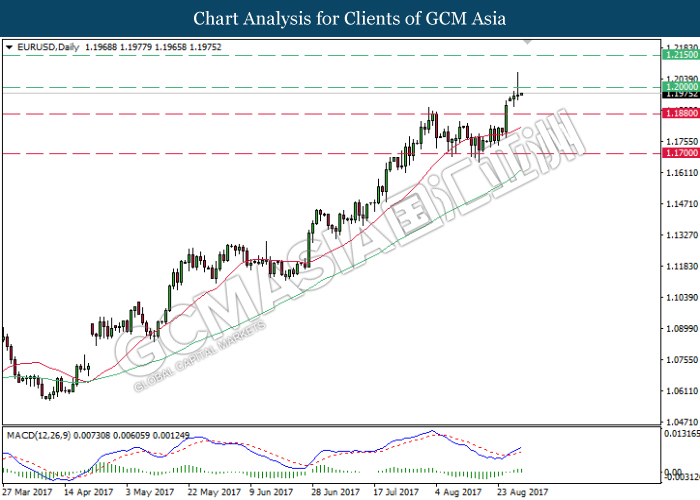
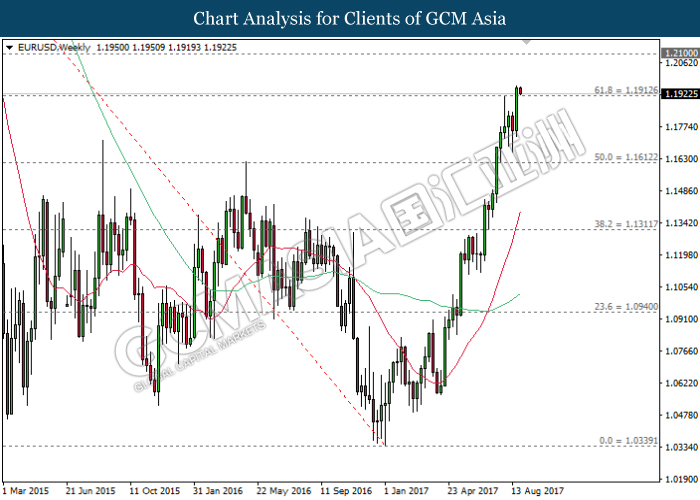
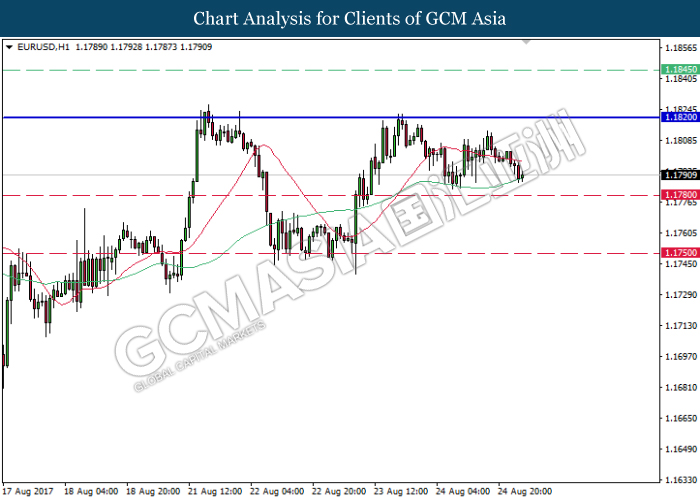
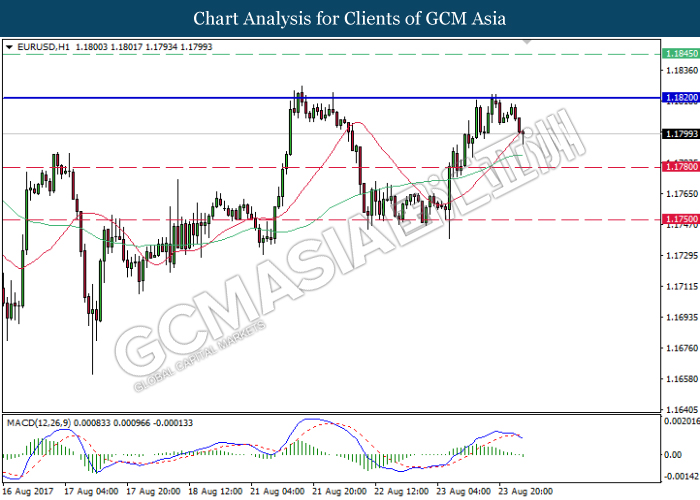
EURUSD, Daily: EURUSD was traded within an upward channel following prior rebound from the bottom level. A successful closure above the 20-MA line (red) would suggest further upside bias, to advance towards the next target at 1.2100.
Resistance level: 1.2100, 1.2340
Support level: 1.1910, 1.1610
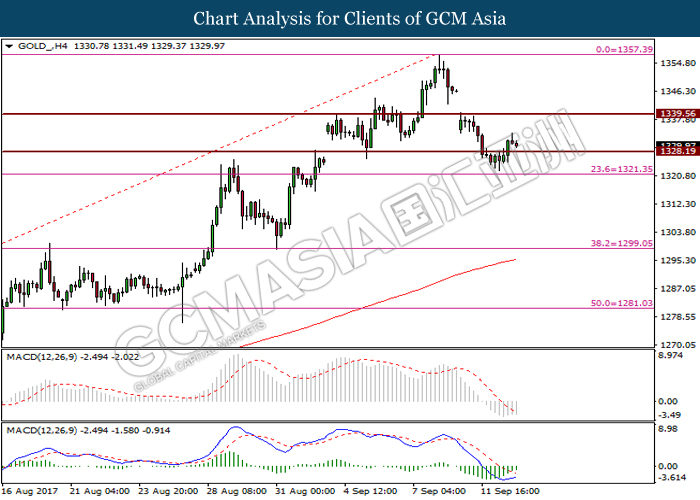
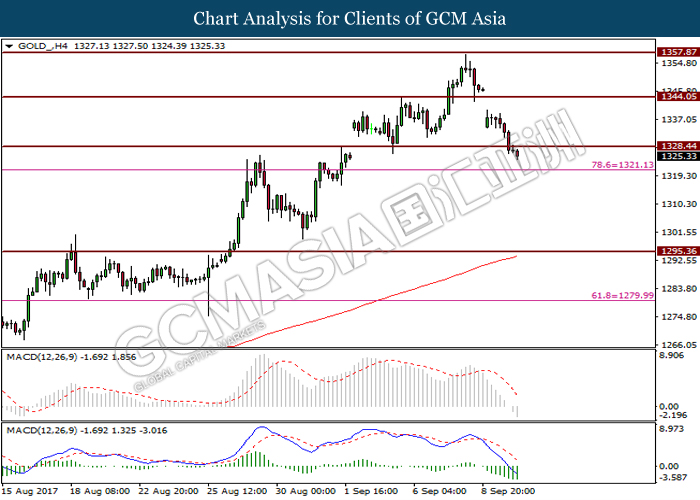
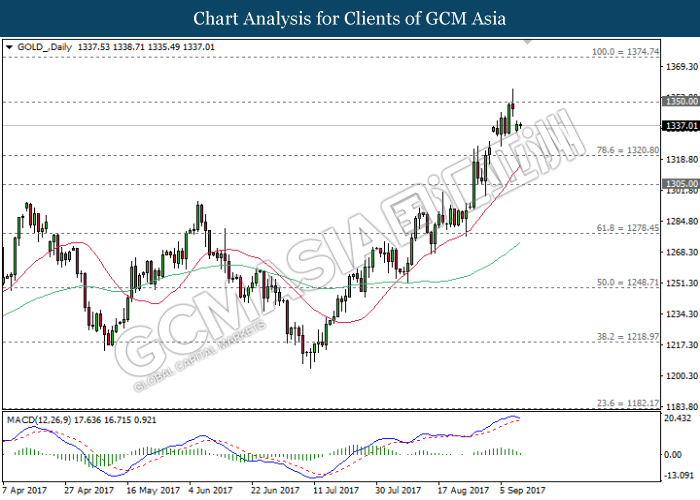
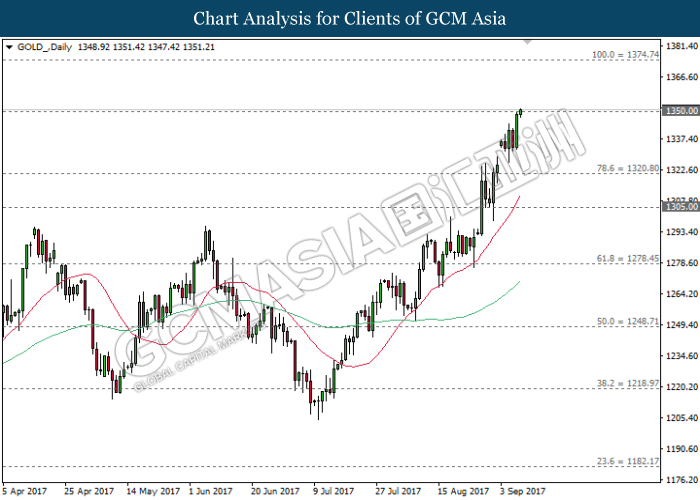
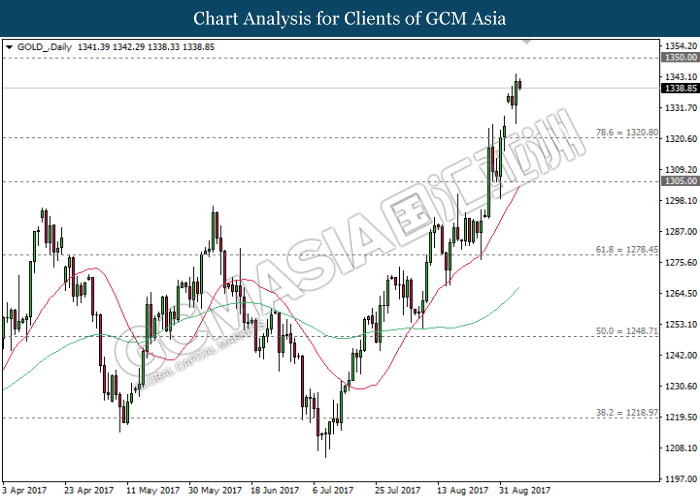
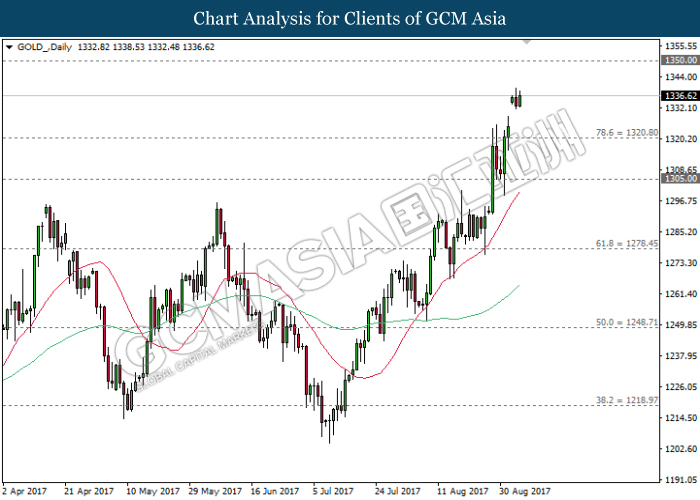
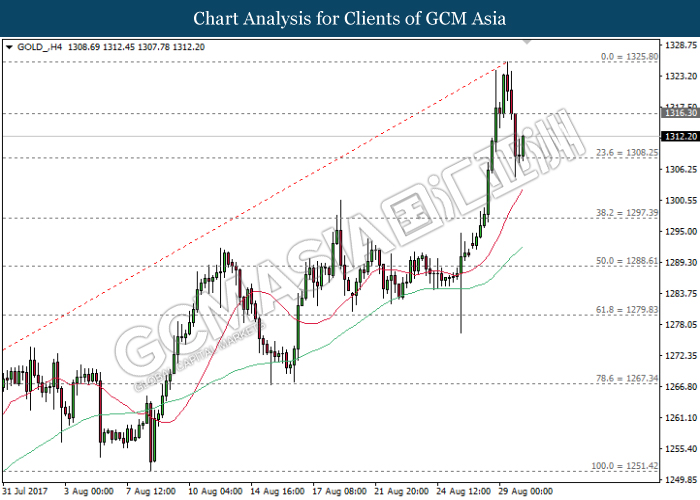
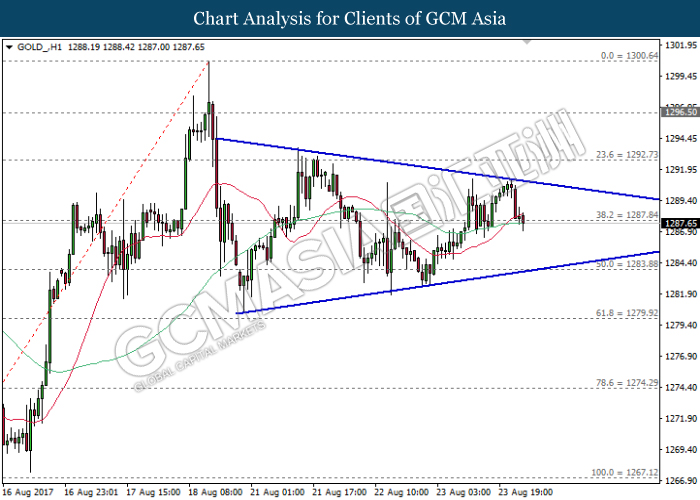
GOLD
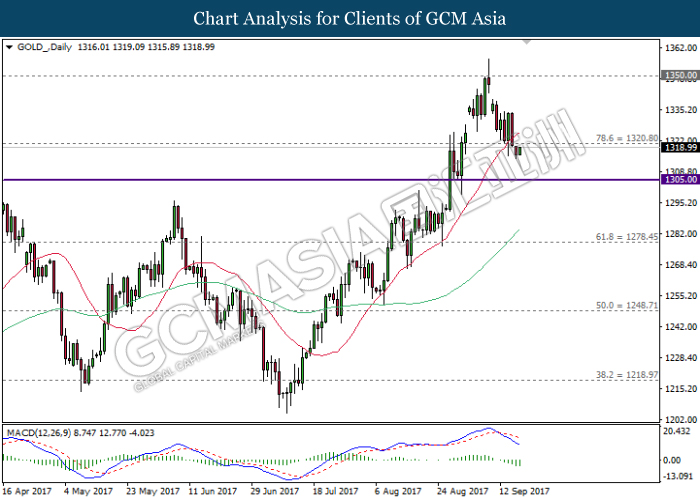
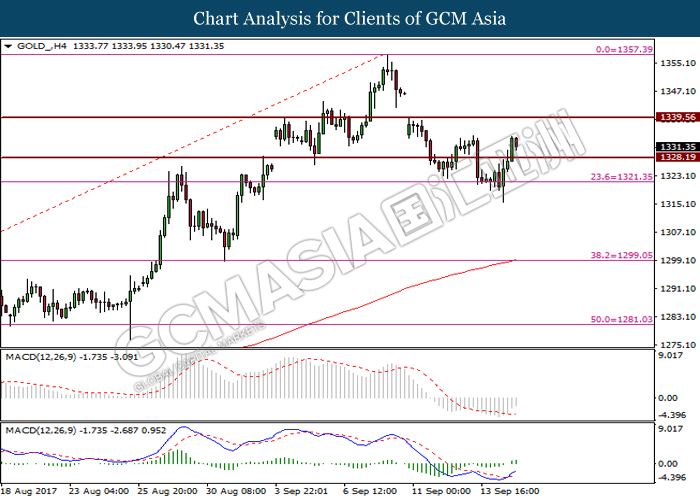
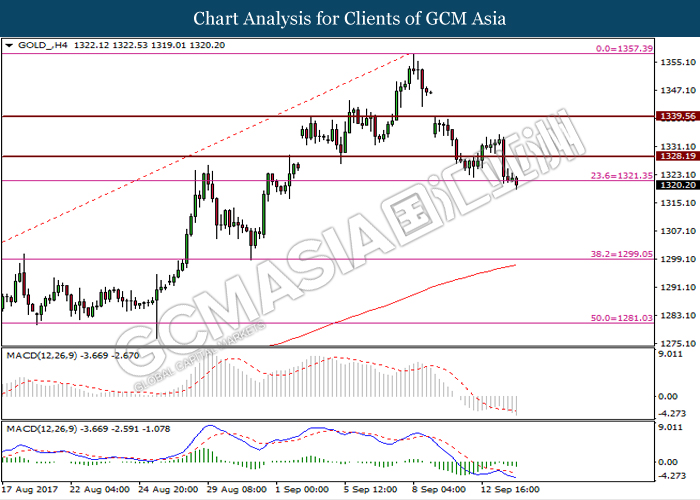
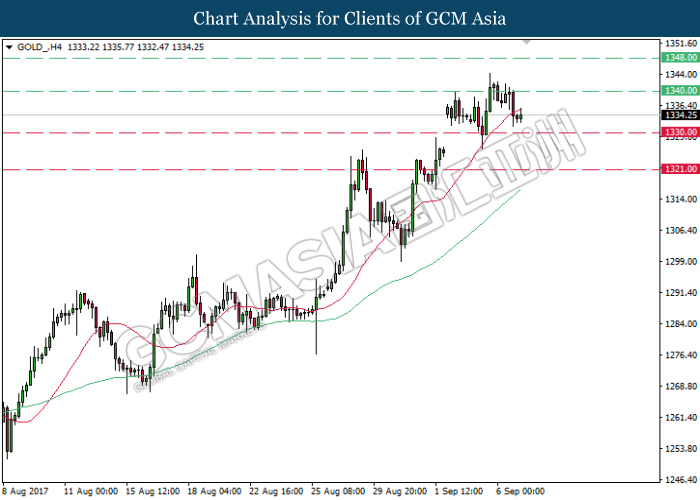
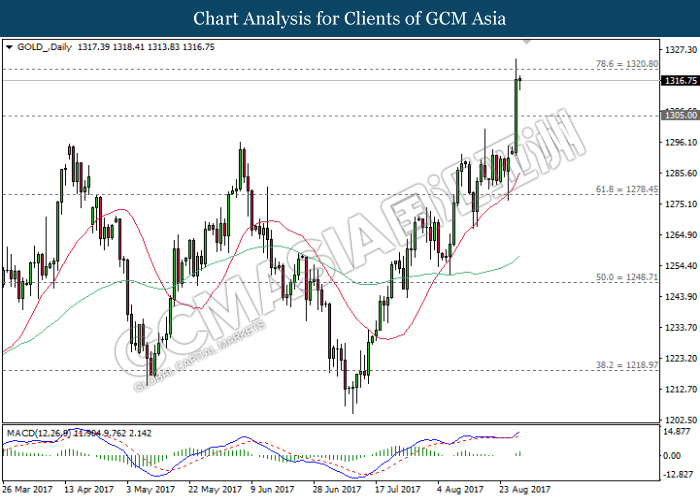
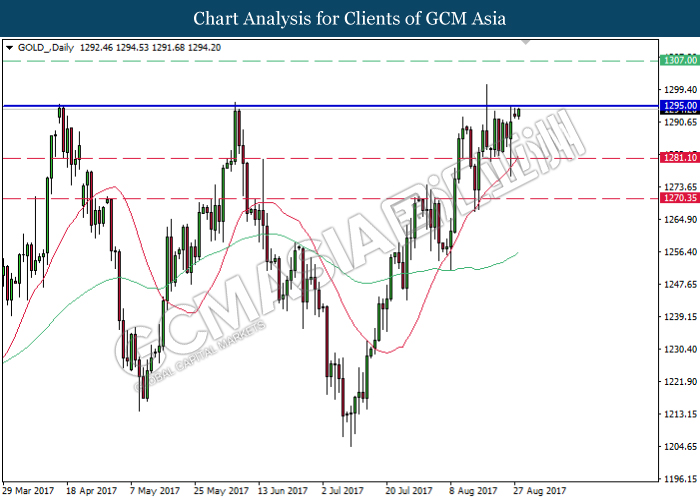
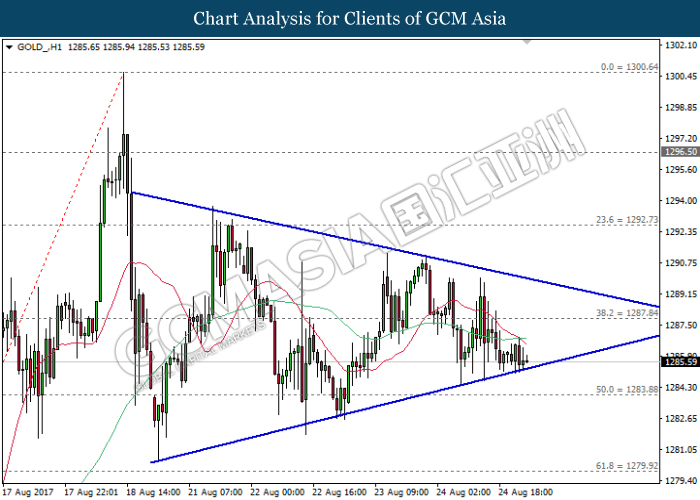
GOLD_, Daily: Gold price was traded lower following prior closure below the 20-MA line (red). MACD histogram indicator which illustrate substantial downward momentum suggests gold price to extend its losses, towards the next target at 1305.00.
Resistance level: 1320.80, 1350.00
Support level: 1305.00, 1278.45
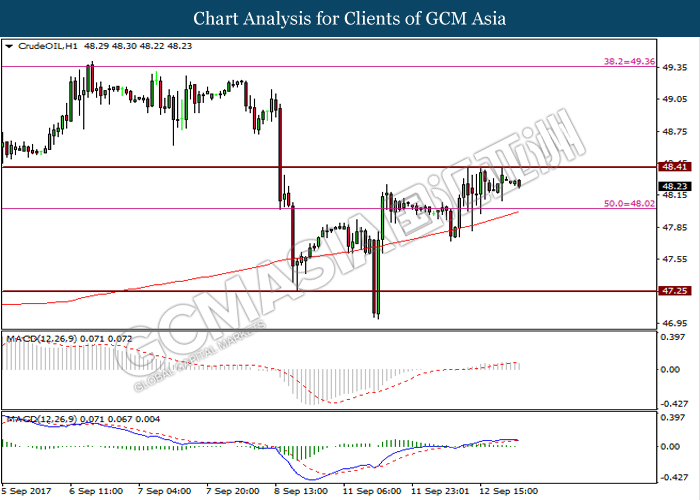
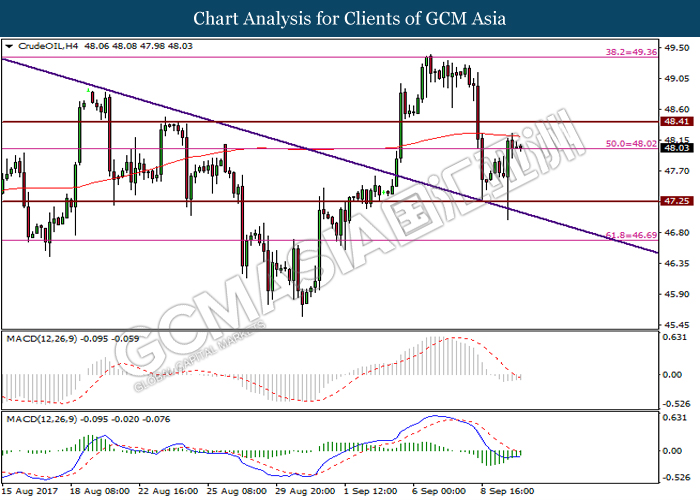
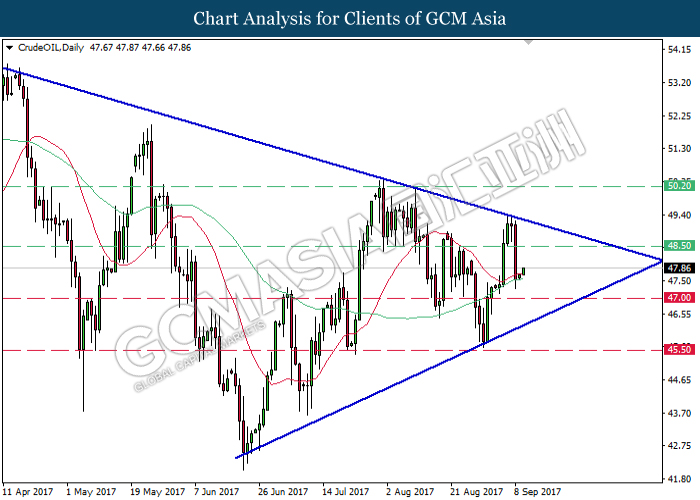
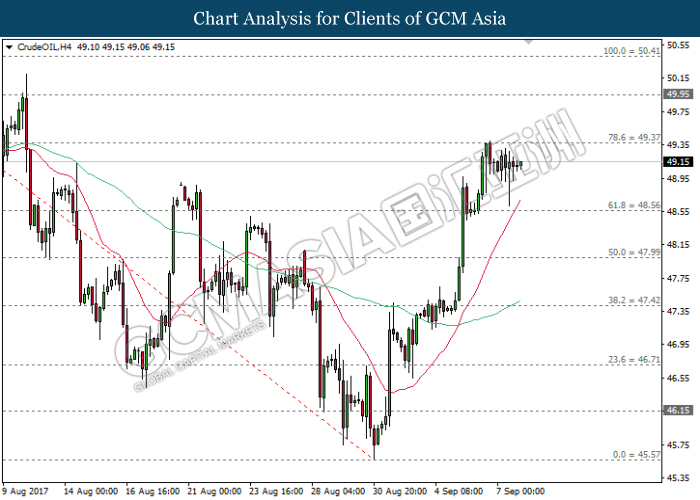
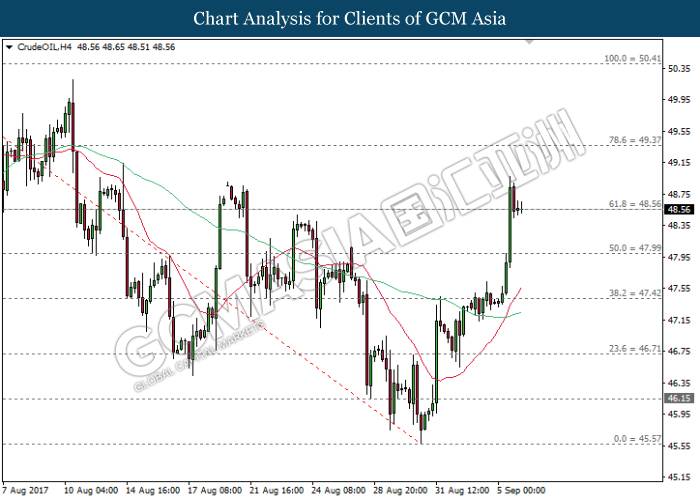
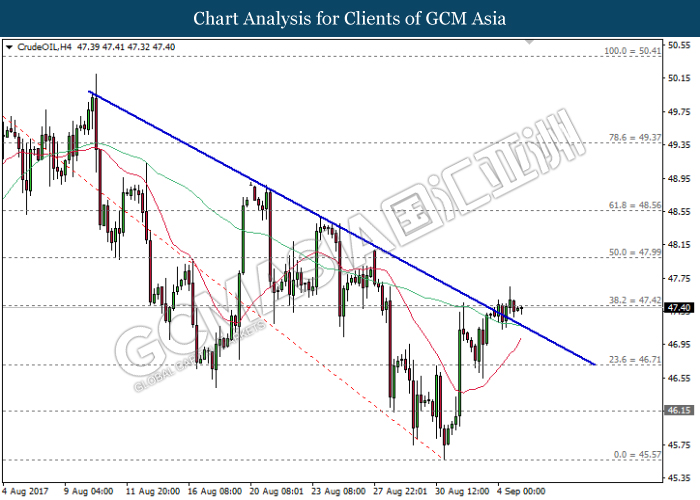
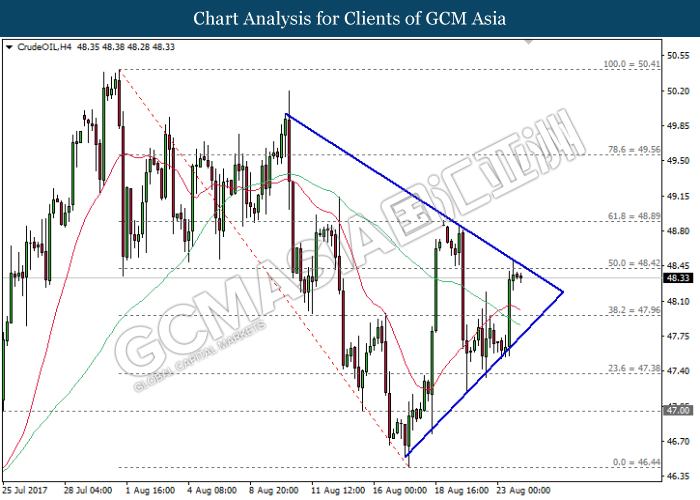
Crude Oil
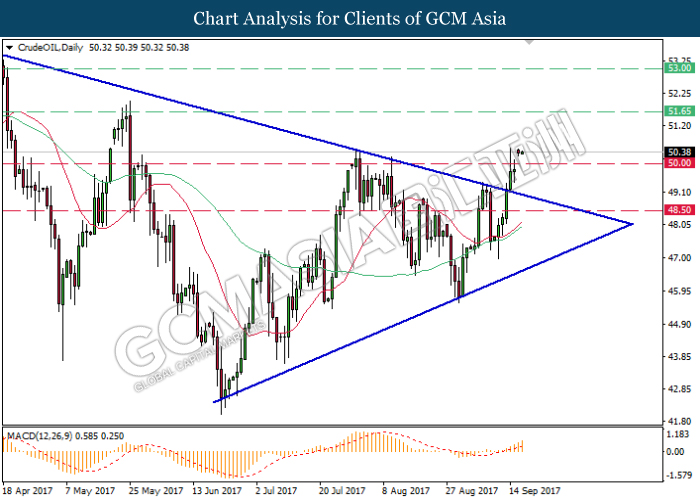
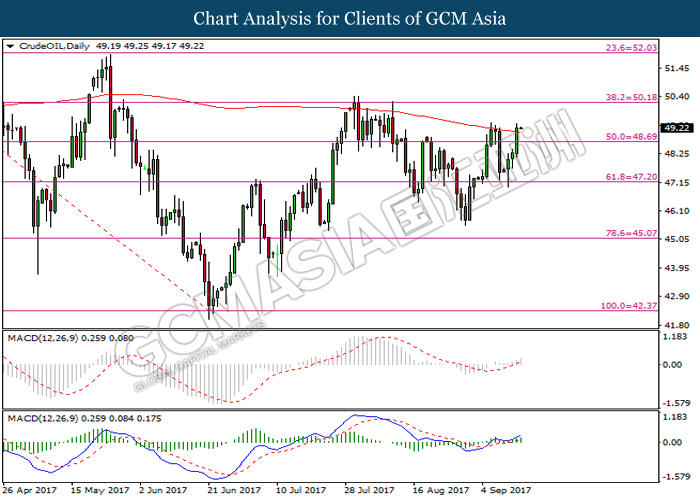
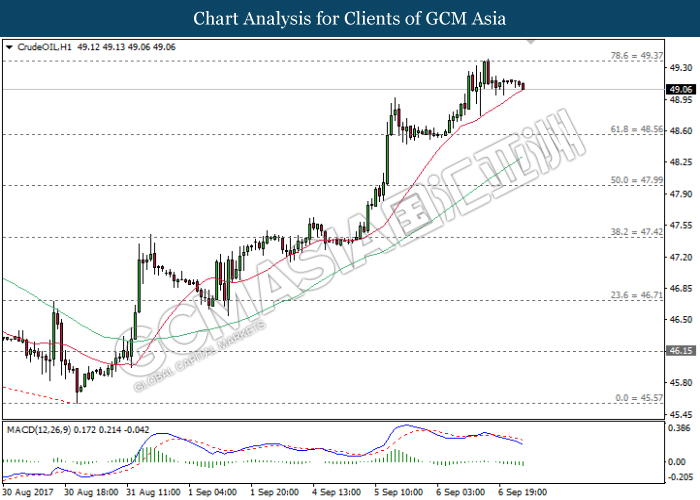
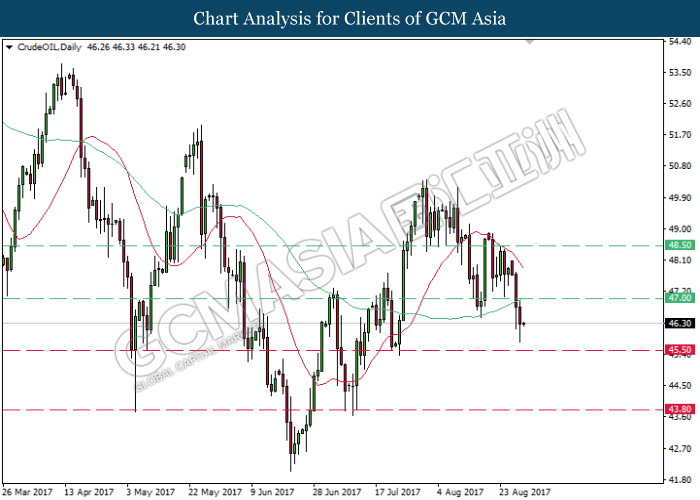
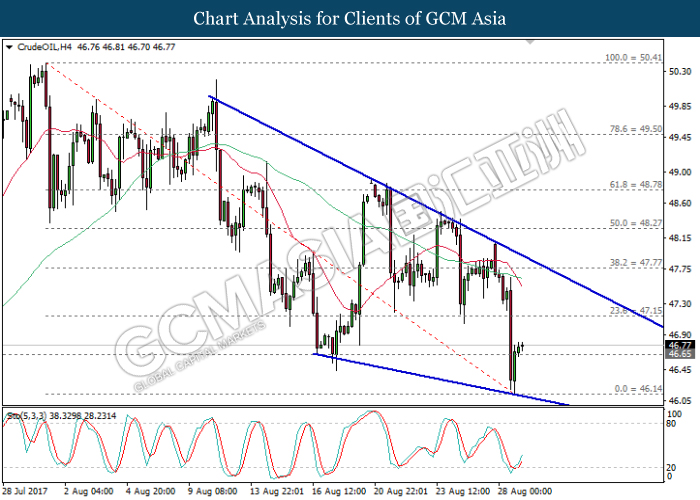
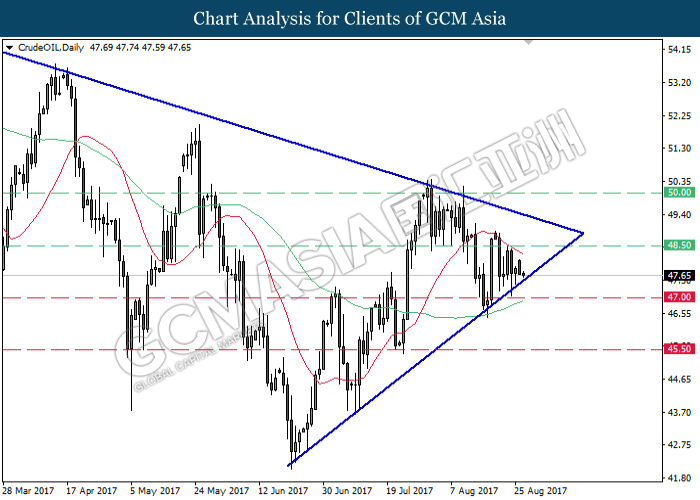
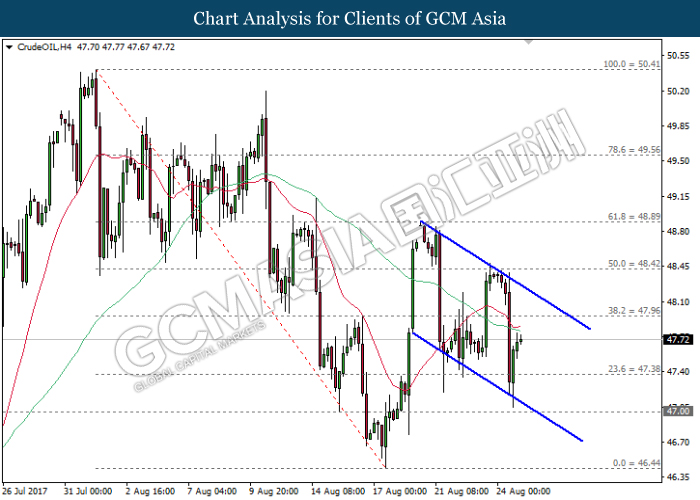
CrudeOIL, Daily: Crude oil price extended gains following prior successful breakout from the top level of narrowing triangle, signaling a change in trend direction to move further upwards. MACD indicator which illustrate substantial upward momentum suggests the price to extend its gains, towards the next target at the resistance level of 51.65.
Resistance level: 51.65, 53.00
Support level: 50.00, 48.50
150917 Daily Analysis
15 September 2017 Daily Analysis
Greenback on support, North Korea Fired Geopolitical Uncertainty.
The U.S. dollar index was traded at 92.03 against the other major currencies after an ease of 0.01%. A sharp increase in sterling to one-year highs amid rising expectations toward Bank of England’s raising interest rates has offset the duo positive economic reports in U.S. which shown better-than-expected results, namely the inflation and initial claims jobless data. According to the Labor Department, there was a rose of 0.4% in Consumer Price Index (CPI) in the month of August, reflecting the greatest monthly gain in seven months. On the other hand, initial jobless claims was reported to be reduced by 14,000 to 284,000 against the forecasts of a 2,000 increase. Besides that, USD/JPY down 0.20% to 110.05 after North Korea fired an intermediate range ballistic missile over Japan’s northern Hokkaido Island and east of Pacific Ocean.
For the commodity market, crude oil price dropped 0.52% to $49.63 per barrel after an intermediate range ballistic missile test conducted by North Korea in response to current U.S. and its allies for pushing UN economic sanctions. Otherwise, gold prices traded steadily with a slight losses of 0.20% to $1330.50 amid dollar weakness. However, gains were limited due to positive market sentiment toward Federal Reserve to increase interest rate for the third time this year, based on an upbeat consumer price data that hit a 7-month high in August.
Today’s Holiday Market Close
Time Market Event
N/A
Today’s Highlight Events
Time Market Event
N/A
Today’s Highlight Economy Data
| Time | Nation & Data | Previous | Forecast | Actual |
| 20:30 | USD – Core Retail Sales (MoM) (Aug) | 0.5% | 0.5% | – |
| 20:30 | USD – NY Empire State Manufacturing Index (Sep) | 25.20 | 19.00 | – |
| 20:30 | USD – Retail Sales (MoM) (Aug) | 0.6% | 0.1% | – |
| 21:15 | USD – Industrial Production (MoM) (Aug) | 0.2% | 0.2% | – |
| 22:00 | USD – Michigan Consumer Sentiment (Sep) | 96.8 | 95.2 | – |
| 01:00 | CrudeOIL – US Baker Hughes Oil Rig Count | 756 | – | – |
GBPUSD
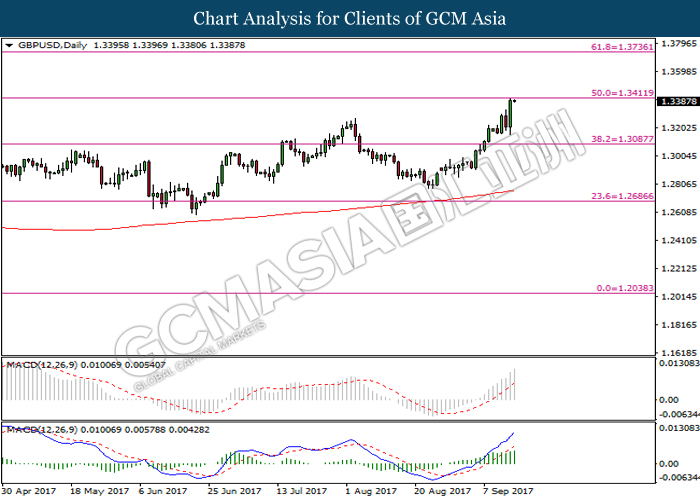
GBPUSD, Daily: GBPUSD was traded higher prior breaking above resistance level at 1.3085. The pair is currently testing the resistance level at 1.3410. Upward slope of MACD signal line suggests GBPUSD to trade higher if the breakout of the said resistance level is successful.
Resistance level: 1.3410, 1.3735
Support level: 1.3085, 1.2685
EURUSD
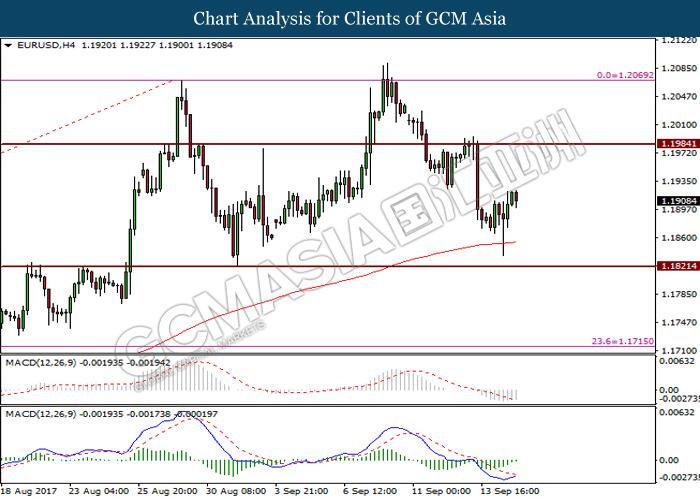
EURUSD, H4: EURUSD was traded higher prior its rebound from 200-MA line. Positive divergence as shown by MACD histogram suggests EURUSD to continue its momentum to move higher toward the resistance level at 1.1985.
Resistance level: 1.1985, 1.2070
Support level: 1.1820, 1.1715
USDJPY
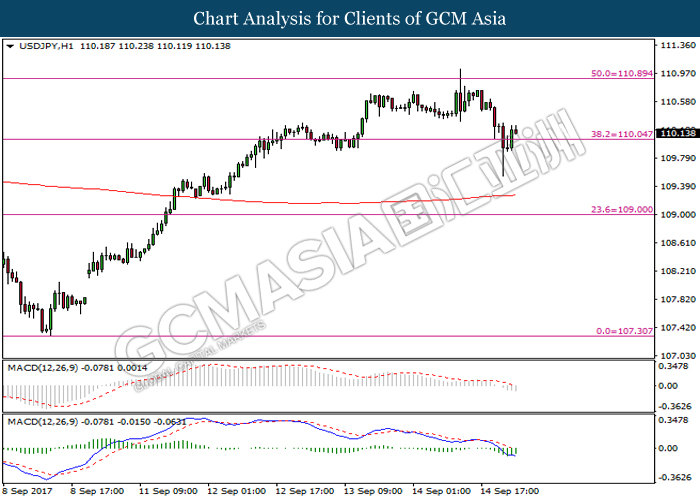
USDJPY, H1: USDJPY was traded higher prior its rebound from support level at 110.05. Formation of pin bar suggests the pair to move higher as a technical correction towards the resistance level at 110.90.
Resistance level: 110.90, 111.75
Support level: 110.05, 109.00
CrudeOIL
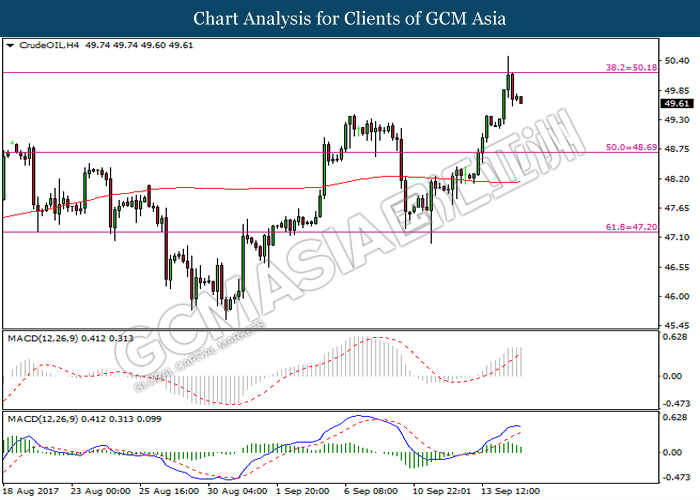
Crude OIL, H4: Price of crude oil was traded lower prior its retracement from resistance level at 50.20. Formation of engulfing candlestick and downward slope of MACD histogram suggest the crude oil to extend its losses toward support level at 48.70.
Resistance level: 50.20, 52.00
Support level: 48.70, 47.20
GOLD
GOLD, H4: Gold price was traded higher after breaking above resistance level at 1328.20. Formation of positive divergence as shown by MACD histogram suggests gold price to extend its gain toward the next resistance level at 1339.55.
Resistance level: 1339.55, 1357.40
Support level: 1328.20, 1321.35
140917 Daily Analysis
U.S Data Shows Positive Gains, Gold Market Loses Focus.
The U.S. dollar index surging up against a basket of major currencies to 92.39, a rise of 0.54%. The rose of the dollar shrugged off downbeat economic data reflecting wholesale inflation undershot expectations ahead of consumer inflation data. According to the Labor Department, the Producer Price Index (PPI) increased by 2.4% in the month of August, even better than 1.9% increase in the month of July. The downbeat wholesale inflation data did not fail market’s expectation for Federal Reserve’s plan to hike rates, following a gain in U.S. treasury yields. However, a close monitor toward the slowdown in inflation was undertaken as such scenario could hinder Fed’s plan to increase rates for the third time this year. On the other hand, Pound Sterling fell to $1.3196 from its one-year highs against the greenback, with a total decline of 0.65% following sluggish wage growth as released by the latest UK labour market data.
On the part of commodity market, crude oil prices settled higher after increasing by 2.2% to $49.30 per barrel,buoyed by higher global oil demand as estimated by International Energy Agency. Otherwise, gold prices further its losses by 0.31% to $1328.56 per troy ounce following a lack of demand toward the safe asset amid an ease of geopolitical uncertainty.
Today’s Holiday Market Close
Time Market Event
N/A
Today’s Highlight Events
Time Market Event
15:30 CHF SNB Monetary Policy Assessment
19:00 GBP BoE MPC Meeting Minutes
Today’s Highlight Economy Data
| Time | Nation & Data | Previous | Forecast | Actual |
| 9:30 | AUD – Employment Change (Aug) | 29.2K | 15.0K | 54.2K |
| 10:00 | CNY – Industrial Production (YoY) (Aug) | 6.4% | 6.6% | 6.0% |
| 15:30 | CHF – SNB Interest Rate Decision | -0.75% | -0.75% | – |
| 19:00 | GBP – BoE Interest Rate Decision (Sep) | 0.25% | 0.25% | – |
| 20:30 | USD – Initial Jobless Claims | 298K | 300K | – |
| 20:30 | USD – Core CPI (MoM) (Aug) | 0.1% | 0.2% | – |
| 20:30 | CAD – New Housing Price Index (MoM) (Jul) | 0.2% | 0.3% | – |
GBPUSD
GBPUSD, H4: GBPUSD was traded higher prior its recent rebound from support level at 1.3195. The pair is currently testing the said support level and if breakout is successful, GBPUSD will continue its momentum to trade lower, testing the next support level at 1.3115.
Resistance level: 1.3325, 1.3455
Support level: 1.3195, 1.3115
EURUSD
EURUSD, H4: EURUSD was traded lower after breaking support level at 1.1910. Downward slope of MACD signal line suggests the pair to further its losses toward support level by 200-MA line and support level at 1.1820.
Resistance level: 1.1910, 1.2070
Support level: 1.1820, 1.1715
USDJPY
USDJPY, Daily: USDJPY was traded higher following breakout of resistance level at 110.10. Upward slope of MACD signal line suggests the pair to continue its momentum to trade higher, testing the next resistance level at 110.95.
Resistance level: 110.95, 111.75
Support level: 109.65, 107.40
Crude OIL
Crude OIL, Daily: Crude oil price was traded higher after breaking above resistance level at 48.70 and 200-MA line. Formation of long bullish candlestick and upward slope of MACD signal line suggests crude oil price to move higher, testing the resistance level at 50.20.
Resistance level: 50.20, 52.00
Support level: 48.70, 47.20
GOLD
GOLD_, H4: Gold price was traded lower following breaking support level at 1328.20. Currently, it is testing the support level at 1321.35. Downward slope of MACD signal line suggests bias for the gold price to move lower, testing the next support level at 1299.05.
Resistance level: 1328.20, 1339.55
Support level: 1321.35, 1299.05
130917 Daily Analysis
13 September 2017 Daily Analysis
Pound Sterling Soared Up Higher, Greenback Remained Capped.
GBP/USD reached at its one-year high of 1.3279 after increasing up to 0.89%. According to the statement from the Office for National Statistics, consumer prices posted a better than economists’ outlook with an increase of 2.9% versus 2.8%. The main catalyst for the positive data was rising costs for clothing and travel, with an average clothing prices surging by 2.4% in August since last year. On the other hand, wages growth in United Kingdom achieved an increase of 2.1% per annum. The report releases before Bank of England’s (BoE) monetary policy meeting, in which interest rates are expected to maintain at its current record lows. There was also a statement by BoE with its expectation for UK inflation to achieve 3.0% by October, taking into account the massive drop in Pound Sterling since Brexit vote held in the month of June. In addition, dollar index decreased by 0.03% against a basket of major currencies to 91.89. It remain unchanged due to strong labor demand data showing job openings in July reaching to 6.2m as compared to expectations of 5.96m. However, gains in Greenback remained capped as Pound Sterling soared to a 12-month high as contributed by bullish inflation data.
For the commodity market, crude oil prices ended up higher at $48.23 per barrel with a rose of 16 cents as OPEC held a positive outlook toward boosting demand for oil market in the second half of year, thereby denting excess supplies. Otherwise, gold prices fell by 0.26% to $1330.15 per troy ounce as safe-haven demand fades following an easing of political tension between United States and North Korea.
Today’s Holiday Market Close
Time Market Event
N/A
Today’s Highlight Events
Time Market Event
14:30 CrudeOIL IEA Monthly Report
Today’s Highlight Economy Data
| Time | Nation & Data | Previous | Forecast | Actual |
| 14:00 | EUR – German CPI (MoM) (Aug) | 0.1% | 0.1% | – |
| 16:30 | GBP – Average Earnings Index + Bonus (Jul) | 2.1% | 2.3% | – |
| 16:30 | GBP – Claimant Count Change (Aug) | -4.2K | 0.6K | – |
| 17:00 | EUR – Industrial Production (MoM) (Jul) | -0.6% | 0.1% | – |
| 20:30 | USD – PPI (MoM) (Aug) | -0.1% | 0.3% | – |
| 22:30 | CrudeOIL – Crude Oil Inventories | 4.580M | – | – |
EURUSD
EURUSD, H4: EURUSD was traded higher following its rebound from support level at 1.1920. Formation of rising sun candlestick pattern and upward slope of MACD histogram suggests EURUSD to continue its momentum to trade higher, testing resistance level at 1.2070.
Resistance level: 1.2070, 1.2270
Support level: 1.1920, 1.1830
GBPUSD
GBPUSD, H4: GBPUSD was traded higher following its rebound from support level at 1.3160. Upward slope of MACD signal line suggests the pair to trade higher toward the next resistance level at 1.3390.
Resistance level: 1.3390, 1.3720
Support level: 1.3160, 1.3060
USDJPY
USDJPY, H4: USDJPY was traded higher prior breaking resistance level at 110.10. Downward slope of MACD histogram suggests the pair to undergo technical correction to trade lower toward the support level at 110.10 before continuing its bullish momentum.
Resistance level: 110.95, 111.75
Support level: 110.10, 109.05
CrudeOIL
Crude OIL, H1: Crude oil price was traded lower after retracing from resistance level at 48.40. Cross-over of MACD signal line suggests crude oil price to reduce further, testing the support level at 48.00.
Resistance level: 48.40, 49.35
Support level: 48.00, 47.25
GOLD
GOLD_, H4: Gold price was traded higher after breaking resistance level at 1328.20. Upward slope of MACD histogram suggests gold price to extend its gain toward the next resistance level at 1339.55.
Resistance level: 1339.55, 1357.40
Support level: 1328.20, 1321.35
120917 Daily Analysis
12 September 2017 Daily Analysis
Geopolitical Uncertainty Eased, Dollar Regains Its Strength.
Dollar index was traded stronger against a basket of major currencies to 91.92, with an increase of 0.67%. The increase of dollar index was significantly due to an ease of investors’ fear toward geopolitical uncertainty when there was no nuclear test conducted by North Korea. Meanwhile, a downgrade of Hurricane Irma further relieved investors for potential damage to the greenback, as an estimation is made that the damage from Irma may up to around $100 billion. Joel Myers, a founder, president and chairman of AccuWeather, stated in his statement that the damage as estimated from Irma can be about $100 billion, costing to 0.5 % of $19 trillion GDP. Besides that, EUR/USD was traded at 1.1950, down 0.02%, while USD/JPY was traded at 109.34 after a fall of 0.06%.
On the other hand, the price of crude oil was down by 3 cents at $48.04 per barrel. The dip of crude oil was due to undergoing assessment by traders toward the potential impact by Hurricane Irma. Likewise, gold prices dropped by 1.16% to 1325.60 per troy ounce as caused by paring of losses by the Greenback from its steepest weekly drop in two months.
Today’s Holiday Market Close
Time Market Event
N/A
Today’s Highlight Events
Time Market Event
Tentative USD OPEC Monthly Report
Today’s Highlight Economy Data
| Time | Nation & Data | Previous | Forecast | Actual |
| 09:30 | AUD – NAB Business Confidence (Aug) | 12 | – | 5 |
| 16:30 | GBP – CPI (YoY) (Aug) | 2.6% | 2.8% | – |
| 22:00 | USD – JOLTs Job Openings (Jul) | 6.163M | 5.960M | – |
GBPUSD
GBPUSD, H4: GBPUSD was traded higher after breaking support level at 1.3145. However, formation of bearish engulfing candlestick and cross-over of MACD signal line suggests the pair to trade lower toward support level at 1.3145.
Resistance level: 1.3265, 1.3475
Support level: 1.3145, 1.3020
EURUSD
EURUSD, H4: EURUSD was traded lower prior its retracement from resistance level at 1.2075. Downward slope of MACD signal line suggests the pair to continue its losses toward the support level at 1.1910.
Resistance level: 1.2075, 1.2240
Support level: 1.1910, 1.1830
USDJPY
USDJPY, Daily: USDJPY was traded higher after breaking resistance level at 108.20. The pair is currently testing the resistance level at 109.45. Formation of bullish engulfing candlestick and positive divergence as shown by MACD histogram give an indication for the pair to be on bias to continue trading upward after breaking resistance level at 109.45.
Resistance level: 109.45, 111.55
Support level: 108.20, 107.35
CrudeOIL
Crude OIL, H4: Crude oil was traded higher after breaking resistance level at 48.00. Upward slope of MACD histogram suggests crude oil to continue its gains toward resistance by 200-MA and resistance level at 48.40.
Resistance level: 48.40, 49.35
Support level: 48.00, 47.25
GOLD
GOLD_, H4: Gold was traded lower after breaking support level at 1328.45. Downward slope of MACD signal line suggests gold price to extend its losses toward the support level at 1321.15.
Resistance level: 1328.45, 1344.05
Support level: 1321.15, 1295.35
110917 Weekly Analysis
11 September 2017 Weekly Analysis
GCMAsia Weekly Report: September 11 – 15
Market Review (Forex): September 4 – 8
U.S. Dollar
US dollar slumped to fresh two-and-a-half-year low against other major currencies on Friday amid growing doubts over Federal Reserve ability to raise interest rates by year end. The dollar index depreciates by 0.20% to 91.31 during late Friday trading after touching a trough of 90.99 earlier. For the week, the index has pared its gains by 1.55%, notching its largest decline since late June.
Overall prospect towards the US dollar were further catalyzed following heightened geopolitical tension with North Korea and recent chain of hurricanes in the southeastern area of US. Likewise, market concern over the political turmoil in Washington has further contributed to the overall pessimism that surrounds the currency.
USD/JPY
Against the Japanese Yen, USD/JPY tumbled to a 10-months low of 107.32 before consolidating to 107.81 in a late Friday trading.
EUR/USD
Pair of EUR/USD extended gains by 0.12% while last seen around $1.2036. The demand for the single currency was further underpinned after European Central Bank President Mario Draghi indicated that they may start tapering its massive stimulus program in autumn this year.
GBP/USD
Pound sterling rose to a five-weeks high of $1.3195 against the US dollar, underpinned by better-than-expected UK manufacturing output growth for the month of July.
Market Review (Commodities): September 4 – 8
GOLD
Gold prices rose to its highest level in a year as the US dollar continued to remain under pressure by dampened prospect for another rate hike within this year. Price of the yellow metal ended the week with 0.15% higher at $1,352.28 while notching its third consecutive weekly gain of 1.56%. Additionally, overall demand for the safe-haven asset was further catalyzed following rising tension between United States and North Korea due to recent nuclear tests in Pyongyang. Market participants would flock to safe haven assets in the event of high risk factors in order to safe guard their capital.
Crude Oil
Crude oil price extended its losses during late Friday trading due to ongoing concern of reduced domestic crude demand as US refinery saw a slow recovery from Hurricane Harvey. Furthermore, its prices remained at the downside bias over the potential impact of Hurricane Irma as it approaches the United States mainland. Its prices sank around $1.61 or 3.3% while ended the week at $47.48 a barrel. Although the instrument has recorded its biggest daily loss since July, its prices however still ended the week with 19 cents or 0.14% of gains.
Over a quarter of US oil refinery hubs were forced to close as hurricane Harvey hits the region along the Gulf Coast. Recent sluggish restart following the incident has contributed to a lower domestic demand for crude oil, which is reflected in a weekly reported released by the US Energy Information Administration. According to EIA, crude inventories rose by roughly 4.6 million barrels last week, exceeding economist consensus for a rise of 4 million barrels.
Likewise, Harvey’s impact was also felt in oil production as oilfield services provider Baker Hughes reported a decline in oil rigs by 3 to a total of 756. However, most analyst postulate that the slowdown in refinery and output would only linger for short-term and should recover sooner than later.
US Crude Oil Stock Change
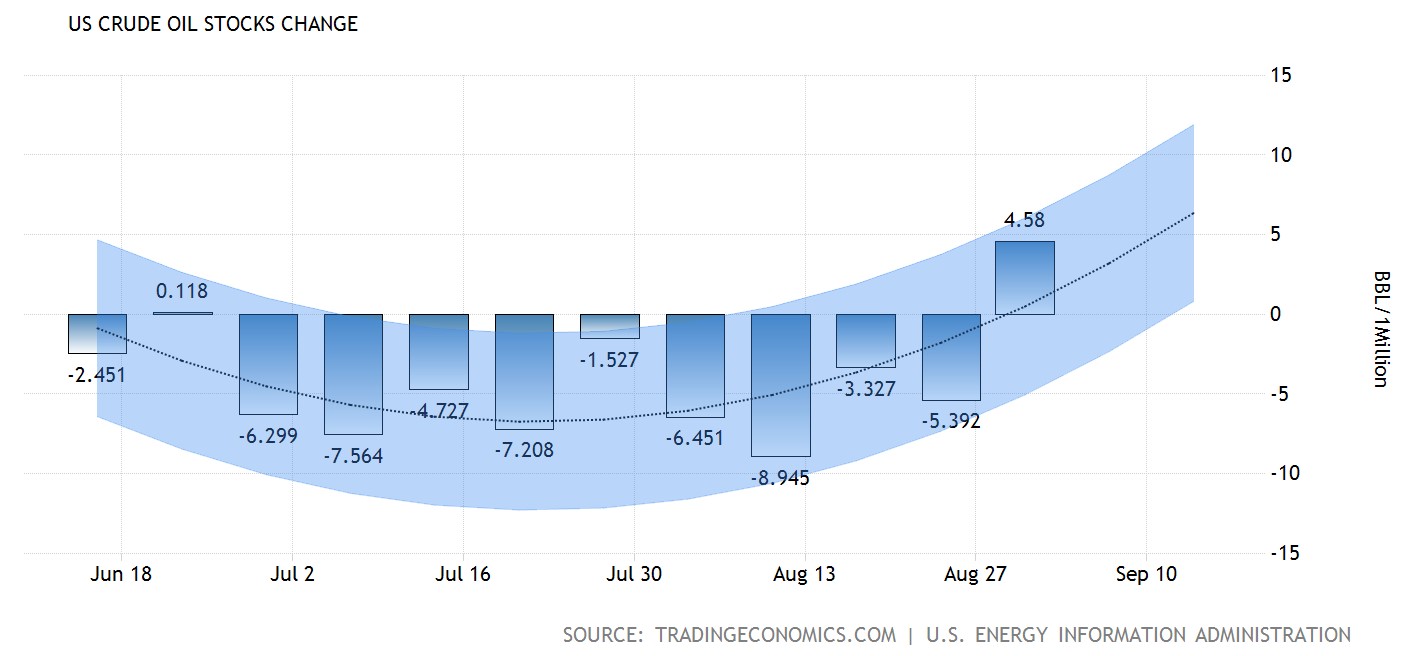
—– Forecast
US crude oil stock rose for the first time in 10 weeks with an unexpected build of 4.58 million barrels.
U.S. Baker Hughes Oil Rig Count

Active drilling rigs in the United States was down by 3 and the total count is currently at 756.
Weekly Outlook: September 11 – 15
For the week ahead, investors will be eyeing on Thursday’s US inflation report for further signals regarding the possible timing of US interest rate hike. Likewise, UK monetary policy announcement by the Bank of England will also remained in focus.
As for oil traders, they will place their attention on monthly reports from Organization of the Petroleum Exporting Countries and International Energy Agency to assess global oil supply and demand levels. These reports could give a better picture to investors regarding global oil rebalancing effort which has taken place since early of the year.
Highlighted economy data and events for the week: September 11 – 15
| Monday, September 11 |
Data JPY – Tertiary Industry Activity Index (MoM) CAD – Housing Starts (Aug)
Events N/A
|
| Tuesday, September 12 |
Data AUD – NAB Business Confidence (Aug) GBP – CPI (YoY) (Aug) USD – JOLTs Job Openings (Jul)
Events CrudeOIL – OPEC Monthly Report
|
| Wednesday, September 13 |
Data CrudeOIL – API Weekly Crude Oil Stock EUR – German CPI (MoM) (Aug) GBP – Average Earnings Index +Bonus (Jul) GBP – Claimant Count Change (Aug) EUR – Industrial Production (MoM) (Jul) USD – PPI (MoM) (Aug) CrudeOIL – Crude Oil Inventories
Events CrudeOIL – IEA Monthly Report
|
| Thursday, September 14 |
Data AUD – Employment Change (Aug) CNY – Industrial Production (YoY) (Aug) CHF – SNB Interest Rate Decision GBP – BoE Interest Rate Decision (Sep) USD – Initial Jobless Claims USD – Core CPI (MoM) (Aug) CAD – New Housing Price Index (MoM) (Jul)
Events CHF – SNB Monetary Policy Assessment GBP – BoE MPC Meeting Minutes
|
|
Friday, September 15
|
Data USD – Core Retail Sales (MoM) (Aug) USD – NY Empire State Manufacturing Index (Sep) USD – Retail Sales (MoM) (Aug) USD – Industrial Production (MoM) (Aug) USD – Michigan Consumer Sentiment (Sep) CrudeOIL – US Baker Hughes Oil Rig Count
Events N/A
|
Technical weekly outlook: September 11 – 15
Dollar Index
DOLLAR_INDX, Daily: The dollar index extended its losses within the downward channel following prior closure below 92.00. Recent rebound from the support level of 91.00 suggests short-term upside bias to retest at the threshold of 92.00. Otherwise, long-term trend direction remains skewed towards the downside.
Resistance level: 92.00, 93.00
Support level: 91.00, 90.00
GBPUSD
GBPUSD, Daily: GBPUSD remains traded within an upward channel following prior rebound near the bottom level of the channel. Both MA lines which continues to narrow upwards suggests GBPUSD to extend its gains towards the next target at 1.3265.
Resistance level: 1.3265, 1.3450
Support level: 1.3110, 1.2965
USDJPY
USDJPY, Daily: USDJPY was traded higher following prior rebound near the support level of 107.75. Recent price action suggests USDJPY to be traded higher in short-term as technical correction. Otherwise, long-term trend direction skew towards the downside bias as both MA lines continues to expand downwards.
Resistance level: 109.40, 110.50
Support level: 108.20, 107.15
EURUSD
EURUSD, Weekly: EURUSD extended its uptrend following prior closure above the resistance level of 1.1915. MACD indicator which continues to illustrate increasing upward momentum suggests EURUSD to advance further up and retest near previous high of 1.2100.
Resistance level: 1.2100, 1.2340
Support level: 1.1910, 1.1610
GOLD
GOLD_, Daily: Gold price opened with a gap following prior retracement from the resistance level of 1350.00. MACD histogram which illustrate diminishing upward momentum suggests gold price to be traded lower in short-term as technical correction. First target will be referring to 1320.80.
Resistance level: 1350.00, 1374.75
Support level: 1320.80, 1305.00
Crude Oil
CrudeOIL, Daily: Crude oil price remains traded within a narrowing triangle while recently rebounded near the 60-MA line (green). A closure above the 20-MA line (red) would suggests crude oil price to advance further up, towards the next target at 48.50.
Resistance level: 48.50, 50.20
Support level: 47.00, 45.50
080917 Daily Analysis
8 September 2017 Daily Analysis
Dollar below 92, ECB might taper soon?
US dollar wilts against other major currencies on Friday amid refreshed demand for the single common currency – Euro. As of writing, the dollar index extended its losses by 0.21% to 91.35. Broad selling pressure were initiated across the board following the release of downbeat US jobless claims data and hawkish remarks given by European Central Bank President Mario Draghi. In the US front, jobless claims for last week rose more than expected to 298,000, exceeding consensus forecast of 241,000. Such data spurs further concern over the recent slack in the US labor market. On the other hand, euro rose to two-weeks high against the greenback on yesterday following President Draghi’s remark to announce a decision on the future of QE program this coming October. Although he cited such action were due to robust growth in the EU zone, he too cautioned on the recent volatility in euro which may affect near-term outlook on inflationary pressure. Likewise, pair of EUR/USD was up 0.09% to $1.2035 during Asian trading hours.
In the commodities market, crude oil price trims its losses by 0.08% to $49.13 while remained overshadowed by a larger-than-expected build in US crude oil stocks. Otherwise, gold price rose 0.33% to a one-year high of $1,349.58 over the backdrop of a weaker dollar.
Today’s Holiday Market Close
Time Market Event
N/A
Today’s Highlight Events
Time Market Event
20:45 USD FOMC Member Harker Speaks
Today’s Highlight Economy Data
| Time | Nation & Data | Previous | Forecast | Actual |
| 07:50 | JPY – GDP (QoQ) (Q2) | 1.0% | 0.7% | 0.6% |
| Tentative | CNY – Trade Balance (USD) (Aug) | 46.73B | 48.60B | – |
| 16:30 | GBP – Manufacturing Production (MoM) (Jul) | 0.0% | 0.3% | – |
| 20:30 | CAD – Employment Change (Aug) | 10.9K | 19.0K | – |
| 01:00 | CrudeOIL – US Baker Hughes Oil Rig Count | 759 | – | – |
GBPUSD
GBPUSD, H4: GBPUSD extended gains following prior closure above the resistance level of 1.3075. Both MA lines which continues to expand upwards suggests further upside bias for GBPUSD to advance towards the resistance level of 1.3160.
Resistance level: 1.3160, 1.3210
Support level: 1.3075, 1.3020
EURUSD
EURUSD, H4: EURUSD extended its uptrend following prior closure above the resistance level of 1.1970. MACD histogram which continues to illustrate upward signal suggests EURUSD to advance further up, towards the target of 1.2070.
Resistance level: 1.2070, 1.2130
Support level: 1.1970, 1.1915
USDJPY
USDJPY, H4: USDJPY remains traded within a downward channel while currently testing at the bottom level. MACD histogram which illustrate negative divergence suggests possibility to occur a breakout at this level and signal a change in trend direction to move further downwards.
Resistance level: 109.00, 109.70
Support level: 108.25, 107.50
CrudeOIL
CrudeOIL, H4: Crude oil price was traded higher following prior rebound from the support level of 48.55. Both MA lines which continues to expand upwards suggests its prices to move further up and retest at the resistance level of 49.35.
Resistance level: 49.35, 49.95
Support level: 48.55, 48.00
GOLD
GOLD_, Daily: Gold price extended its prior uptrend while currently testing at the resistance level of 1350.00. A successful closure above this level would suggests further upside bias for gold price to extend towards the subsequent target of 1374.75.
Resistance level: 1350.00, 1374.75
Support level: 1320.80, 1305.00
070917 Daily Analysis
7 September 2017 Daily Analysis
CAD gone crazy, EUR anticipates ECB!
US dollar tumbled sharply against the Canadian counterpart on yesterday following a surprise move from the Bank of Canada (BoC) by raising their benchmark rates. As of writing, pair of USD/CAD ticks up 0.08% to $1.2236, not far from two years trough of $1.2139. In their latest monetary policy meeting, BoC decided to raise interest rates by 25 basis points to 1% after a hike in July, citing upbeat economic growth as the main factor for their verdict. “The move by BoC has taken off the chances for a rate hike in October. Main market focus will shift towards December’s meeting while optimistic economic conditions will be needed to justify such action,” postulate analyst from Wells Fargo. In the other region, pair of EUR/USD rose 0.05% to $1.1923 while current upside bias remained limited as market participants shift their focus towards the highly anticipated European Central Bank policy decision later in the day. The single common currency remained well bid amid increasing speculation that ECB may announce plans to taper their QE programs as EU zone economic performance regains its momentum.
Otherwise, crude oil price eased by 0.06% to $49.13 with limited downside as American Petroleum Institute reported a lesser-than-expected crude oil build of 2.79 million barrels. Similarly, gold price recorded a loss of 0.05% to $1,333.28 following President Donald Trump’s plan to pass an extension of US debt limit and raise the debt ceiling.
Today’s Holiday Market Close
Time Market Event
N/A
Today’s Highlight Events
Time Market Event
20:30 EUR ECB Press Conference
00:15 USD FOMC Member Mester Speaks
Today’s Highlight Economy Data
| Time | Nation & Data | Previous | Forecast | Actual |
| 09:30 | AUD – Retail Sales (MoM) (Jul) | 0.3% | 0.3% | – |
| 14:00 | EUR – German Industrial Production (MoM) (Jul) | -1.1% | 0.6% | – |
| 15:30 | GBP – Halifax House Price Index (MoM) (Aug) | 0.4% | 0.2% | – |
| 19:45 | EUR – Deposit Facility Rate | -0.40% | -0.40% | – |
| 19:45 | EUR – ECB Interest Rate Decision (Sep) | 0.00% | 0.00% | – |
| 20:30 | USD – Initial Jobless Claims | 236K | 241K | – |
| 22:00 | CAD – Ivey PMI (Aug) | 60.0 | 61.3 | – |
| 23:00 | CrudeOIL – Crude Oil Inventories | -5.392M | 4.022M | – |
GBPUSD
GBPUSD, H4: GBPUSD was traded lower following a retracement from the resistance level of 1.3075. MACD histogram which shows diminishing upward momentum suggests GBPUSD to be traded lower in short-term as technical correction. Next target at 1.3020.
Resistance level: 1.3075, 1.3160
Support level: 1.3020, 1.2960
EURUSD
EURUSD, H4: EURUSD remains traded in an uptrend following prior rebound near the support level of 1.1915. MACD indicator which shows substantial upward signal suggests further upside bias for EURUSD to advance towards the next target at 1.1970.
Resistance level: 1.1970, 1.2070
Support level: 1.1915, 1.1865
USDCAD
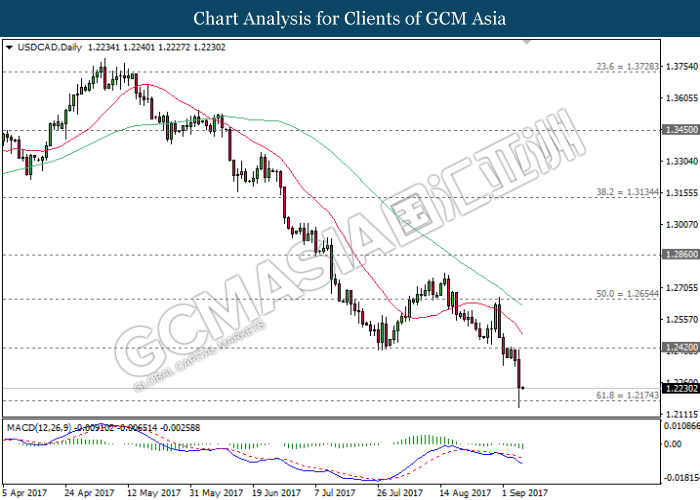
USDCAD, Daily: USDCAD was traded lower following prior retracement from the resistance level of 1.2420. MACD histogram which illustrate negative divergence suggests USDCAD to extend its losses towards the next target at 1.2175.
Resistance level: 1.2420, 1.2655
Support level: 1.2175, 1.1940
USDJPY
USDJPY, H4: USDJPY remains traded within a downward channel while recently retraced from the 20-MA line (red). Both lines which has formed a death cross formation suggests further downside bias to extend its losses after closing below the support level of 109.00.
Resistance level: 109.70, 110.65
Support level: 109.00, 108.25
CrudeOIL
CrudeOIL, H1: Crude oil price were traded lower following a retrace from the resistance level at 49.35. MACD histogram which shows substantial downward signal suggests its price to extend further down after successfully closing below the 20-MA line (red).
Resistance level: 49.35, 49.95
Support level: 48.55, 48.00
GOLD
GOLD_, H4: Gold price was offered lower following a retracement from the resistance level of 1340.00. Recent closure below the 20-MA line (red) suggests further downside bias for gold price to advance towards the support level of 1330.00.
Resistance level: 1340.00, 1348.00
Support level: 1330.00, 1321.00
060917 Daily Analysis
6 September 2017 Daily Analysis
Rate hike questioned, Greenback threatened.
Greenback wobbles near prior one-and-a-half-year low during Asian trading hours on Wednesday as market participants ponder upon the likelihood for another rate hike within the year. The dollar index ticks up 0.01% while last quoted around 92.20. Overnight, US dollar remained subdued against its peers as rising tension between United States and North Korea provides continuous support for the demand of safe haven currencies. In addition, further pessimism around the currency were spurred after several Fed officials suggests to take cautious approach in monetary policy tightening following muted inflationary pressure and a slack in the labor market pace. Referring to the Fed Rate Monitor Tool, investors are currently pricing in at only 31% chance for a rate hike during FOMC December policy meeting. Against other major currencies, EUR/USD rose 0.08% to $1.1923 while USD/JPY sheds 0.16% to 108.64.
In the commodities section, crude oil price depreciates by 0.23% to $48.55 as crude demand may remain subdued due to recent closure of refinery hubs following Hurricane Harvey. Market focus was also drawn to Hurricane Irma which is approaching important shipping lanes in the Caribbean. On the other hand, gold price stabilizes near one-year high at $1,339.20 as North Korea may conduct further test on its founding anniversary of September 9th.
Today’s Holiday Market Close
Time Market Event
N/A
Today’s Highlight Events
Time Market Event
22:00 CAD BoC Rate Statement
Today’s Highlight Economy Data
| Time | Nation & Data | Previous | Forecast | Actual |
| 09:30 | AUD – GDP (QoQ) (Q2) | 0.3% | 0.9% | 0.8% |
| 14:00 | EUR – German Factory Orders (MoM) (Jul) | 1.0% | 0.3% | – |
| 22:00 | USD – ISM Non-Manufacturing PMI (Aug) | 53.9 | 55.4 | – |
| 22:00 | CAD – BoC Interest Rate Decision | 0.75% | 0.75% | – |
| 04:30 | CrudeOIL – API Weekly Crude Oil Stock | -5.780M | – | – |
GBPUSD
GBPUSD, H4: GBPUSD extended gains following prior rebound from trendline while closing above 20-MA line (red). MACD indicator which shows increasing upward momentum suggests GBPUSD to advance further up, towards the next target at 1.3075.
Resistance level: 1.3075, 1.3160
Support level: 1.3020, 1.2960
EURUSD
EURUSD, H1: EURUSD remains traded within an ascending triangle following prior retrace from the strong resistance level of 1.1925. Stochastic Oscillator which begins to illustrate a retracement signal suggests EURUSD to be traded lower in short-term, towards the lower level of the triangle.
Resistance level: 1.1925, 1.1950, 1.1980
Support level: 1.1885, 1.1855
USDJPY
USDJPY, H4: USDJPY was traded within a downward channel while recently closed below the psychological level of 109.00. Both MA lines which continues to narrow downwards suggests USDJPY to extend its losses towards the target of support level at 108.25.
Resistance level: 109.00, 109.70
Support level: 108.25, 107.50
CrudeOIL
CrudeOIL, H4: Crude oil price was traded lower following prior retracement while currently testing at the support level of 48.55. Both MA lines which continues to expand upwards after the formation of golden cross suggests further upside bias for its prices to extend towards the target of 49.35.
Resistance level: 49.35, 50.40
Support level: 48.55, 48.00
GOLD
GOLD_, Daily: Gold price was traded higher following previous closure above the resistance level of 1320.80. Both MA lines which continues to expand upwards suggests further upside bias for gold price towards the next target at 1350.00.
Resistance level: 1350.00, 1374.75
Support level: 1320.80, 1305.00
050917 Daily Analysis
5 September 2017 Daily Analysis
Market uneased as North Korea on the edge.
US dollar remained subdued against other major peers on Tuesday with investors keeping an eye out on further political risk escalation between the United States and North Korea. The dollar index eased 0.01% and last seen around 92.63. Last Friday, greenback received broad selling pressure due to a disappointing US employment report which continued to weigh on the prospect for a third interest rate hike by year end. Likewise, overall market sentiment towards the currency were further dampened after North Korea announced on Sunday that they had conducted a hydrogen bomb test which is intended to be mounted on an intercontinental ballistic missile (ICBM). Such provocation has led to higher risk aversion among investors while increasing the demand for safe haven currencies such as Japanese Yen and Swiss Franc. For the week, market participants will be focusing on Thursday’s European Central Bank meeting for new clues with regards to ultra-loose policy tapering and US report on service sector growth.
In the commodities market, crude oil price rose 0.21% to $47.39 as refinery activity along the US Gulf Coast slowly resumed its operation after being hit by tropical storm Harvey. Similarly, gold price appreciates by 0.64% to $1,333.03 following heightened risk at the Korean Peninsula.
Today’s Holiday Market Close
Time Market Event
N/A
Today’s Highlight Events
Time Market Event
12:30 AUD RBA Rate Statement
20:00 USD FOMC Member Brainard Speaks
01:10 USD FOMC Member Kashkari Speaks
Today’s Highlight Economy Data
| Time | Nation & Data | Previous | Forecast | Actual |
| 09:45 | CNY – Caixin Services PMI (Aug) | 51.5 | 51.8 | 52.7 |
| 12:30 | AUD – RBA Interest Rate Decision (Sep) | 1.50% | 1.50% | – |
| 13:45 | CHF – GDP (QoQ) (Q2) | 0.3% | 0.5% | – |
| 15:15 | CHF – CPI (MoM) (Aug) | -0.3% | 0.0% | – |
| 15:55 | EUR – German Services PMI (Aug) | 53.4 | 53.4 | – |
| 16:00 | EUR – Services PMI (Aug) | 54.9 | 54.9 | – |
| 16:30 | GBP – Services PMI (Aug) | 53.8 | 53.5 | – |
| 17:00 | EUR – Retail Sales (MoM) (Jul) | 0.5% | -0.2% | – |
| 22:00 | USD – Factory Orders (MoM) (Jul) | 3.0% | -3.2% | – |
GBPUSD
GBPUSD, H4: GBPUSD was traded lower following prior retracement while recently closed below the 20-MA line (red). MACD indicator which illustrate diminishing upward momentum suggests further downside bias towards the next target at 1.2890.
Resistance level: 1.2960, 1.3020
Support level: 1.2890, 1.2830
EURUSD
EURUSD, H4: EURUSD was traded in an uptrend while currently testing near the 20-MA line (red). MACD indicator which illustrate diminishing downward momentum suggests EURUSD to be traded higher after successfully closing above the resistance level of 1.1910.
Resistance level: 1.1910, 1.1970
Support level: 1.1865, 1.1815
USDJPY
USDJPY, H1: USDJPY remained traded within a downward channel following previous retracement from the upper level. MACD histogram which begins to form a downward signal suggests USDJPY to extend its losses towards the next target at 109.15.
Resistance level: 109.45, 109.75
Support level: 109.15, 108.75
CrudeOIL
CrudeOIL, H4: Crude oil price was traded higher following prior breakout from the downward trend line. Both MA lines which continues to narrow upward suggests crude oil price to extend its upward momentum after successfully closing above the resistance level of 47.40.
Resistance level: 47.40, 48.00
Support level: 46.70, 46.15
GOLD
GOLD_, Daily: Gold price extended its rally following prior closure above the resistance level of 1320.80. Both MA lines which continues to expand upwards suggests further upside bias for gold price to advance towards the target of 1350.00.
Resistance level: 1350.00, 1374.75
Support level: 1320.80, 1305.00
300817 Daily Analysis
30 August 2017 Daily Analysis
Greenback swings over North Korea’s mayhem.
Greenback stages its rebound during early Asian trading hours on Wednesday while investors keep an eye on the Korean peninsula and major economic docket ahead. The dollar index rose 0.10% to 92.23 while USD/JPY tacked up 0.15% to 109.86. Overnight, US dollar fell to a fresh two-and-a-half-year low against six major peers following heightened geopolitical risk over North Korea’s missile launch which flew over northern Japanese territory. In spite of that, dollar-bull attempted to pare some losses over the backdrop of optimistic consumer confidence report. According to the Conference Board, Consumer Confidence Index rose to 122.9 in August, exceeding consensus forecast for a rise of 120.3. Nevertheless, gains were remained subdued as an uptick in geopolitical concern encourages risk aversion among investors for safe-haven currencies such as Japanese yen and Swiss Franc.
In the commodities market, crude oil price depreciates by 0.30% to $46.30 due to growing concern of investors over a fall in demand as Hurricane Harvey expected to shut down 16% of refineries in Texas. Similarly, gold price sheds 0.29% to $1,309.28 while remained supported as geopolitical risk continues to linger.
Today’s Holiday Market Close
Time Market Event
N/A
Today’s Highlight Events
Time Market Event
09:30 NZD RBNZ Gov Wheeler Speaks
21:15 USD FOMC Member Powell Speaks
Today’s Highlight Economy Data
| Time | Nation & Data | Previous | Forecast | Actual |
| 09:30 | AUD – Building Approvals (MoM) (Jul) | 10.9% | -5.0% | -1.7% |
| 09:30 | AUD – Construction Work Done (QoQ) (Q2) | 0.9% | 1.0% | 9.3% |
| 16:30 | GBP – Net Lending to Individuals | 5.6B | 5.3B | – |
| 20:00 | EUR – German CPI (MoM) (Aug) | 0.4% | 0.1% | – |
| 20:15 | USD – ADP Nonfarm Employment Change (Aug) | 178K | 185K | – |
| 20:30 | USD – GDP (QoQ) (Q2) | 2.6% | 2.7% | – |
| 22:30 | CrudeOIL – Crude Oil Inventories | -3.327M | -1.908M | – |
GBPUSD
GBPUSD, H4: GBPUSD was traded lower following prior retracement from the resistance level of 1.2960. MACD indicator which illustrate diminishing upward momentum suggests GBPUSD to extend its losses, towards the target of support level at 1.2890.
Resistance level: 1.2960, 1.3020
Support level: 1.2890, 1.2830
EURUSD
EURUSD, Daily: EURUSD extended its gains following prior closure above the resistance level of 1.1880. MACD histogram which continues to illustrate positive divergence suggests EURUSD to advance further up and retest at the psychological level of 1.2000.
Resistance level: 1.2000, 1.2150
Support level: 1.1880, 1.1700
USDJPY
USDJPY, H4: USDJPY was traded higher following a sharp rebound from the support level of 108.25. Both MA line which begins to narrow upwards suggests USDJPY to extend its upward momentum after successfully closing above the resistance level of 109.90.
Resistance level: 109.90, 110.35
Support level: 109.60, 109.30
CrudeOIL
CrudeOIL, Daily: Crude oil price extended its losses following prior closure below the 60-MA line (green). Both MA lines which begins to narrow downwards suggests further downside bias for its prices to advance towards the support level of 45.50.
Resistance level: 47.00, 48.50
Support level: 45.50, 43.80
GOLD
GOLD_, H4: Gold price was traded higher following a rebound near the support level of 1308.25. Both MA lines which continues to expand upwards suggests gold price to extend its gains, towards the target of resistance level at 1316.30.
Resistance level: 1316.30, 1325.80
Support level: 1308.75, 1297.40
290817 Daily Analysis
29 August 2017 Daily Analysis
Safe-haven in demand as North Korea fires missile.
US dollar slumped to a four-months low against the Japanese yen on Tuesday after North Korea fired a missile which flew across the Japanese territory, in a latest act of provocation by Pyongyang. According to Japanese and South Korea government, North Korea fired a missile earlier today near Pyongyang which flew over northern Japan territory of Hokkaido. Such moves came as tensions in between North Korea and United States subsides after several weeks of threat hurling. Consequently, the dollar index was down 0.32% to 92.17 while USD/JPY depreciate by 0.76% to 108.42. In the other region, euro surged to a two-and-a-half-year high at $1.1985 amid speculation over the possibility of European Central Bank tapering its quantitative easing program at its September policy meeting next week. ECB President Mario Draghi which did not attempt to curb euro’s rise during his speech at Jackson Hole suggested that he is less concerned with the recent surge in euro.
Otherwise, crude oil price pared some losses by 0.43% to $46.77 a barrel. Earlier, the commodity suffered from a broad sell-off as Tropical Storm Harvey continued to disrupt refinery activities along US Gulf Coast which could lead to an uptick in crude supplies. On the other hand, gold price surged 0.58% to $1,317.26 as geopolitical tension in the Korean peninsula arises.
Today’s Holiday Market Close
Time Market Event
N/A
Today’s Highlight Events
Time Market Event
N/A
Today’s Highlight Economy Data
| Time | Nation & Data | Previous | Forecast | Actual |
| 07:30 | JPY – Household Spending (MoM) (Jul) | 1.5% | -0.5% | -1.9% |
| 20:30 | CAD – RMPI (MoM) (Jul) | -3.7% | -2.5% | – |
| 22:00 | USD – CB Consumer Confidence (Aug) | 121.1 | 120.3 | – |
| 04:30 | CrudeOIL – API Weekly Crude Oil Stock | -3.595M | – | – |
GBPUSD
GBPUSD, H4: GBPUSD was traded higher following a rebound from the support level of 1.2890. MACD indicator which illustrate increasing upward momentum suggests GBPUSD to advance further up, towards the resistance level of 1.2960.
Resistance level: 1.2960, 1.3020
Support level: 1.2890, 1.2830
EURUSD
EURUSD, Daily: EURUSD extended gains following prior closure above the resistance level of 1.1880. MACD histogram which illustrates positive divergence signal suggests EURUSD to continue its upward momentum after closing above the psychological level of 1.2000.
Resistance level: 1.2000, 1.2150
Support level: 1.1880, 1.1700
USDJPY
USDJPY, H4: USDJPY was traded lower following prior closure below the strong support level of 108.90. MACD histogram which begins to illustrate substantial negative divergence suggests USDJPY to move further down, towards the target of 108.30.
Resistance level: 108.90, 109.50
Support level: 108.30, 107.80
CrudeOIL
CrudeOIL, H4: Crude oil price remains traded within a downward wedge following prior rebound from the support level of 46.15. Stochastic Oscillator which illustrate a rebound signal from oversold region suggests short-term upside bias for crude oil price to advance towards 47.15.
Resistance level: 47.15, 47.80
Support level: 46.65, 46.15
GOLD
GOLD_, Daily: Gold price extended gains following prior rebound from the support level of 1278.45. MACD histogram which illustrate positive divergence signal suggests gold price to move further upwards after successfully closing above the resistance level of 1320.80.
Resistance level: 1320.80, 1350.00
Support level: 1305.00, 1278.45
280817 Weekly Analysis
28 August 2017 Weekly Analysis
GCMAsia Weekly Report: August 28 – September 1
Market Review (Forex): August 21 – 25
U.S. Dollar
Greenback fell against a basket of other major peers on Friday while investors digested the speeches given by global central bankers at Jackson Hole symposium. The dollar index plunged 0.82% while hanging at 93.47 during late Friday trading. Thus far, the dollar has fallen around 10% within this year amid ongoing uncertainty that surrounds US economic agenda by President Donald Trump and doubts over the next interest rate hike by Federal Reserve.
In essence, Yellen in a speech titled “Financial Stability a Decade after the Onset of the Crisis” focused on the fact that any changes made on the financial regulation should be modest while stating that “substantial” progress was made under Fed’s mandate. The 15-page document did not touch on the future stance of monetary policy nor balance sheet normalization which has caused the downfall of greenback.
USD/JPY
Pair of USD/JPY slides down 0.17% while touching 109.36.
EUR/USD
Euro hits its highest level in two years at $1.1941 against the US dollar after skyrocketing more than 1.06% on Friday. The single common currency received a bullish push after speech by European Central Bank President Mario Draghi avoids to give any new indication on their plans to taper its economic stimulus program but acknowledging considerable recovery with the Eurozone.
GBP/USD
Sterling stacked up 0.61% to $1.2878 against the US dollar on late Friday trading.
Market Review (Commodities): August 21 – 25
GOLD
Gold price ended higher on Friday in a volatile trading session as the US dollar weakened substantially after Fed Chair Janet Yellen did not specifically address their future monetary policy stance or outlook.
Its prices settled up 0.3% while closing the week at $1,295.95 after touching a low of $1,281.30 earlier. The demand for gold increased modestly after Yellen failed to discuss the outlook of monetary policy, which in return disappoints some investors whom has been hoping for more hawkish signal.
Crude Oil
Crude oil price ended the week with gains on Friday as Hurricane Harvey threatened to disrupt production and refinery activity along the Gulf Coast. It prices added up 44 cents or 0.9% during late Friday trading while closing the week at $47.87 per barrel.
Approximately 25% of US Gulf of Mexico oil production rigs were closed due to the onset Hurricane Harvey as reported by the US department of Interior’s Bureau of Safety and Environmental Enforcement. Such closure reflects approximately 428,568 barrels of oil per day out of roughly 1.75 million bpd being produced along the Gulf Coast.
In addition, price of the black commodities received further bullish attention after oilfield services firm Baker Hughes showed a reduction in oil rigs for the second consecutive week in a row. According to its weekly rig count, the number of oil rig were reduced by 4, down to a total of 759.
However, the rise in oil prices remained limited as investors continued to ponder over the rising US shale output which has canceled out production cuts done by OPEC and non-OPEC members.
U.S. Baker Hughes Oil Rig Count
Active drilling rigs in the United States was down by 4 and the total count is currently at 759.
Weekly Outlook: August 28 – September 1
For the week ahead, investors will be focusing on the highly anticipated US jobs report for the month of August to gauge its impact on the path of Federal Reserve monetary policy. Likewise, investors will also be focusing on the revised reading of US second quarter growth and euro zone’s preliminary inflation data to further gauge the prospect of respective currencies.
As for oil traders, they will be keeping a close eye on fresh weekly information regarding US stockpiles of crude and refined products on Tuesday and Wednesday to gauge the strength of demand from the world’s largest oil consumer. Meanwhile, comments from major oil producers will be fully scrutinized for further indication on their compliance to production cut deal.
Highlighted economy data and events for the week: August 28 – September 1
| Monday, August 28 |
Data N/A
Events N/A
|
| Tuesday, August 29 |
Data JPY – Household Spending (MoM) (Jul) CAD – RMPI (MoM) (Jul) USD – CB Consumer Confidence (Aug)
Events N/A
|
| Wednesday, August 30 |
Data CrudeOIL – API Weekly Crude Oil Stock AUD – Building Approvals (MoM) (Jul) AUD – Construction Work Done (QoQ) (Q2) GBP – Net Lending to Individuals EUR – German CPI (MoM) (Aug) USD – ADP Nonfarm Employment Change (Aug) USD – GDP (QoQ) (Q2) CrudeOIL – Crude Oil Inventories
Events USD – FOMC Member Powell Speaks
|
| Thursday, August 31 |
Data CNY – Manufacturing PMI (Aug) CNY – Non-Manufacturing PMI (Aug) NZD – ANZ Business Confidence (Aug) AUD – Private New Capital Expenditure (QoQ) (Q2) EUR – German Retail Sales (MoM) (Jul) EUR – German Unemployment Change (Aug) EUR – CPI (YoY) (Aug) USD – Core PCE Price Index (MoM) (Jul) USD – Initial Jobless Claims USD – Personal Spending (MoM) (Jul) CAD – GDP (MoM) (Jun) USD – Chicago PMI (Aug) USD – Pending Home Sales (MoM) (Jul)
Events N/A
|
|
Friday, September 1
|
Data CNY – Caixin Manufacturing PMI EUR – German Manufacturing PMI GBP – Manufacturing PMI USD – Average Hourly Earnings (MoM) (Aug) USD – Nonfarm Payrolls (Aug) USD – Unemployment Rate (Aug) USD – ISM Manufacturing PMI (Aug) USD – Michigan Consumer Sentiment (Aug) CrudeOIL – Baker Hughes Oil Rig Count
Events N/A
|
Technical weekly outlook: August 28 – September 1
Dollar Index
DOLLAR_INDX, Daily: The dollar index remained traded within a downward channel while recently closed below the support level of 93.00. MACD histogram which illustrate diminishing upward signal suggests further downside bias towards the next target at 92.00.
Resistance level: 94.00, 94.95
Support level: 93.00, 92.00
GBPUSD
GBPUSD, Daily: GBPUSD was traded lower following a retracement from the 20-MA line (red). Both moving average line which continues to expand downwards after the formation of death cross suggests GBPUSD to advance further down, towards the support level of 1.2860.
Resistance level: 1.2970, 1.3100, 1.3230
Support level: 1.2860, 1.2715
USDJPY
USDJPY, Daily: USDJPY remains under pressure after both MA lines continues to expand downwards after the formation of death cross. A retracement from the resistance level of 109.40 would suggest USDJPY to extend its losses towards the strong support level near 108.80.
Resistance level: 109.40, 110.10
Support level: 108.80, 108.10
EURUSD
EURUSD, Weekly: EURUSD received further bullish momentum after closing above the resistance level of 1.1910. Both moving average line which continues to expand upwards after the formation of golden cross suggest further upside bias towards the next target at 1.2100.
Resistance level: 1.2100, 1.2340
Support level: 1.1910, 1.1610
GOLD
GOLD_, Daily: Gold price was traded higher following a successful rebound near the strong support level of 1281.10. A successful closure above the resistance level of 1295.00 would suggest further upside bias towards the next target at 1307.00.
Resistance level: 1295.00, 1307.00
Support level: 1281.10, 1270.35
Crude Oil
CrudeOIL, Daily: Crude oil price remains traded within a narrowing triangle while currently testing at the bottom level of the triangle. A successful breakout from this level would signal a change in trend direction to move further downwards while the next target would be at 47.00.
Resistance level: 48.50, 50.00
Support level: 47.00, 45.50
250817 Daily Analysis
25 August 2017 Daily Analysis
Duo bankers eyed, market remained hypnotized.
US dollar ticks higher in a quiet trade on Friday as investors anticipates a pair of speech delivered by Fed Chair and ECB President later today. The dollar index rose 0.05% and last seen around 93.17 against six major currencies. Both speeches by Federal Reserve Chair Janet Yellen and European Central Bank President Mario Draghi will be highly scrutinized as investors scavenge for hints with regards to future monetary policy stance, albeit neither of them is expected to provide new guidance. However, gains on the greenback was capped after National Association of Realtors reported that existing home sales for July fell short of consensus forecast with only 5.44 million units sold. The data was released after US Labor Department conveyed that the number of individuals who filed for unemployment benefits last week rose less than expected with only 2,000 to a seasonally adjusted total of 234,000. Against other major currencies, EUR/USD was down 0.03% to $1.1797 while USD/JPY stabilizes at 109.55.
Otherwise, crude oil price recovered its overnight losses by 0.61% to $47.72 amid fears of Hurricane Harvey which may force refinery hub in the US to shut down while reducing crude demand for the time being. Subsequently, gold price was held flat at $1,286.66 as investors anticipates further clues from Yellen and Draghi.
Today’s Holiday Market Close
Time Market Event
N/A
Today’s Highlight Events
Time Market Event
Tentative USD Jackson Hole Symposium
22:00 USD Fed Chair Yellen Speaks
03:00 EUR ECB President Draghi Speaks
Today’s Highlight Economy Data
| Time | Nation & Data | Previous | Forecast | Actual |
| 14:00 | EUR – German GDP (QoQ) (Q2) | 0.6% | 0.6% | – |
| 16:00 | EUR – German Ifo Business Climate Index (Aug) | 116.0 | 115.5 | – |
| 20:30 | USD – Core Durable Goods Orders (MoM) (Jul) | 0.1% | 0.4% | – |
| 01:00 | CrudeOIL – US Baker Hughes Oil Rig Count | 763 | – | – |
GBPUSD
GBPUSD, H4: GBPUSD was traded flat around the strong support of 1.2790 due to lack of bearish momentum. MACD indicator which illustrate diminishing downward momentum suggests GBPUSD to be traded higher in short-term as technical correction. Otherwise, long-term trend direction still suggests ongoing downside bias.
Resistance level: 1.2850, 1.2900
Support level: 1.2790, 1.2720
EURUSD
EURUSD, H1: EURUSD remained under pressure following prior retracement before the strong resistance level of 1.1820. A closure below the 60-MA line (green) would suggest EURUSD to advance further down, and retest near the support level of 1.1780.
Resistance level: 1.1820, 1.1845
Support level: 1.1780, 1.1750
USDJPY
USDJPY, H4: USDJPY was traded higher following prior rebound from the strong support level at 108.90. A closure above the 60-MA line (green) would suggest further upside bias, towards the next target at 110.10.
Resistance level: 110.10, 110.80
Support level: 109.50, 108.90
CrudeOIL
CrudeOIL, H4: Crude oil price was traded within a downward channel following prior rebound from the bottom level. The price action suggests short-term upside bias for its prices to extend its gains towards the target of resistance level at 47.95.
Resistance level: 47.95, 48.40
Support level: 47.40, 47.00
GOLD
GOLD_, H1: Gold price remained traded within a narrowing triangle while currently testing at the bottom level. Both MA line which has formed a death cross signal suggests possibility for a breakout to occur at this level and suggest a change in trend direction to move further downwards thereafter.
Resistance level: 1287.85, 1295.75
Support level: 1283.90, 1279.90
240817 Daily Analysis
24 August 2017 Daily Analysis
Greenback defends as Jackson Hole conclave approaches.
US dollar retraced some losses on Thursday while market participants anticipates the commencement of Jackson Hole Symposium due later in the day. Dollar index added up 0.03% and last quoted at 93.06. Overnight, the greenback fell against other major peers amid renewed political uncertainty in Washington. Demand for safe-haven currencies invigorated after President Donald Trump threatens to shut down the government if US Congress does not fund for the construction of border wall near Mexico. Such remarks came ahead of speech given by European Central Bank President Mario Draghi and Federal Reserve Chair Janet Yellen at the two-day symposium. Otherwise, Draghi is expected to remained hushed on future monetary policy stance in order to avert recent rally on the Euro amid ECB’s concern over recent sharp rise and its impact on their economy. Also weighing on the greenback was a surge in euro due to optimistic manufacturing and services data while coupled with softer-than-expected US New Home Sales.
In the commodities market, crude oil price eased 0.08% to $48.37 while remained supported by a larger-than-expected draw in US crude stockpiles. According to the Energy Information Administration, crude inventories fell for its eight-consecutive week with 3.3 million barrels last week. On the other hand, gold price appreciates by 0.03% to $1,289.25 while remained in a tight trading range ahead of Jackson Hole.
Today’s Holiday Market Close
Time Market Event
N/A
Today’s Highlight Events
Time Market Event
Tentative USD Jackson Hole Symposium
Today’s Highlight Economic Data
| Time | Nation & Data | Previous | Forecast | Actual |
| 16:30 | GBP – GDP (QoQ) (Q2) | 0.3% | 0.3% | – |
| 20:30 | USD – Initial Jobless Claims | 232K | 238K | – |
| 22:00 | USD – Existing Home Sales (Jul) | 5.52M | 5.57M | – |
GBPUSD
GBPUSD, H4: GBPUSD has extended its losses while currently testing near the support level of 1.2790. Both MA lines which continues to expand downwards suggests further downside bias after successfully closing below the target of 1.2790.
Resistance level: 1.2850, 1.2900
Support level: 1.2790, 1.2720
EURUSD
EURUSD, H1: EURUSD was traded lower following prior retracement from the strong resistance level of 1.1820 while forming a double top formation. MACD histogram which begins to illustrate negative divergence suggests EURUSD to advance further down, towards the next target at 1.1780.
Resistance level: 1.1820, 1.1845
Support level: 1.1780, 1.1750
USDJPY
USDJPY, H4: USDJPY was traded higher following a rebound from the strong support level of 108.90. A successful closure above the 20-MA line (red) would suggest USDJPY to advance further up and retest near the resistance level of 109.50.
Resistance level: 109.50, 110.10
Support level: 108.90, 108.30
CrudeOIL
CrudeOIL, H4: Crude oil was traded lower following prior retracement from the top level of narrowing triangle. Such price action suggests short-term downside bias for its prices to move further down, towards the next target at 47.95.
Resistance level: 48.40, 48.90
Support level: 47.95, 47.40
GOLD
GOLD_, H1: Gold price remains traded within a narrowing triangle following prior retracement from the top level. A closure below the support level of 1287.85 would suggest gold price to extend its short-term losses, towards the bottom level of the triangle.
Resistance level: 1292.75, 1296.50
Support level: 1287.85, 1283.90