
GCMAsia - NZDUSD

NZDUSD
2017-04-21
| Resistance and Support | Level | Explanation |
| Resistance | 0.7055 | Daily |
| Support | 0.6970 | Daily |
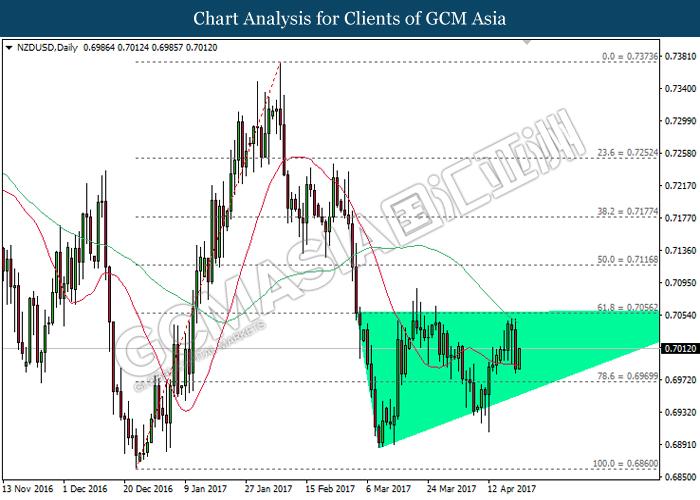
NZDUSD, Daily: NZDUSD remains traded within an ascending triangle while currently testing near the 20-moving average line (red). A rebound from this line would suggest NZDUSD to be traded higher, towards the upper level of the triangle in short-term. Long-term trend direction could only be determined following a successful breakout from either side of the triangle.
Resistance level: 0.7055, 0.7115
Support level: 0.6970, 0.6860