
GCMAsia - NZDUSD

NZDUSD
2018-09-27
| Resistance and Support | Level | Explanation |
| Resistance | 0.6675 | H4 |
| Support | 0.6615 | H4 |
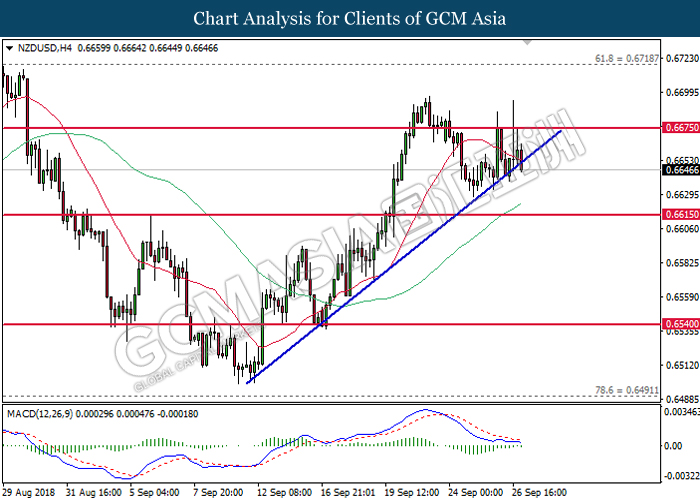
NZDUSD, H4: NZDUSD was traded lower while currently testing near the upward trendline. MACD histogram which illustrate persistent bearish signal suggests the pair to extend its losses after breaking the trendline.
Resistance level: 0.6675, 0.6720
Support level: 0.6615, 0.6540