
GCMAsia - USDJPY

USDJPY
2018-07-17
| Resistance and Support | Level | Explanation |
| Resistance | 112.60 | H1 |
| Support | 112.10 | H1 |
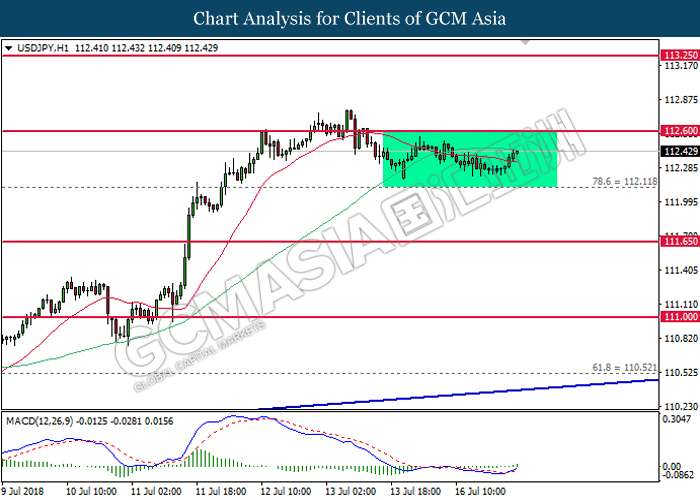
USDJPY, H1: USDJPY was traded higher following prior rebound from the bottom level of the range near 112.10. MACD histogram which illustrate bullish signal suggests the pair to be traded higher in short-term. Otherwise, long-term trend direction can only be determined following a successful breakout from either side of the range.
Resistance level: 112.60, 113.25
Support level: 112.10, 111.65