1 June 2018 Daily Analysis
Greenback rebounds over robust fundamentals.
Greenback rebounds from its session low during North American trading hours following optimistic economic data from the region and a retreat in Euro despite diminishing political risk in the region. The dollar index was quoted up 0.02% to 93.90 during early Asian trading session. Overnight, Federal Reserve’s preferred inflation measure – Core PCE Price Index rose more than expected with 0.2%, beating economist forecast of only 0.1% for month-over-month comparison in April. In terms of jobs market, US Department of Labour reported a drop in Initial Jobless Claims last week, down by 13,000 individuals to a seasonally adjusted total of 221,000. Both data came helped the greenback to recover some losses after it received tremendous bearish bias following a rise in Euro and weaker-than-expected first quarter GDP reading. On the other hand, pair of EUR/USD was down 0.02% to $1.1690 while investors place their sole attention over political turmoil in Spain. Spain Prime Minister Mariano Rajoy is expected to face the no-confidence vote scheduled to take place later today after being called to step down following multiple graft allegation.
In the commodities market, crude oil price settled down by 0.07% to $66.98 per barrel despite massive draw in US crude supplies as US oil output continued its expansion by rising 215,000 barrels per day (bpd) to 10.47 million bpd in March. Otherwise, gold price rose 0.03% to $1,298.47 a troy ounce as investors monitor ongoing geopolitical tension around the globe.
Today’s Holiday Market Close
Time Market Event
N/A
Today’s Highlight Events
Time Market Event
08:30 USD FOMC Member Kaplan Speaks
20:55 USD FOMC Member Kashkari Speaks
Today’s Highlight Economy Data
| Time | Nation & Data | Previous | Forecast | Actual |
| 09:45 | CNY – Caixin Manufacturing PMI (May) | 51.1 | 51.3 | – |
| 15:55 | EUR – German Manufacturing PMI (May) | 56.8 | 56.8 | – |
| 16:30 | GBP – Manufacturing PMI (May) | 53.9 | 53.5 | – |
| 20:30 | USD – Average Hourly Earnings (MoM) (May) | 0.1% | 0.2% | – |
| 20:30 | USD – Nonfarm Payrolls (May) | 164K | 189K | – |
| 20:30 | USD – Unemployment Rate (May) | 3.9% | 3.9% | – |
| 22:00 | USD – ISM Manufacturing PMI (May) | 57.3 | 58.2 | – |
| 22:00 | USD – ISM Manufacturing Employment (May) | 54.2 | 54.5 | – |
| 01:00 | CrudeOIL – US Baker Hughes Oil Rig Count | 844 | – | – |
GBPUSD
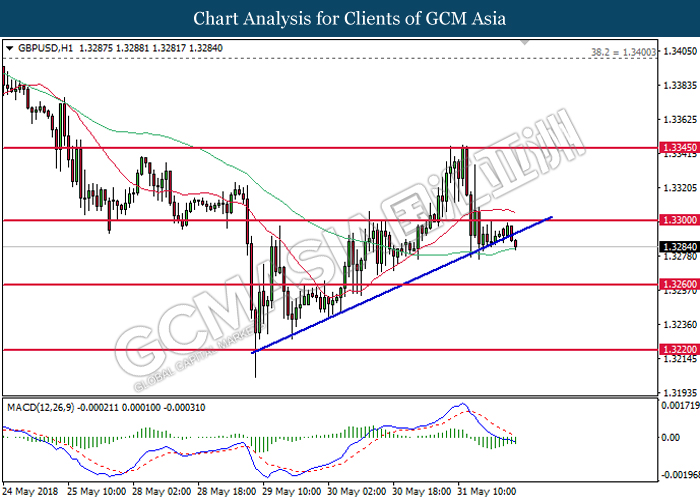
GBPUSD, H1: GBPUSD was traded lower following prior breakout from the mini upward trendline. MACD histogram which begins to illustrate increasing downward momentum suggests the pair to extend its losses after closing below the 60-MA line (green).
Resistance level: 1.3300, 1.3345
Support level: 1.3260, 1.3220
EURUSD
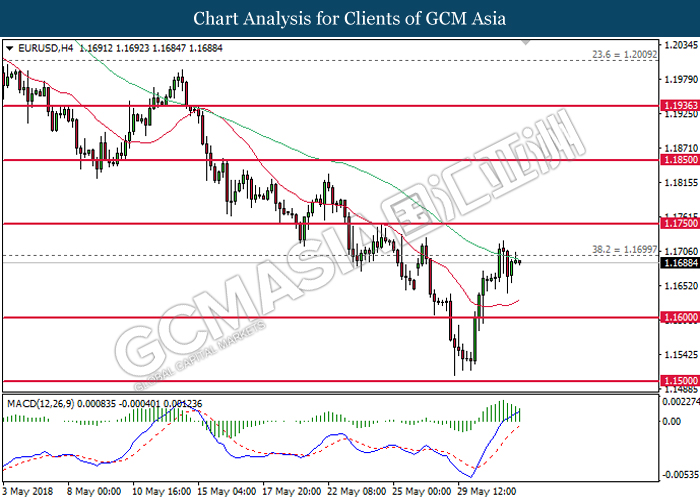
EURUSD, H4: EURUSD was traded lower following prior retracement and closure below the target of 1.1700. MACD histogram which illustrate diminishing upward momentum may suggests the pair to be traded lower in short-term after a bearish retrace from the 60-MA line (green).
Resistance level: 1.1700, 1.1750
Support level: 1.1600, 1.1500
USDJPY
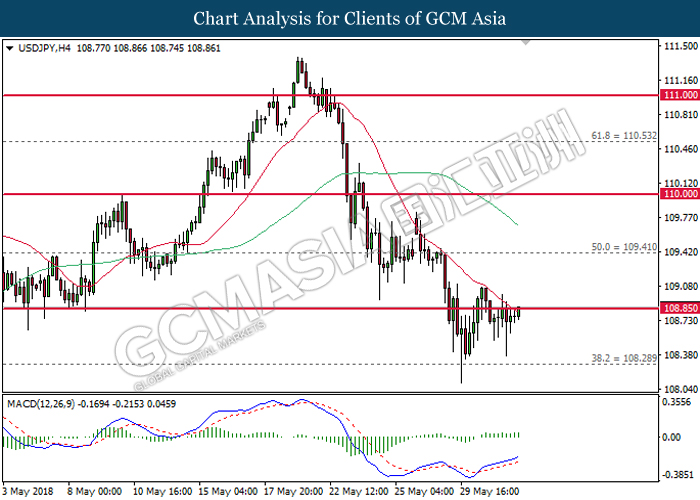
USDJPY, H4: USDJPY was traded higher after receiving some support from the threshold at 108.30. MACD histogram which illustrate persistent upward signal suggest the pair to extend its gains after breaking the resistance level at 108.85.
Resistance level: 108.85, 109.40
Support level: 108.30, 107.50
CrudeOIL
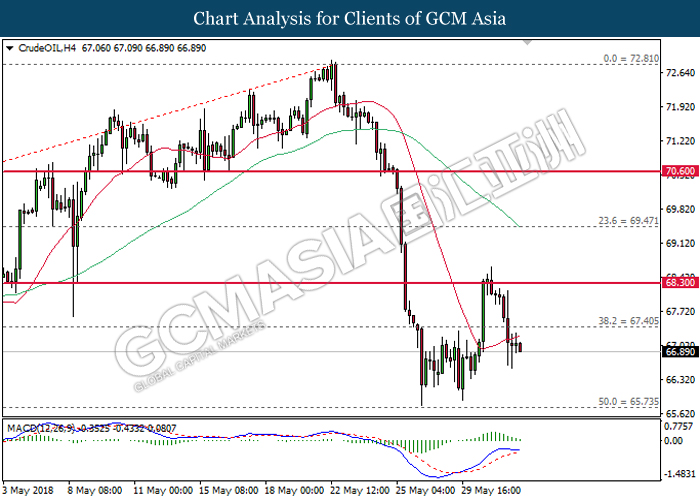
CrudeOIL, H4: Crude oil price extended losses following prior retracement from the resistance level at 68.30. MACD histogram which illustrate diminished upward momentum suggests the commodity price to extend its losses towards the direction of 65.75.
Resistance level: 67.40, 68.30
Support level: 65.75, 64.05
GOLD
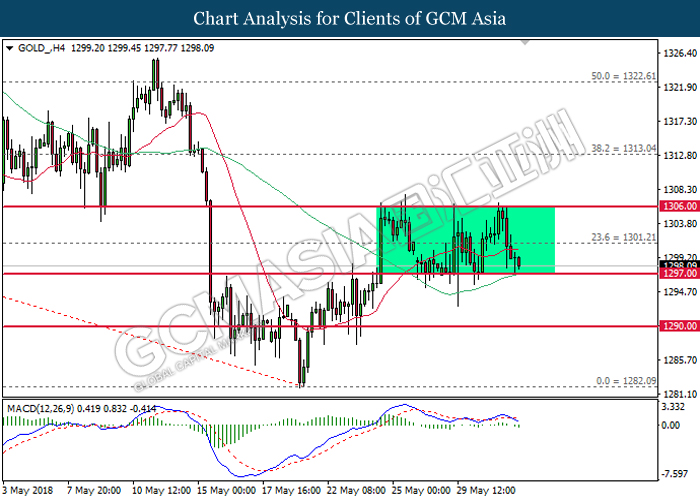
GOLD_, H4: Gold price remains traded within a sideways channel while currently testing at the bottom level. MACD histogram which illustrate the formation of death cross suggests further bearish bias. However, a close below the support level at 1297.00 is required to attain further validation.
Resistance level: 1301.20, 1306.00
Support level: 1297.00, 1290.00