3 April 2017 Weekly Analysis
GCMAsia weekly report: April 3 – 7
Market Review (Forex): March 27 – 31
U.S. Dollar
The greenback ended flat against a basket of other major currencies last Friday as dovish remarks from a Federal Reserve official weighs along with lacklustre US economic data. The dollar index was unchanged at 100.22 during late Friday trading. Otherwise, the index has added 0.78% for the week, snapping off three weeks of consecutive losses. For the month of March, the index has shed 0.9% and was down almost 3% for the first quarter as growing doubts looms over Trump administration’s ability to spur higher economic growth in the US with his economic proposals and allowing the Fed to tighten their policy more aggressively.
Pessimistic sentiment surrounds the greenback after New York Fed President William Dudley postulate on last Friday that the central bank was in no rush to tighten their monetary policy more rapidly. The remarks came after report showing that US personal spending ticked up only 0.1% last month, indicating that the Fed will likely to adhere to its cautious outlook in hiking their interest rates.
US Personal Spending
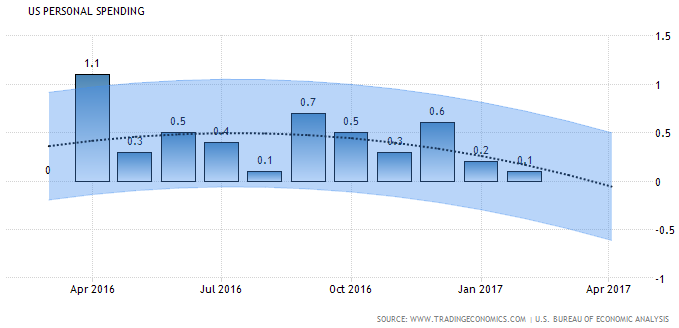
—– Forecast
US personal spending reading came in at only 0.1%, missed economist expectation of 0.2%.
USD/JPY
Pair of USD/JPY was down 0.47% to 111.39, while shedding 1.2% for the month.
EUR/USD
Euro was slightly weaker with EUR/USD down 0.2% to $1.0655, its lowest level since March 15th. The single currency ended the week with 1.7% lower as investors expectation towards European Central Bank’s move to tighten their monetary policy begins to subside due to lacklustre regional data.
GBP/USD
Great British Pound added up 0.65% and ended the week at $1.2550.
Market Review (Commodities): March 27 – 31
GOLD
Gold prices retraced some losses on Friday after a Federal Reserve official said that the central bank was in no rush to tighten their monetary policy this year. Gold price for April delivery was up 0.19% to $1,247.40. Price of the yellow metal has ended the quarter with a gain of almost 8.5%, boosted by a weaker dollar and growing doubts over Trump administration’s ability to spur higher economic growth in the United States that would allow the Feds to tighten their monetary policy more rapidly.
Crude Oil
Oil futures settled higher for the fourth session in a row on last Friday, extending its rally to the strongest level in more than three weeks due to higher optimism towards OPEC in extending its production-cut deal beyond first half of the year. Crude oil price was up 25 cents while ended at $50.60 per barrel during late Friday trading while ended the week with $2.63 or 5.2% of gains. Sentiment in the oil market was improved during last week in wake of an increasingly supportive rhetoric from a number of OPEC nations willingness to extend OPEC’s production cuts into the second half of the year. A joint committee of ministers from OPEC and non-OPEC oil producers will meet in late April to present its recommendation on the fate of the pact while the final decision will be taken by May 25th.
In the United States, oilfield services provider Baker Hughes reported that the number of active oil drilling rigs rose by 10 last week, marking its increase for 11th week while bringing the total count to its highest since September 2015 with 662. Concurrently, the US Energy Information Administration reported that US crude oil inventories rose 867,000 barrels last week, sending its total to an all-time high of 534.0 million thus far. Such reading has fuelled more concerns for an ongoing global glut as the US has reported for a swell in their inventories for 12 consecutive weeks.
U.S. Baker Hughes Oil Rig Count
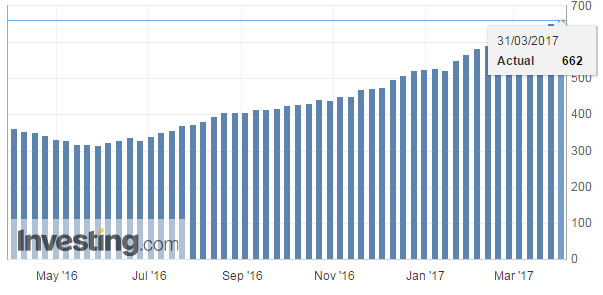
Oilfield services provider Baker Hughes reported that U.S. active oil rig count increased by 10 to 662 last week.
U.S. Crude Oil Stocks Change
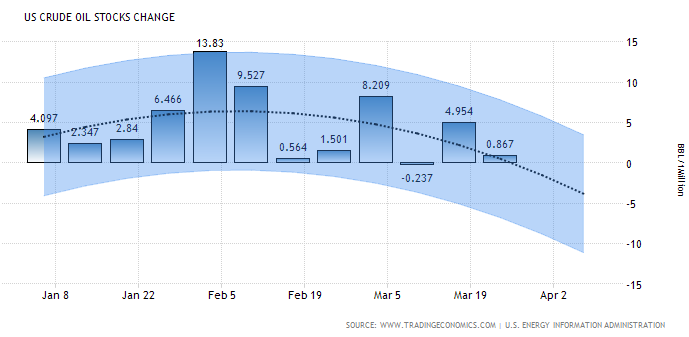
—– Forecast
Energy Information Administration reported a swell in crude inventories by 867,000 barrels last week, sending total inventories to a record high of 534.0 million barrels.
Weekly Outlook: April 3 – 7
For the week, investors will be looking into Wednesday’s Fed meeting minute for new indication of the timing for next US interest rate hike ahead of Friday’s highly anticipated Nonfarm Payrolls report. Otherwise, investors will also be eying on UK’s private sector activity amid ongoing concerns over the economic impact of Brexit.
As for oil traders, they will eye on fresh weekly information on US stockpiles of crude which will be released on Wednesday for further indication of demand from world’s largest oil consumer. Otherwise, they will also pay close attention to comments from global oil producers for further evidence of their compliance to reduce output this year.
Highlighted economy data and events for the week: April 3 – 7
| Monday, April 3 |
Data JPY – Tankan Large Manufacturers Index (Q1) JPY – Tankan Large Non-Manufacturers Diffusion Index (Q1) AUD – Retail Sales (MoM) (Feb) EUR – German Manufacturing PMI (Mar) GBP – Manufacturing PMI (Mar) USD – ISM Manufacturing PMI (Mar)
Events N/A
|
| Tuesday, April 4 |
Data NZD – NZIER Business Confidence (Q1) AUD – RBA Interest Rate Decision (Apr) GBP – Construction PMI (Mar) USD – Trade Balance (Feb) CAD – Trade Balance (Feb) Crude Oil – API Weekly Crude Oil Stock
Events AUD – RBA Rate Statement EUR – ECB President Draghi Speaks
|
| Wednesday, April 5 |
Data GBP – Services PMI (Mar) USD – ADP Nonfarm Employment Change (Mar) USD – ISM Non-Manufacturing PMI (Mar) Crude Oil – Crude Oil Inventories
Events USD – FOMC Meeting Minutes
|
| Thursday, April 6 |
Data EUR – German Factory Orders (MoM) (Feb) USD – Initial Jobless Claims CAD – Building Permits (MoM) (Feb)
Events EUR – ECB President Draghi Speaks EUR – ECB Publishes Account of Monetary Policy Meeting
|
|
Friday, April 7
|
Data GBP – Halifax House Price Index (MoM) (Mar) GBP – Manufacturing Production (MoM) (Feb) GBP – Trade Balance (Feb) USD – Nonfarm Payrolls (Mar) USD – Unemployment Rate (Mar) CAD – Employment Change (Mar) Crude Oil – U.S. Baker Hughes Oil Rig Count
Events GBP – BoE Gov Carney Speaks
|
Technical weekly outlook: April 3 – 7
Dollar Index
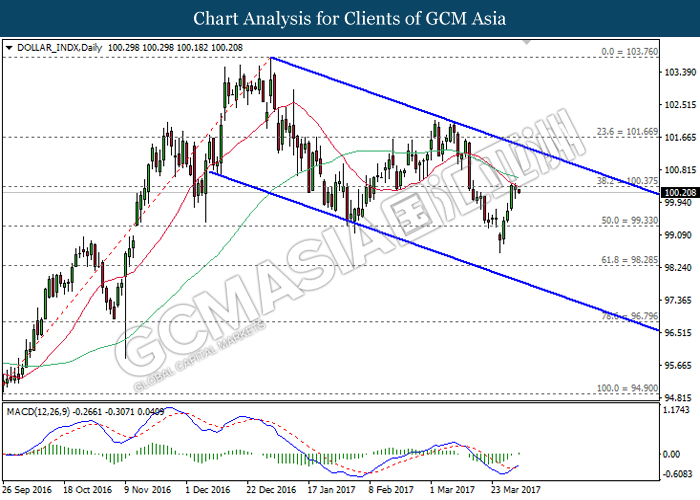
DOLLAR_INDX, Daily: The dollar index remained traded within a downward channel while currently testing near the resistance level of 100.40. With regards to the MACD histogram which illustrate an upward signal and momentum, a successful closure above 100.40 would suggest the dollar index to extend its gains towards the upper level of the channel.
Resistance level: 100.40, 101.65
Support level: 99.30, 98.30
GBPUSD
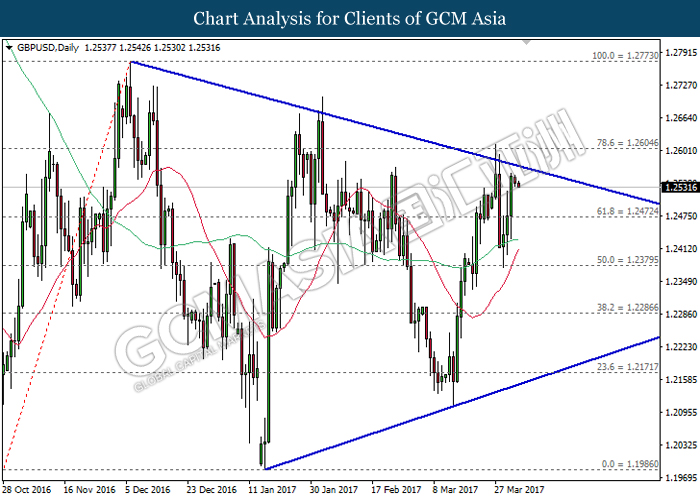
GBPUSD, Daily: GBPUSD remains traded within a narrowing triangle while currently testing near the top level of the triangle. A successful breakout from this level would signal a change in trend direction to move further upwards thereafter. Otherwise, a retracement from this level would suggest GBPUSD to be traded lower in short-term, towards the target of support level at 1.2470.
Resistance level: 1.2605, 1.2770
Support level: 1.2470, 1.2380
USDJPY
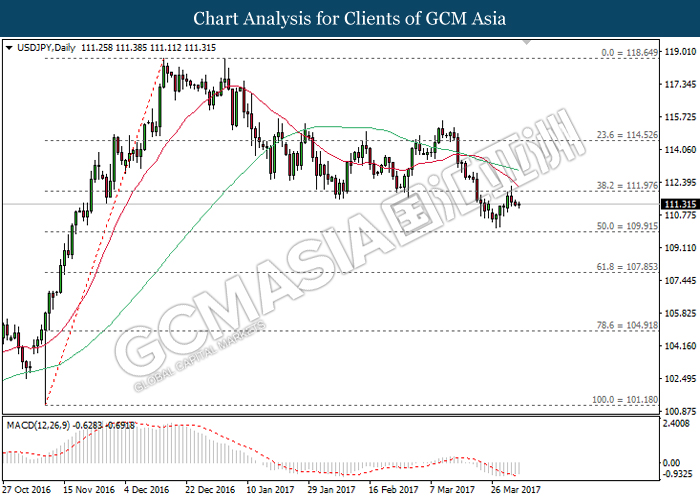
USDJPY, Daily: USDJPY was traded lower following a retracement from the resistance level of 112.00 due to the downward expansion of moving average line after the formation of death cross. However, as the MACD indicator begins to hover outside of downward momentum, USDJPY is expected to experience brief retracement period within the range of 100.90 and 112.00 in the short-term, before continuing its downward momentum in the long-term.
Resistance level: 112.00, 114.50
Support level: 109.90, 107.85
EURUSD
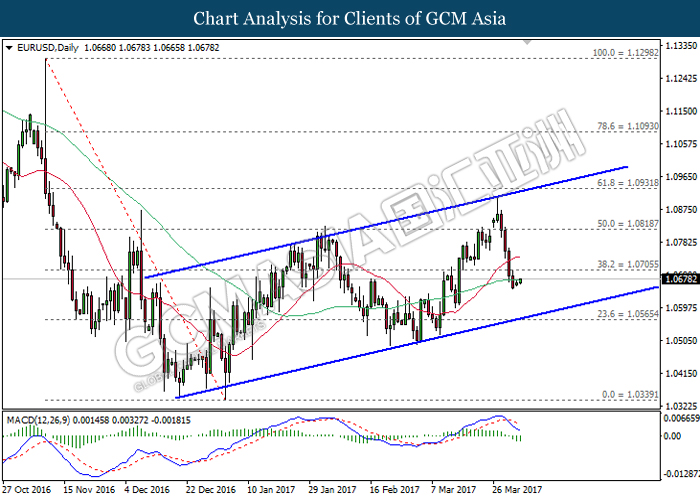
EURUSD, Daily: EURUSD remains traded within an upward channel following prior retracement from the top level of the channel. Referring to the MACD histogram which illustrates downward signal and momentum, EURUSD is expected to advance further down, towards the bottom level of the channel near the support level of 1.0565.
Resistance level: 1.0705, 1.0820
Support level: 1.0565, 1.0340
GOLD
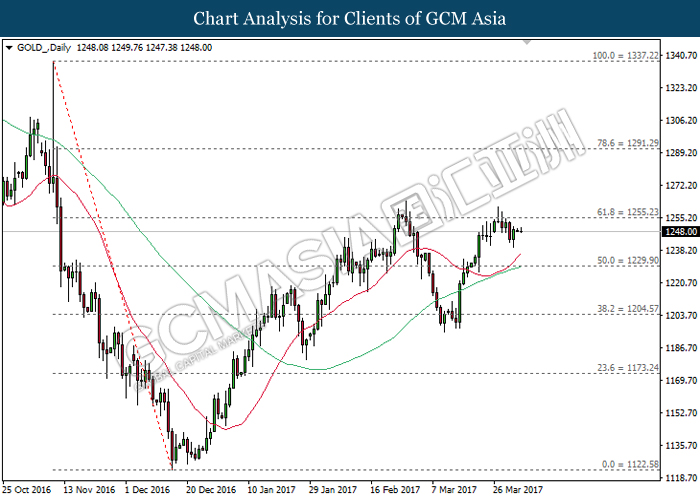
GOLD_, Daily: Gold price has previously formed a double top formation, indicating a strong resistance level ahead at 1255.25. As both moving average line extends its upward expansion, gold price is expected to move further upwards and retest near the level of 1255.25. A successful breakthrough from this level would suggest gold price to continue its upward momentum.
Resistance level: 1255.25, 1291.30
Support level: 1229.90, 1204.55
Crude Oil
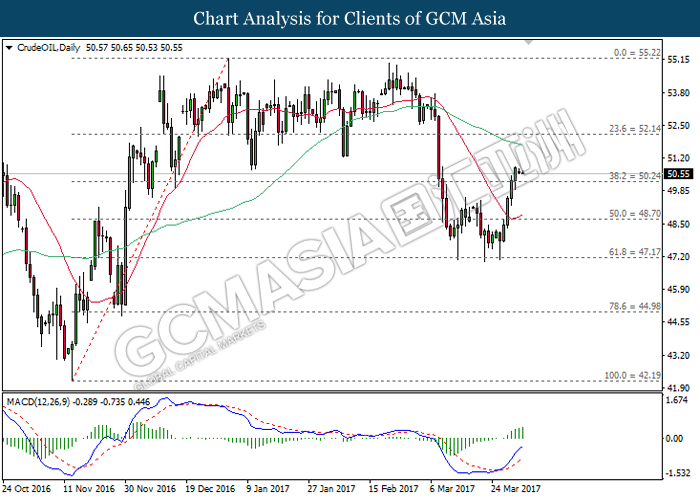
CrudeOIL, Daily: Crude oil price was traded higher following a rebound from the strong support level of 47.15 while concurrently closing above the 20-moving average line (red). With regards to the MACD histogram which illustrates upward signal and momentum, crude oil price is expected to extend its upward momentum after a rebound from the support level of 50.25.
Resistance level: 52.15, 55.20
Support level: 50.25, 48.70