4 October 2017 Daily Analysis
Greenback tumbles, eyes on major data.
US dollar tumbles lower during Wednesday’s Asian trading hours due to lack of top tier economic data while losses remained cap as investors placed higher prospect for an imminent interest rate hike by year-end. The dollar index sheds its gains by 0.14% while trading at 93.21 against a basket of six major currencies. In somewhat a quiet day on the economic calendar, US dollar stages its technical correction from prior seven-weeks high as investors held off from initiating large trade ahead of a busy week which includes speech by Federal Reserve Chair Janet Yellen and the release of highly anticipated Nonfarm Payrolls report. Investors will be scrutinizing on Yellen’s remark, whom is bound to speak at the Community Banking in the 21st Century Conference for further signals regarding future monetary policy and the next successor of Fed Chair. On the other hand, pair of GBP/USD recovered its losses by 0.25% to $1.3268 amid data showing that the UK construction sector contracted for the first time since August last year. Market participants will be focusing on today’s UK Services PMI to gauge the impending risk from last year’s Brexit vote.
As for commodities, crude oil price fell by 0.67% to $50.08 a barrel following mixed results from API weekly report. According to API, crude oil inventories fell by 4.08 million barrels last week. However, gasoline supplies gained 4.91 million barrels, shadowing the optimistic reading from crude inventories. As API and EIA figures often diverge, most investors will be waiting for official inventory report form EIA for further market indication. On the other hand, gold price stages its recovery by 0.26% to $1,275.17 following US dollar’s correction since yesterday.
Today’s Holiday Market Close
Time Market Event
All Day CNY China – National Day
Today’s Highlight Events
Time Market Event
01:15 EUR ECB President Draghi Speaks
03:00 USD FOMC Member Bullard Speaks
03:15 USD Fed Chair Yellen Speaks
Today’s Highlight Economy Data
| Time | Nation & Data | Previous | Forecast | Actual |
| 04:30 | CrudeOIL – API Weekly Crude Oil Stock | -0.761M | – | -4.079M |
| 16:00 | EUR – Markit Composite PMI (Sep) | 56.7 | 56.7 | – |
| 16:00 | EUR – Services PMI (Sep) | 55.6 | 55.6 | – |
| 16:30 | GBP – Services PMI (Sep) | 53.2 | 53.2 | – |
| 17:00 | EUR – Retail Sales (MoM) (Aug) | -0.3% | 0.3% | – |
| 20:15 | USD – ADP Nonfarm Employment Change (Sep) | 237K | 125K | – |
| 21:45 | USD – Markit Composite PMI (Sep) | 54.6 | – | – |
| 21:45 | USD – Services PMI (Sep) | 55.1 | 55.1 | – |
| 22:00 | USD – ISM Non-Manufacturing PMI (Sep) | 55.3 | 55.5 | – |
| 22:30 | CrudeOIL – Crude Oil Inventories | -1.846M | -0.756M | – |
GBPUSD
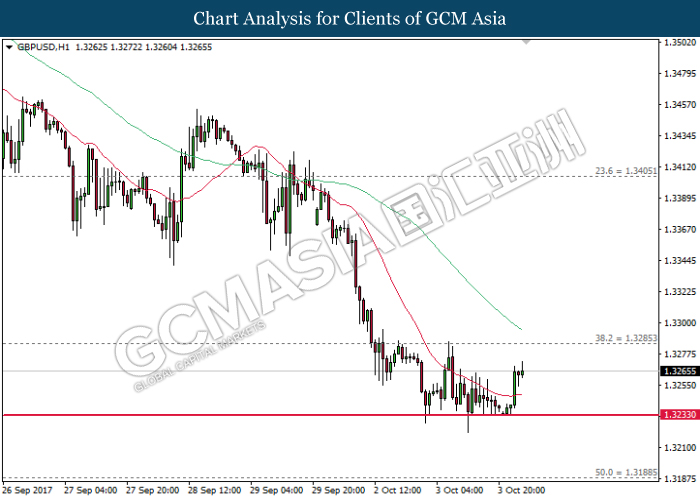
GBPUSD, H1: GBPUSD was traded higher following prior rebound near the support level of 1.3230. Recent bullish closure above the 20-MA line (red) suggests short-term bias for the pair to be traded higher and head towards the resistance level of 1.3285.
Resistance level: 1.3285, 1.3405
Support level: 1.3230, 1.3190
EURUSD
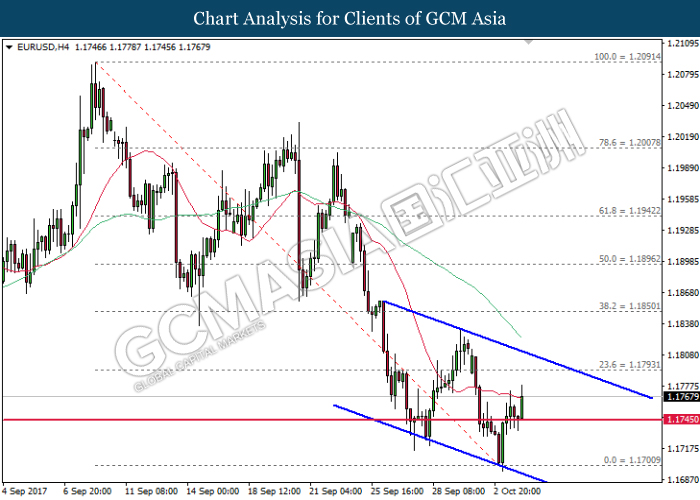
EURUSD, H4: EURUSD remains traded within a downward channel following prior rebound from the bottom level of the channel. A closure above the 20-MA line (red) may suggest the pair to advance further up in short-term, towards the target of 1.1795.
Resistance level: 1.1795, 1.1850
Support level: 1.1745, 1.1700
USDJPY
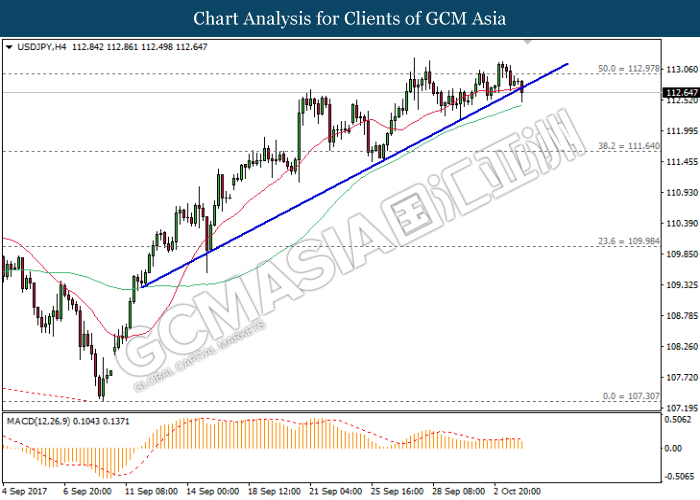
USDJPY, H4: USDJPY remains under pressure following prior retracement while currently testing at the upward trend line. MACD indicator which shows diminishing upward momentum suggests that a breakout from the upward trend line will suggest a change in trend direction to extend its losses thereafter.
Resistance level: 113.00, 114.30
Support level: 111.65, 110.00
CrudeOIL
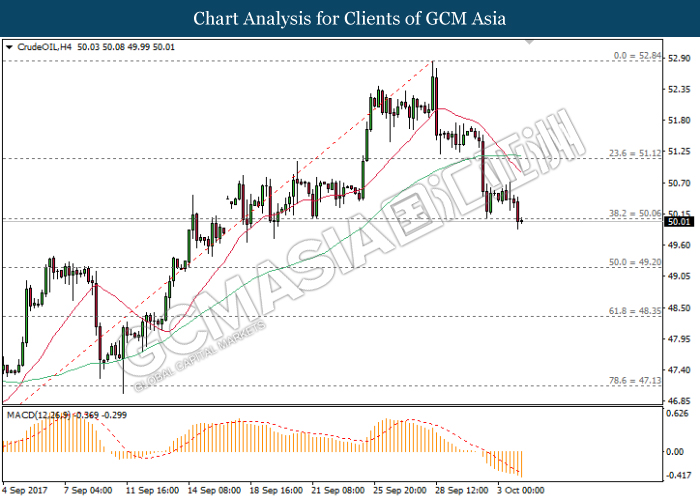
CrudeOIL, H4: Crude oil price extended its losses following prior formation of death cross by both moving average line. MACD indicator which illustrate substantial downward momentum suggests crude oil price to extend its losses towards the next target at 49.20.
Resistance level: 50.05, 51.10
Support level: 49.20, 48.35
GOLD
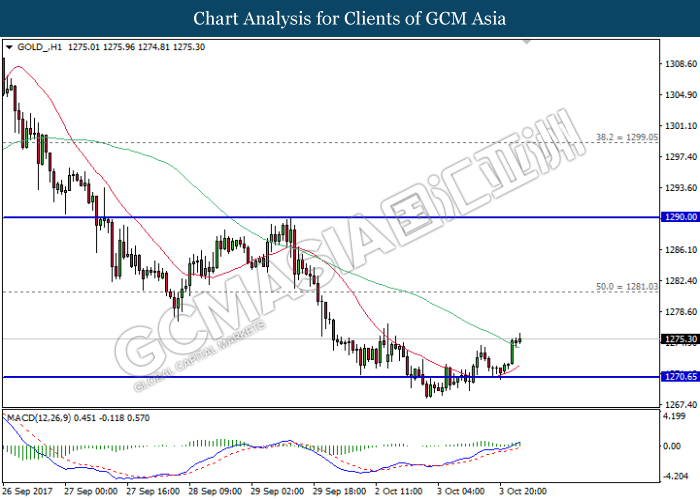
GOLD_, H1: Gold price was traded higher following prior rebound from the support level of 1270.65. MACD indicator which illustrate substantial upward signal suggests gold price to extend its short-term upside bias towards the next target at 1281.05.
Resistance level: 1281.05, 1290.00
Support level: 1270.65, 1263.00