5 June 2017 Weekly Analysis
GCMAsia Weekly Report: June 5 – 9
Market Review (Forex): May 29 – June 2
U.S. Dollar
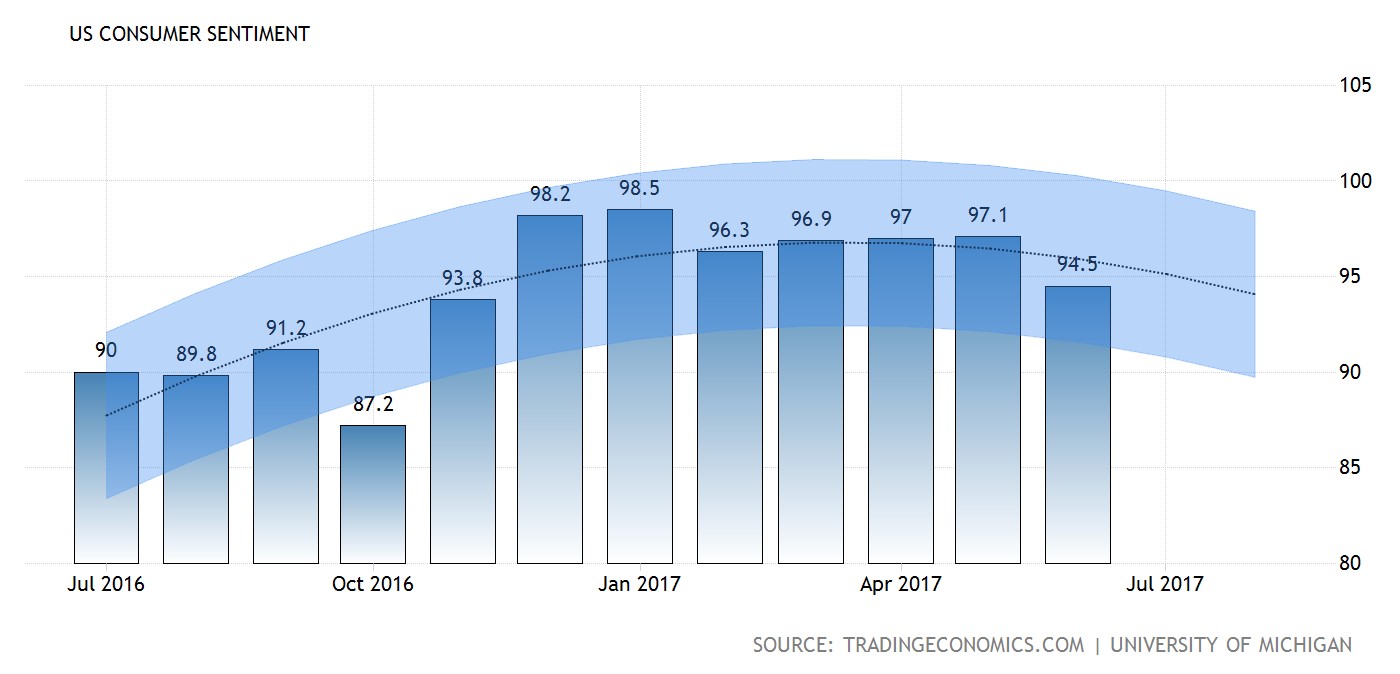
Greenback fell to seven-months low against other major currency following the release of US Nonfarm Payrolls report which gives substantially poor reading, fueling higher uncertainty over the outlook for rate hikes by the Federal Reserves for the second half of the year. The dollar index was down 0.57% to 96.61 during late Friday trading, its lowest close since US Presidential Election on November 8th.
According to the Labor Department, the economy has added only 138,000 jobs last month, falling short of economist’s expectation for 185,000 jobs. In addition, figures for the month of March and April was revised to show that 66,000 jobs were fell short, indicating that the labor market might be losing its momentum although unemployment rate ticked down to a 16-years low of 4.3%.
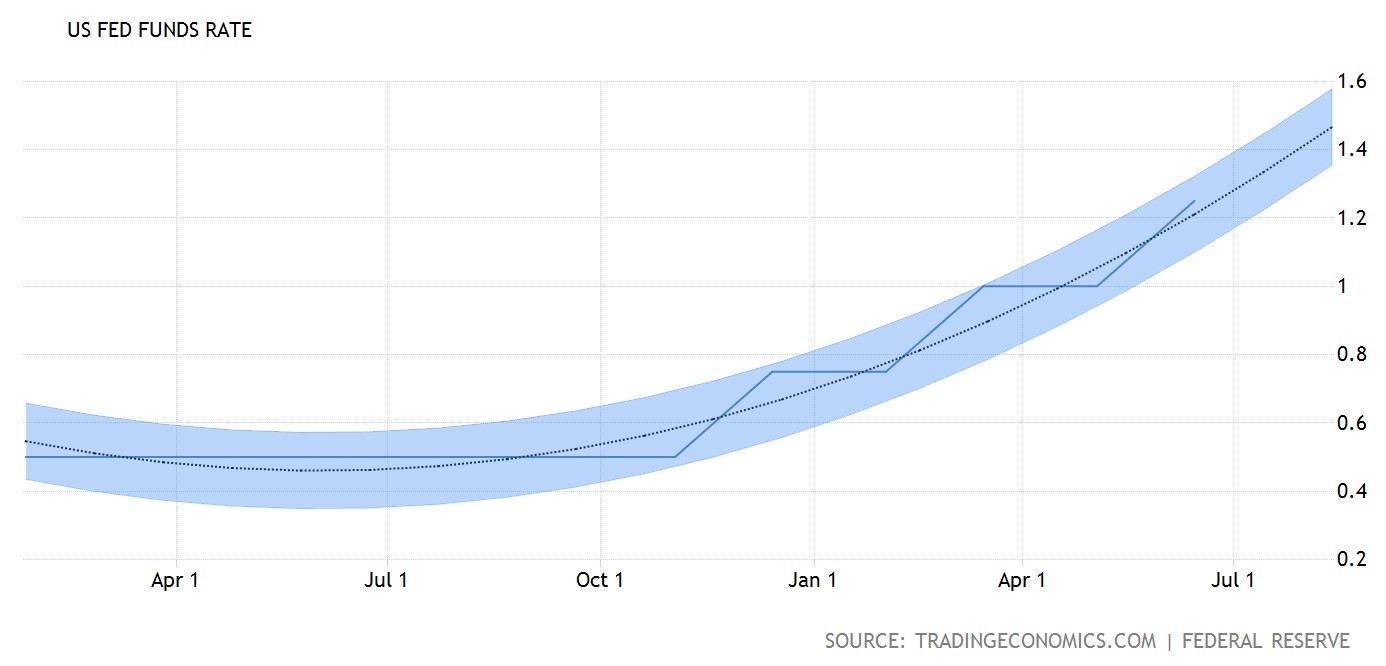
However, most analysts believe that the disappointing data would not hinder the Feds from raising its interest rates later this month. According to the Fed Rate Monitor Tool, the probability for an interest rate hike on June 14th is roughly around 88%, down from 89% prior to the release of jobs report. Otherwise, a weaker-than-expected jobs growth could dial down overall expectation for an economic growth rebound in the second quarter after the economy expanded only by 1.2% for the first quarter.
US Nonfarm Payrolls

—– Forecast
US economy generated 138,000 jobs last month, failing to reach expectation for 185,000 jobs.
US Unemployment Rate
—– Forecast
US unemployment rate ticked down by 0.1% to 4.3% for the month of May.
USD/JPY
Dollar retreats from its one-week high against the yen, with USD/JPY paring 0.88% of gains to 110.38.
EUR/USD
Euro was up 0.6% to $1.1280 during late Friday trading following broad selling pressure on the US dollar.
GBP/USD
Pound sterling eases slightly and was last seen at $1.2887 on Friday.
Market Review (Commodities): May 29 – June 2
GOLD
Gold prices rose to its highest level in more than a month on Friday following weak US jobs report which has underlined the case for US Federal Reserve in raising their interest rates at a gradual pace. Price of the yellow metal was up almost 1% to $1,278.77, its highest close since April 25th. In summary, US economy generated only 138,000 jobs last month, falling short of economist expectations while figures for March and April were revised down to show 66,000 fewer jobs were created. Such reading has further raise uncertainty over US Federal Reserve which were largely expected to raise their interest rates on 14th June.
Generally, gold price and dollar moves in opposite directions, whereby a weaker dollar would boost the appeal of gold as an alternative asset to investors who uses currencies other than the greenback. Likewise, gold price is sensitive to rising interest rates where it could lift the opportunity cost of holding non-yielding asset.
Crude Oil
Crude oil settled at its lowest level in more than three weeks on Friday while tacking in its largest weekly loss in a month amid growing concern over rising shale production in the United States. Its prices fell 70 cents or 1.5% to $47.66 per barrel. Investors were concerned over the ongoing rebound in US shale industry which could derail efforts by other major producers in reducing global supply glut which has pressured its prices for the last two years.
Data from energy services company, Baker Hughes reported that US drillers has added 11 oil drilling rigs last week, to a total of 733 thus far. On the other hand, the controversial decision of US President Donald Trump’s withdrawal from the 2015 Paris Climate Agreement on Thursday has sparked higher concerns that the US oil production could expand rapidly in the absence of stringent focus on curbing the use of fossil fuels.
U.S. Baker Hughes Oil Rig Count
Active oil drilling rig in US was increased by 11 last week to a total of 733 thus far.
Weekly Outlook: June 5 – 9
Events in the Europe would likely to set the tone for global financial market namely European Central Bank policy meeting and British national election. Likewise, Chinese data on trade and inflation will also be closely watched. In the US, market participants will be paying close attention to testimonial given by former FBI director James Comey in front of Senate Intelligence Committee which could add further difficulties to Trump administration.
As for oil market, traders will be eyeing fresh weekly information upon US crude and refined products stockpiles due Tuesday and Wednesday to gauge the strength of demand in the world’s largest oil consumer.
Highlighted economy data and events for the week: June 5 – 9
| Monday, June 5 |
Data CNY – Caixin Services PMI (May) GBP – Services PMI (May) USD – ISM Non-Manufacturing PMI (May)
Events N/A
|
| Tuesday, June 6 |
Data AUD – RBA Interest Rate Decision (June) USD – JOLTs Job Openings (Apr) CAD – Ivey PMI (May) Crude Oil – API Weekly Crude Oil Stock
Events AUD – RBA Rate Statement
|
| Wednesday, June 7 |
Data AUD – GDP (QoQ) (Q1) GBP – Halifax House Price Index (MoM) (May) CAD – Building Permits (MoM) (Apr) Crude Oil – Crude Oil Inventories
Events N/A
|
| Thursday, June 8 |
Data JPY – GDP (QoQ) (Q1) AUD – Trade Balance (Apr) CNY – Trade Balance (USD) (May) CHF – CPI (MoM) (May) EUR – Deposit Facility Rate EUR – ECB Interest Rate Decision (June) USD – Initial Jobless Claims
Events GBP – UK General Election EUR – ECB Press Conference CAD – BoC Gov Poloz Speaks
|
|
Friday, June 9
|
Data CNY – CPI (YoY) (May) GBP – Manufacturing Production (MoM) (Apr) CAD – Employment Change (May) Crude Oil – U.S. Baker Hughes Oil Rig Count
Events N/A
|
Technical weekly outlook: June 5 – 9
Dollar Index
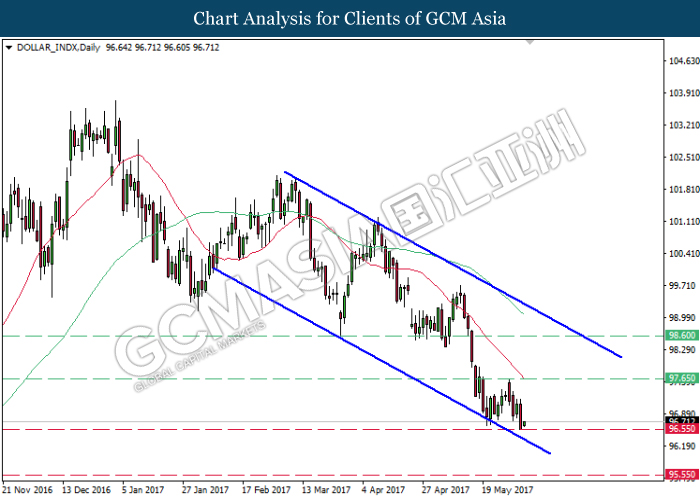
DOLLAR_INDX, Daily: Dollar index remained traded within a downward channel while currently testing at the support level of 96.55. However, as both MA line continues to expand downwards, a breakout from the bottom level would signal a change in trend direction to move further downwards.
Resistance level: 97.65, 98.60
Support level: 96.55, 95.55
GBPUSD
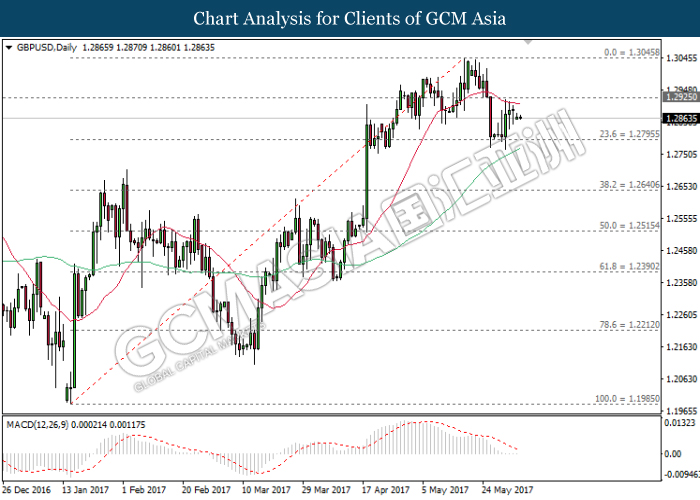
GBPUSD, Daily: GBPUSD was traded lower following prior retracement from the 20-moving average line (red). MACD indicator which continues to hover outside of upward momentum suggests GBPUSD to oscillate in between the range of 1.2795 and 1.2925 in short-term. Long-term trend direction suggests it to move further up after breaking the resistance level of 1.2925.
Resistance level: 1.3045, 1.2925
Support level: 1.2795, 1.2640
USDJPY
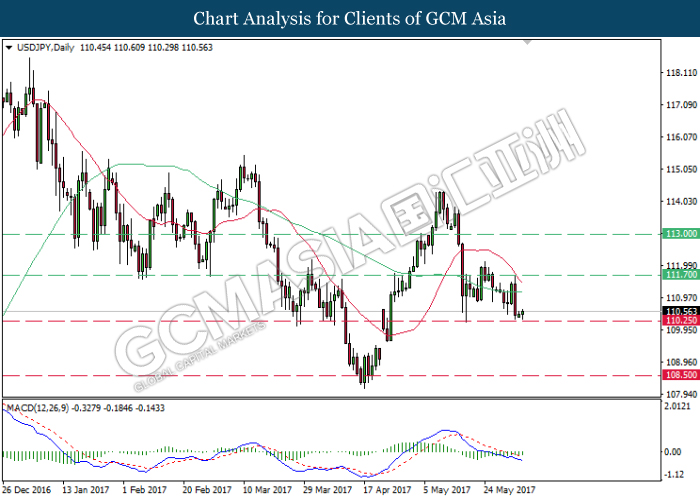
USDJPY, Daily: USDJPY was traded lower following prior retracement from the resistance level of 111.70. Referring to MACD histogram which illustrates significant downward signal and momentum, a closure below the strong support level of 110.25 would suggest USDJPY to move further downwards.
Resistance level: 111.70, 113.00
Support level: 110.25, 108.50
EURUSD
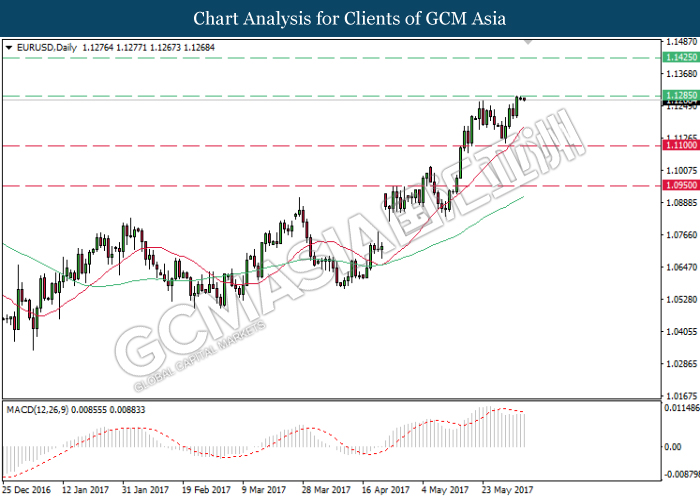
EURUSD, Daily: EURUSD extended its gains following prior rebound from the support level of 1.1100. However, MACD indicator begins to drift outside of upward momentum suggest EURUSD to be traded lower in short-term as technical correction. Otherwise, long-term trend direction still suggests EURUSD for further upside.
Resistance level: 1.1285, 1.1425
Support level: 1.1100, 1.0950
GOLD
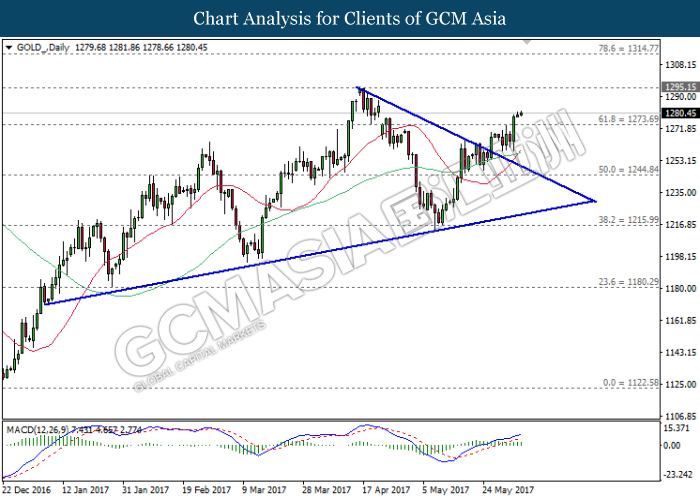
GOLD_, Daily: Gold price has extended its gains following prior breakout from the top level of narrowing triangle. MACD histogram which illustrates substantial upward signal suggests gold price to move further up, towards the target of resistance level at 1295.15.
Resistance level: 1295.15, 1314.75
Support level: 1273.70, 1244.85
Crude Oil
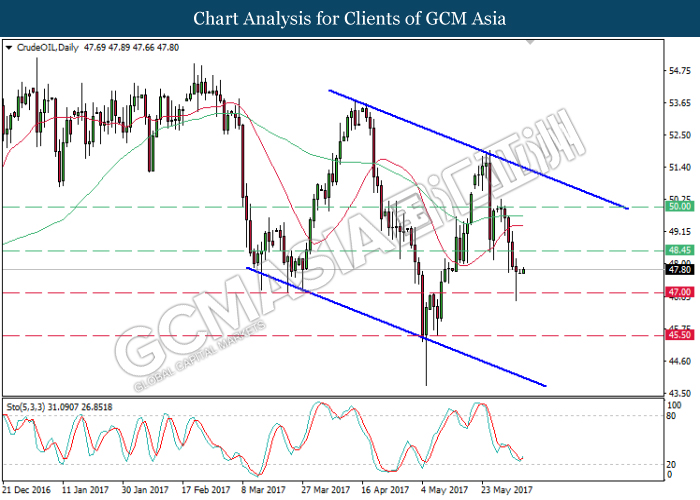
CrudeOIL, Daily: Crude oil price remained traded within a downward channel while recently rebounded from the support level of 47.00. The Stochastic Oscillator begins to illustrate rebound signal near the oversold region suggests crude oil price to be traded higher in short-term, towards the resistance level of 48.45.
Resistance level: 48.45, 50.00
Support level: 47.00, 45.50