7 June 2017 Daily Analysis
Risk-off sentiment ahead of risky super Thursday.
US dollar wobbles near seven-months low against its major peers with traders remained cautious ahead of Britain’s general election, European Central Bank (ECB) policy decision and testimony by former FBI Director James Comey. The dollar index eased 0.04% to 96.52 during early Asian trading hours. Greenback remained under pressure as previous bullish equities began to decline, with Wall Street shares pulling away from its recent record high while US Treasury yields slumped to seven-months low. Comey, whom is due to testify on Thursday was investigating whether Donald Trump’s presidential campaign colluded with Russia to sway the 2016 US election when he was fired by Trump in May. Investors are worried that his testimony could dampen the momentum for Trump’s economic agenda such as tax reform and larger fiscal spending. In the other region, euro was a shy off seven-months high and last quoted at $1.1270 while investors await to sift through President Mario Draghi’s statements for his view on EU zone economy outlook.
In the commodities, crude oil price dipped 0.35% to $48.02 as global fuel market remained oversupplied although rising tension in Middle East and decreasing US stockpiles lend some support. Otherwise, gold prices depreciate by 0.19% to $1,291.88 as some investors began to cash-in their profits after reaching seven-weeks high.
Today’s Holiday Market Close
Time Market Event
N/A
Today’s Highlight Events
Time Market Event
N/A
Today’s Highlight Economy Data
| Time | Nation & Data | Previous | Forecast | Actual |
| 09:30 | AUD – GDP (QoQ) (Q1) | 1.1% | 0.2% | 0.3% |
| 15:30 | GBP – Halifax House Price Index (MoM) (May) | -0.1% | -0.1% | – |
| 20:30 | CAD – Building Permits (MoM) (Apr) | -5.8% | – | – |
| 22:30 | Crude Oil – Crude Oil Inventories | -6.428M | -3.464M | – |
GBPUSD
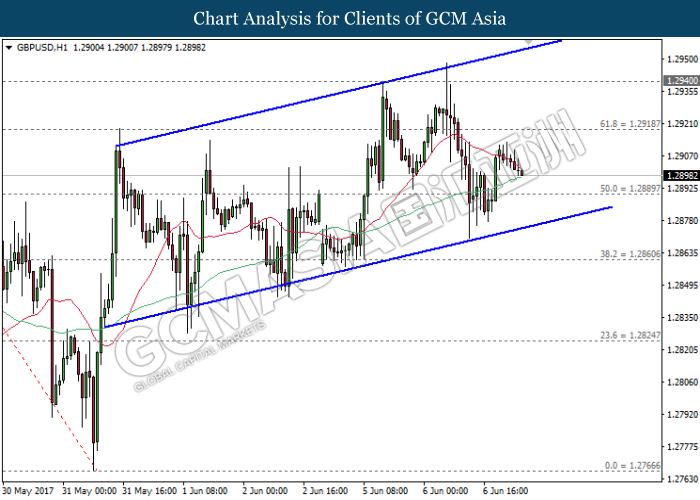
GBPUSD, H1: GBPUSD remained traded within an upward channel while recently retraced from the mid-level. A closure below the 60-moving average line (green) would suggest GBPUSD to advance further down, towards the target of support level at 1.2890 in short-term.
Resistance level: 1.2920, 1.2940
Support level: 1.2890, 1.2860
EURUSD
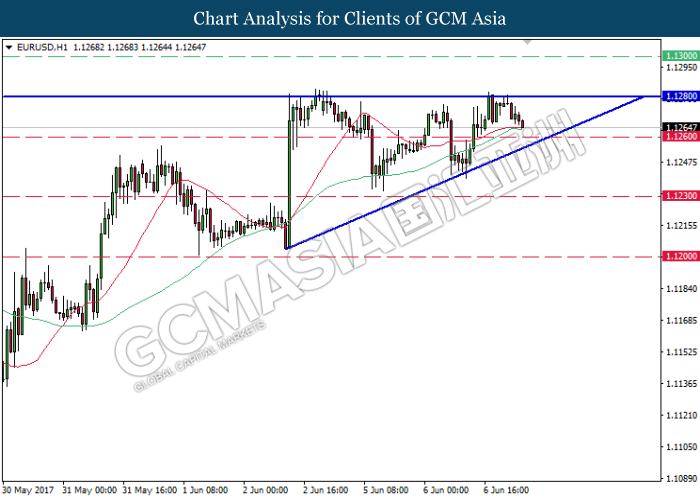
EURUSD, H1: EURUSD remained traded within an ascending triangle following prior retracement from the top level. It is suggested to move further down and test near the bottom level after breaking the support level of 1.1260. Any breakout from the bottom level of the triangle would signal a change in trend direction to move further downwards thereafter.
Resistance level: 1.1280, 1.1300
Support level: 1.1260, 1.1230, 1.1200
USDJPY
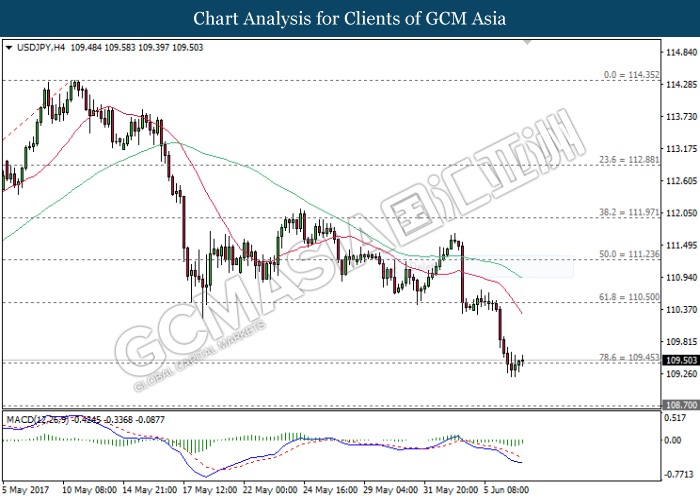
USDJPY, H4: USDJPY has pulled back from its recently decline while currently hovering near the support level of 109.45. MACD histogram which shows a diminishing downward momentum suggest USDJPY to be traded higher in short-term as technical correction. Otherwise, long-term trend direction still suggests USDJPY to move further down after breaking the support level of 109.45.
Resistance level: 110.50, 111.25
Support level: 109.45, 108.70
CrudeOIL
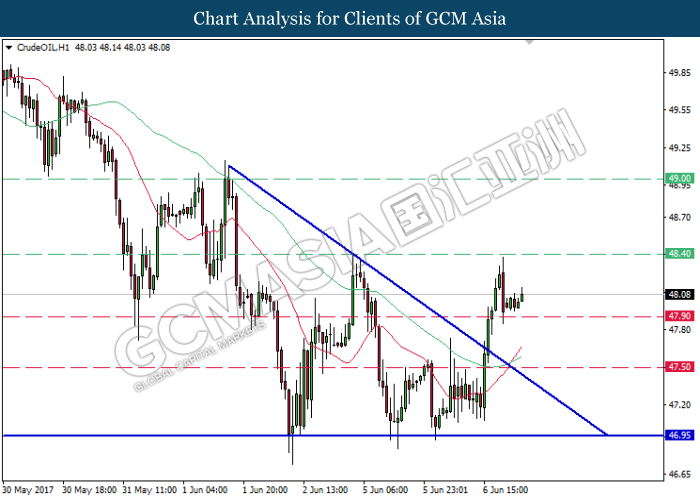
CrudeOIL, H1: Crude oil price has recently break out from the top level of descending triangle, signaling a change in trend direction to move further upwards. As both MA line continues to expand upwards after the formation of golden cross, crude oil price is suggested to advance and retest near the resistance level of 48.40.
Resistance level: 48.40, 49.00
Support level: 47.90, 47.50, 46.95
GOLD

GOLD_, H1: Gold price was traded lower following recent retrace from previous high of 1295.50. MACD indicator which hovers outside of upward momentum suggests gold price to be traded lower in short-term and head towards the target of support level at 1290.30 as technical corrections.
Resistance level: 1295.50, 1300.00
Support level: 1290.30, 1284.00