10 April 2017 Weekly Analysis
GCMAsia Weekly Report: April 10 – 14
Market Review (Forex): April 3 – 7
U.S. Dollar
The greenback rose against a basket of other major peers on Friday, shrugging off lower-than-expected US employment data as investors remained focused on Federal Reserve’s plans to tighten their monetary policy further. The dollar index was up 0.47% to 101.08, its highest level since March 15th. For the week, the dollar has added up 0.90%, it second consecutive weekly gain thus far.
Last Friday, the US Labour Department reported that US economy has added only 98,000 jobs for the month of March, lower than economist forecast for an addition of 180,000 jobs. Lower temperatures and harsh winter storms was accounted for the slowdown in jobs hiring. Concurrently, the unemployment rate has ticked down to a 10-year low of 4.5%, indicating an underlying strength of the labour market.
Initially, a large sell off was initiated following the weaker-than-expected employment reading. However, the dollar has managed to trim its losses after New York Fed President William Dudley said during Friday that the Fed plans to trim the balance sheets later which would prompt only a “little pause” in its rate hike plans.
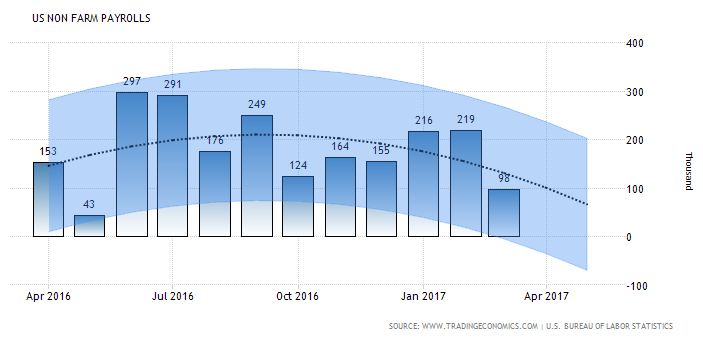
US Nonfarm Payrolls
—– Forecast
The US economy has added only 98,000 jobs during March, lower than market expectation of 180,000 jobs.
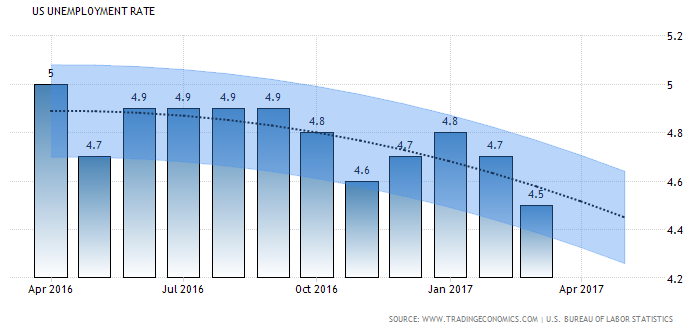
US Unemployment Rate
—–Forecast
US Unemployment rate was down 0.1% and currently stands at 4.5%, its level lowest in a decade.
USD/JPY
The safe haven yen gained initially, underpinned by higher risk aversion due to US cruise missile strikes on a Syrian air base. Otherwise, the pair was up 0.26% to 111.09.
EUR/USD
Euro was lower against the greenback with its pair down 0.50% to $1.0590.
GBP/USD
Great British Pound extended its losses, shedding 0.82% to $1.2366 following an unexpected fall in UK’s industrial output for the month of February.
Market Review (Commodities): April 3 – 7
GOLD
Gold price retreats from five-months high during late Friday as the stronger dollar weighed on the precious metal. Gold for June delivery settled up 0.21% at $1,255.95 after touching daily peak of $1,272.85 earlier. Price of the yellow metal surged after US launched dozens of cruise missiles to several targeted Syrian air bases in the aftermath of a suspected chemical weapon attacks.
However, the precious metal sheds its gains as the dollar rose despite of disappointing US employment data as investors shift their focus to Federal Reserve’s blueprint to tighten monetary policy further this year. In the case of a stronger dollar, gold’s appeal as an alternative asset will depreciate as it makes dollar-priced commodities more expensive for investors who holds other currencies.
Crude Oil
Oil futures settled higher for fourth consecutive session on Friday, extending its rally to its highest level in a month after US fired missiles to several targets at a Syrian government air base. However, oil price paired some gains in the latter session as concerns about a wider escalation in the region faded and US economic data weighed on global financial market. Crude oil price was up 54 cents and ended the week at $52.24 a barrel after touching a high of $52.94. For the week, it has added up $1.64 or 3.1%.
Crude oil price jumped overnight after two US destroyers fired 59 Tomahawk cruise missiles at a Syrian air base, in retaliation to Bashar al-Assad’s alleged use of chemical weapons against its civilians. However, analysts postulate that the initial appreciation was overdone given Syria’s role as a minor oil producers and after US official described the attack as one-off event.
Meanwhile, oil traders continued to focus on ongoing rebound of US shale industry, which would derail efforts by other producers to rebalance the global oil supply and demand. US Baker Hughes reported that the number of active US oil rigs rose by 10, to a total count of 672, its highest since September 2015.
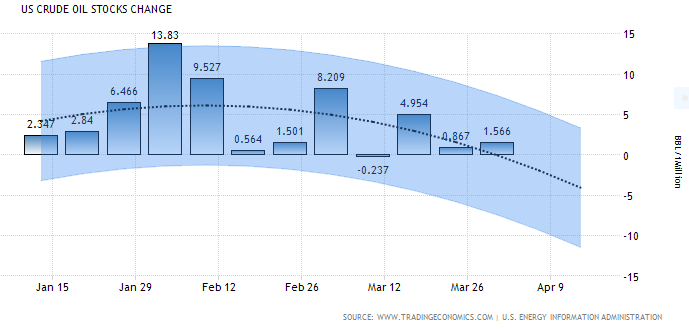
Earlier in the week, US Energy Information Administration reported that US oil inventories rose 1.566 million barrels, sending its total to an all-time high of 535.5 million. It was the 13th weekly build thus far, feeding higher concerns among investors towards the global oversupply glut.
U.S. Baker Hughes Oil Rig Count
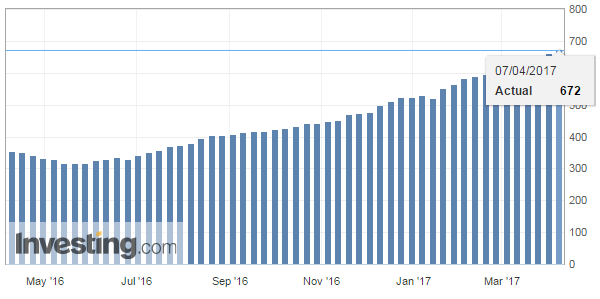
Active oil drilling rig in US has increased by 10 last week to a total of 672.
U.S. Crude Oil Stocks Change
—– Forecast
Energy Information Administration reported unexpected rise in US oil inventories by 1.566 million barrels last week.
Weekly Outlook: April 10 – 14
For the week, investors will be placing their focus on Monday as Fed Chair Janet Yellen bound to deliver her speech for fresh cues on the timing of the next US rate hike and plans to trim back the central bank’s balance sheet. Concurrently, traders would also be looking ahead to US data on retail sales and inflation on Friday, ahead of the long Easter weekend.
As for the oil market, investors will continue to eye on fresh weekly information regarding US stockpiles and active oil rig for further signals from their shale industry. In addition, investors will also anticipate for monthly reports from Organization of Petroleum Exporting Countries and International Energy Agency to gauge the global supply and demand levels.
Highlighted economy data and events for the week: April 10 – 14
| Monday, April 10 |
Data N/A
Events N/A
|
| Tuesday, April 11 |
Data AUD – NAB Business Confidence (Mar) GBP – CPI (YoY) (Mar) EUR – German ZEW Economic Sentiment (Apr) USD – JOLTs Job Openings (Feb) Crude Oil – API Weekly Crude Oil Stock
Events USD – Fed Chair Yellen Speaks
|
| Wednesday, April 12 |
Data CNY – CPI (YoY) (Mar) CNY – PPI (YoY) (Mar) GBP – Average Earnings Index +Bonus (Feb) GBP – Claimant Count Change (Mar) CAD – BoC Interest Rate Decision Crude Oil – Crude Oil Inventories
Events GBP – BoE Gov Carney Speaks Crude Oil – OPEC Monthly Report CAD – BoC Monetary Policy Report CAD – BoC Gov Poloz Speaks
|
| Thursday, April 13 |
Data AUD – Employment Change (Mar) CNY – Trade Balance (USD) (Mar) USD – Initial Jobless Claims USD – PPI (MoM) (Mar) CAD – Manufacturing Sales (MoM) (Feb) CAD – New Housing Price Index (MoM) (Feb) USD – Michigan Consumer Sentiment (Apr) Crude Oil – U.S. Baker Hughes Oil Rig Count
Events Crude Oil – IEA Monthly Report
|
|
Friday, April 14
|
Data USD – Core CPI (MoM) (Mar) USD – Core Retail Sales (MoM) (Mar) USD – Retail Sales (MoM) (Mar)
Events N/A
|
Technical weekly outlook: April 10 – 14
Dollar Index
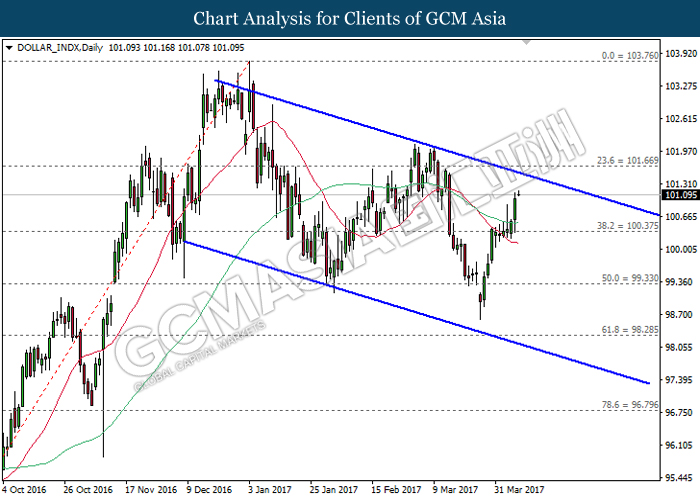
DOLLAR_INDX, Daily: The dollar index extended its gains following prior rebound from the support level of 100.40. It is expected to advance further upwards and retest near the top level of the downward channel. A breakout from this level would signal a change in trend direction to move further upwards thereafter.
Resistance level: 101.65, 103.75
Support level: 100.40, 99.35
GBPUSD
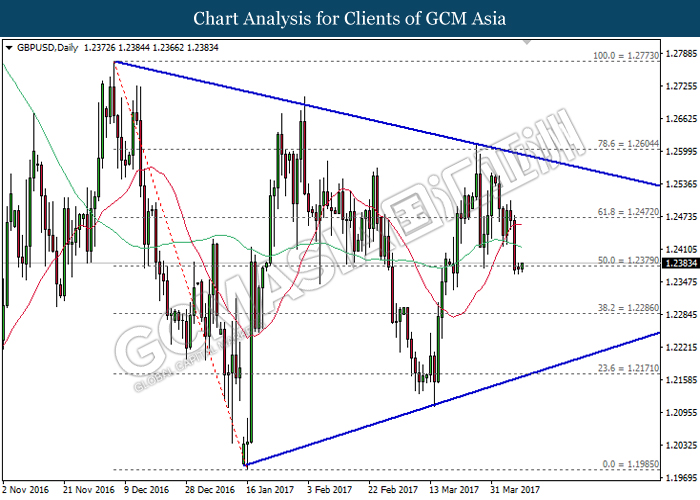
GBPUSD, Daily: GBPUSD remains traded within a narrowing triangle following prior retracement and closure below both moving average line while currently testing near the resistance level of 1.2380. A retrace from this level would suggest GBPUSD to advance further down, towards the lower level of the triangle.
Resistance level: 1.2380, 1.2470
Support level: 1.2285, 1.2170
USDJPY
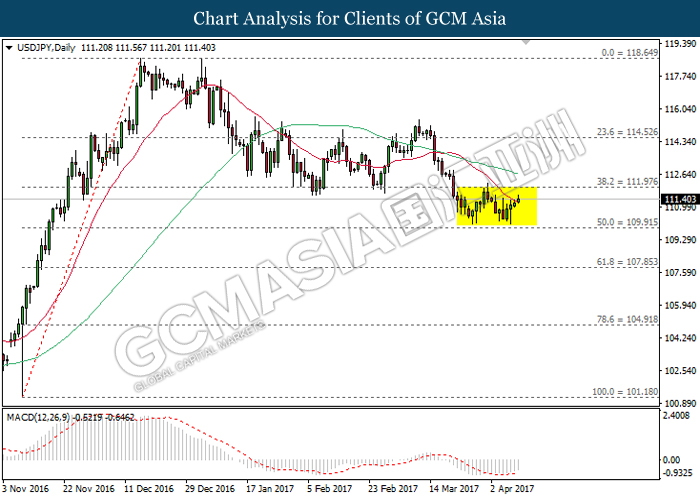
USDJPY, Daily: USDJPY remains traded within a trading range following prior rebound near the support level of 109.90. With regards to the MACD indicator which continues to drift outside of downward momentum, USDJPY is expected to extend its retracement period in the short-term. Long-term trend direction could only be determined after a successful breakout from either side of the range.
Resistance level: 112.00, 114.50
Support level: 109.90, 107.85
EURUSD
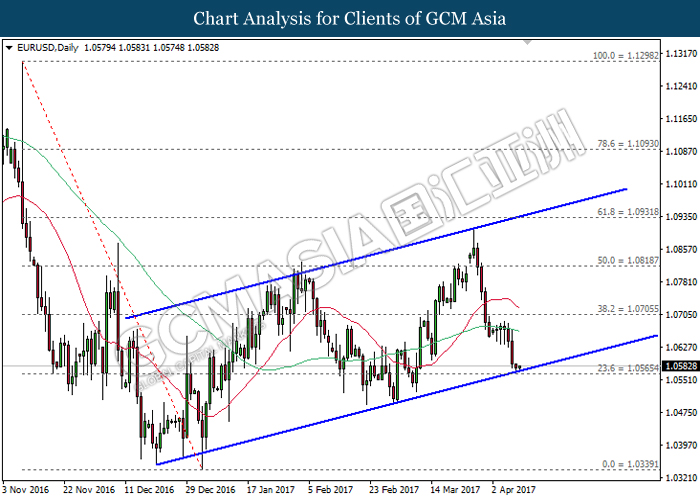
EURUSD, Daily: EURUSD remains traded within an upward channel while currently testing at the bottom level of the channel, near the support level of 1.0565. A breakout from this level would signal a change in trend direction to move further downwards thereafter. Otherwise, a rebound from this level would suggest EURUSD to be traded higher within the upward channel in short-term.
Resistance level: 1.0705, 1.0820
Support level: 1.0565, 1.0340
GOLD
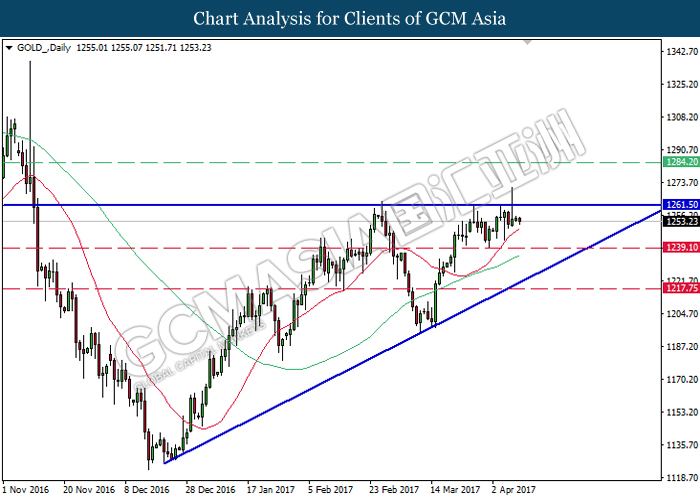
GOLD_, Daily: Gold price was traded within an ascending triangle following prior retracement from the strong resistance level of 1261.50. Referring to both moving average line which continues to expand further upwards, gold price is suggested to advance further up and retest near the resistance level of 1261.50. A breakout from the top level of ascending triangle would signal a change in trend direction to move further upwards thereafter.
Resistance level: 1261.50, 1284.20
Support level: 1239.10, 1217.75
Crude Oil
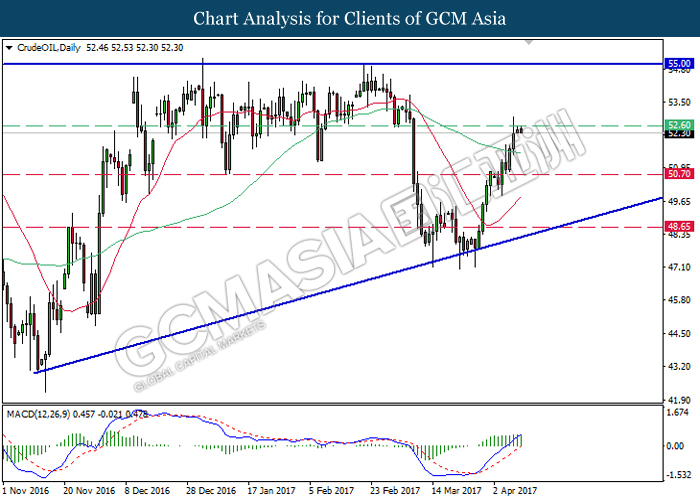
CrudeOIL, Daily: Crude oil price remains traded within an ascending triangle following prior rebound from the bottom level of the triangle. With regards to the MACD histogram which continues to illustrate moderate upward signal and momentum, crude oil price is expected to extend its upward momentum after a successful closure above the resistance level of 52.60.
Resistance level: 52.60, 55.00
Support level: 50.70, 48.65