11 August 2017 Daily Analysis
Overnight’s PPI bruises, next CPI in focus.
US dollar dipped against other major peers on Friday as the tension between Pyongyang and Washington continues to escalate while coupled with soft inflation and jobs data. The dollar index ticked down 0.04% to 93.22 as of writing. According to the Labor Department, producer price index fell by 0.1% in July, notching its first decline since last August while spurring higher pessimism among market participants. In addition, initial claims for state unemployment benefits was increased by 3,000 to a seasonally adjusted total of 244,000. Economist forecasted to remain unchanged at 240,000. The weaker-than-expected economic docket came prior to a speech given by New York Fed President William Dudley whom suggested that the central bank is still on track for another rate hike this year. Also weighing on the greenback was continued escalation of geopolitical uncertainty after North Korea threatened to launch missile attack at Guam. Against other major peers, pair of USD/JPY was down 0.11% to 109.07 while EUR/USD remains unchanged at $1.1772.
Otherwise, crude oil price depreciates by 0.14% to $48.52 as global supply glut continues to haunt the market despite a larger-than-expected draw in US crude inventories. On the other hand, gold price rose 0.26% to $1,287.03 following higher tension in the Korean peninsula.
Today’s Holiday Market Close
Time Market Event
All Day JPY Japan – Mountain Day
Today’s Highlight Events
Time Market Event
Tentative CrudeOIL IEA Monthly Report
21:40 USD FOMC Member Kaplan Speaks
23:30 USD FOMC Member Kashkari Speaks
Today’s Highlight Economic Data
| Time | Nation & Data | Previous | Forecast | Actual |
| 14:00 | EUR – German CPI (MoM) (Jul) | 0.4% | 0.4% | – |
| 20:30 | USD – Core CPI (MoM) (Jul) | 0.1% | 0.2% | – |
| 01:00 | CrudeOIL – US Baker Hughes Oil Rig Count | 765 | – | – |
GBPUSD
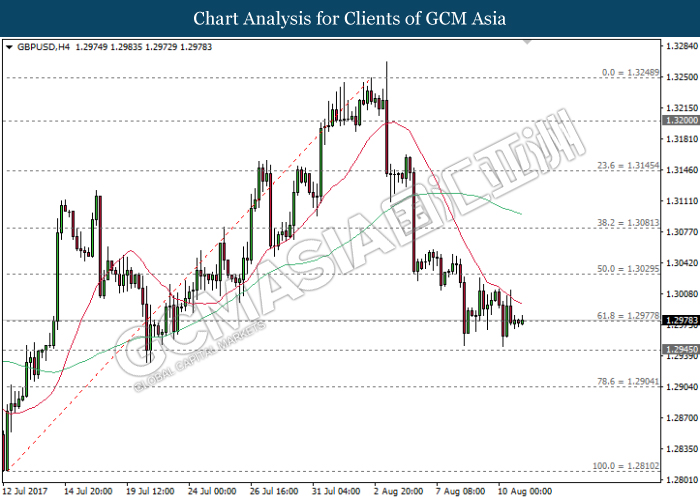
GBPUSD, H4: GBPUSD was traded lower following prior retracement from the 20-MA line (red). Both MA lines which continues to expand downwards suggest ongoing downside bias towards the next target support level of 1.2945.
Resistance level: 1.2980, 1.3030
Support level: 1.2945, 1.2905
EURUSD
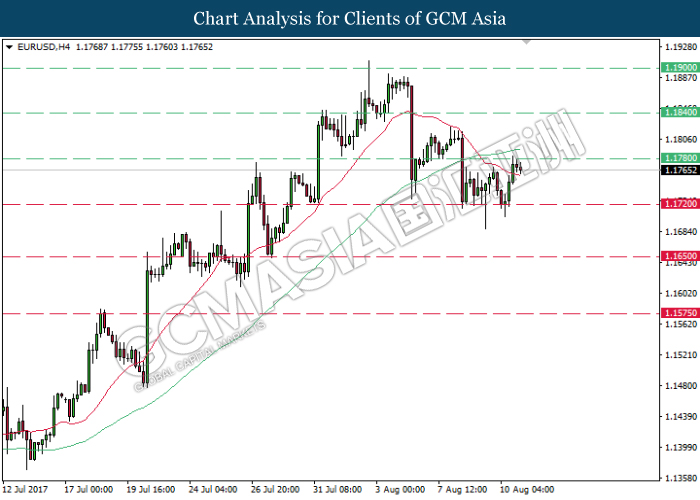
EURUSD, H4: EURUSD was traded lower following prior retracement from the resistance level of 1.1780. A successful closure below the 20-MA line (red) would suggest EURUSD to extend its losses towards the next target at 1.1720.
Resistance level: 1.1780, 1.1840, 1.1900
Support level: 1.1720, 1.1650, 1.1575
USDJPY
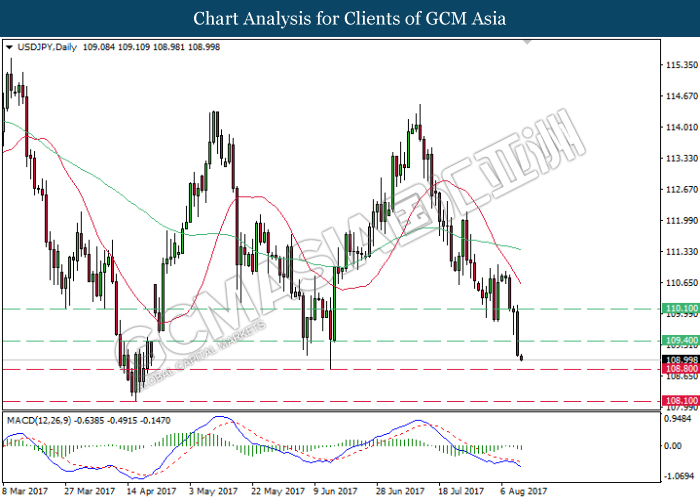
USDJPY, Daily: USDJPY was traded lower following prior closure below the strong support level at 109.40. MACD histogram which illustrates ongoing negative divergence suggests USDJPY to advance further down towards the support level of 108.80.
Resistance level: 109.40, 110.10
Support level: 108.80, 108.10
CrudeOIL
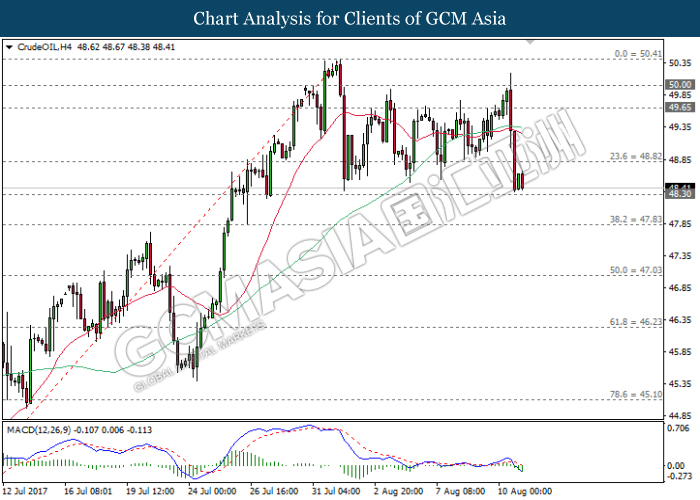
CrudeOIL, H4: Crude oil price was traded lower following prior retracement while concurrently closing below both MA lines. MACD histogram which illustrates negative divergence suggests crude oil price to move further down after breaking the support level of 48.30.
Resistance level: 48.80, 49.65
Support level: 48.30, 47.85
GOLD
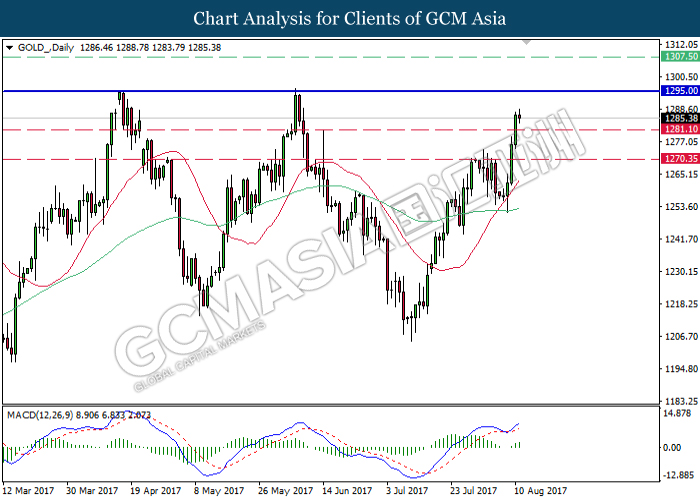
GOLD_, Daily: Gold price extended gains following prior formation of golden cross by both moving average line. MACD histogram which illustrates positive divergence signal suggests gold price to extend its upward momentum and retest near the strong resistance level of 1295.00.
Resistance level: 1295.00, 1307.50
Support level: 1281.10, 1270.35