13 July 2018 Daily Analysis
Dollar-bull sedated amid muted inflation.
Greenback extended gains on yesterday although recent US consumer prices rise slower than expected. The dollar index tacks up 0.11% while last quotes around 94.50 during early Asian trading session. According to the Labor Department, Consumer Price Index for the month of June rose only 0.1%, missing economists forecast for a rise of 0.2%. However, the data failed to dent market optimism towards greenback as ongoing tit-for-tat trade tariffs could increase the pace of domestic inflationary pressure. In addition, greenback received further bullish support after Initial Jobless Claims for last week decreased to 214,000 individuals, confounding economist forecast of 226,000. On the other hand, GBP/USD extended its losses by 0.23% to $1.3175 amid ongoing woes with regards to Brexit. Numerous lawmakers criticized the recently published Brexit White Paper, arguing that it will not be beneficial to the UK while stoking higher pessimism towards PM Theresa May’s negotiation strategy.
In the commodities market, crude oil price tumbled down 0.31% to $70.20 per barrel as traders weighs the impact of increase oil supply from Libya against major oil producers that may struggle to prevent global supply shortage. Otherwise, gold prices were down by 0.05% to $1,246.49 a troy ounce following recent appreciation of the US dollar.
Today’s Holiday Market Close
Time Market Event
N/A
Today’s Highlight Events
Time Market Event
00:30 USD FOMC Member Bostic Speaks
Today’s Highlight Economy Data
| Time | Nation & Data | Previous | Forecast | Actual |
| Tentative | CNY – Trade Balance (USD) (Jun) | 24.92B | 27.90B | – |
| 20:30 | USD – Import Price Index (MoM) (Jun) | 0.6% | 0.1% | – |
| 22:00 | USD – Michigan Consumer Sentiment (Jul) | 98.2 | 98.1 | – |
| 01:00 | CrudeOIL – US Baker Hughes Oil rig Count | 858 | – | – |
GBPUSD
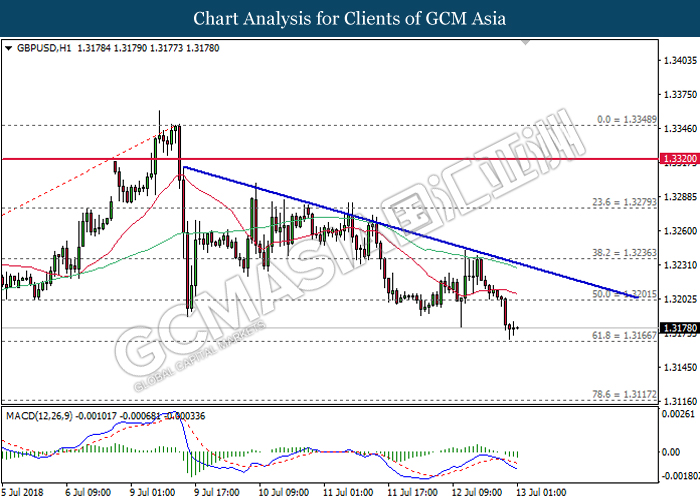
GBPUSD, H1: GBPUSD extended its losses following prior retracement from the bearish trendline. MACD histogram which illustrate bearish signal suggests the pair to advance further down after breaking the support level of 1.3165.
Resistance level: 1.3200, 1.3235
Support level: 1.3165, 1.3120
EURUSD
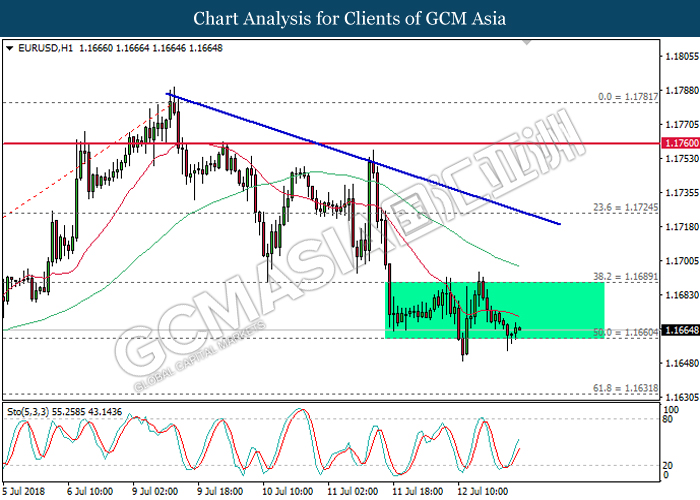
EURUSD, H1: EURUSD remains traded within a tight range that are subjected to 1.1660 and 1.1690. Stochastic Oscillator which illustrate rebound signal from the oversold region suggests the pair to be traded higher in short-term. Long-term trend direction can only be determined following a successful breakout from either side of the range.
Resistance level: 1.1690, 1.1725
Support level: 1.1660, 1.1630
USDJPY
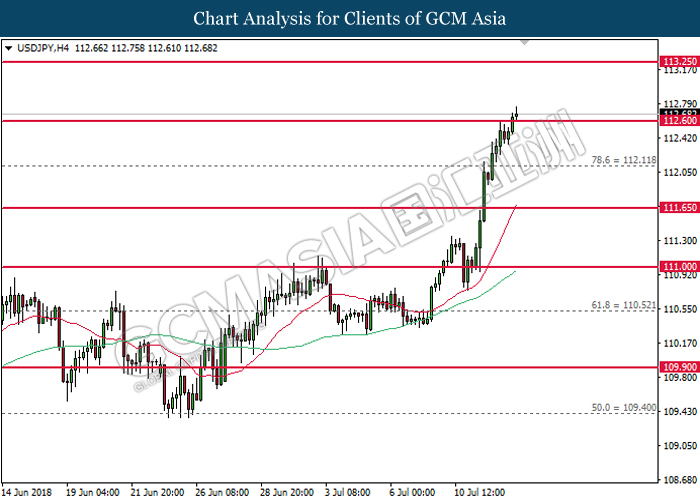
USDJPY, H4: USDJPY advanced further up following prior breakout at the resistance level of 112.60. Both MA line which continues to expand upwards suggests the pair to extend its gains, towards the direction of resistance level at 113.25.
Resistance level: 113.25, 114.15
Support level: 112.60, 112.10
CrudeOIL
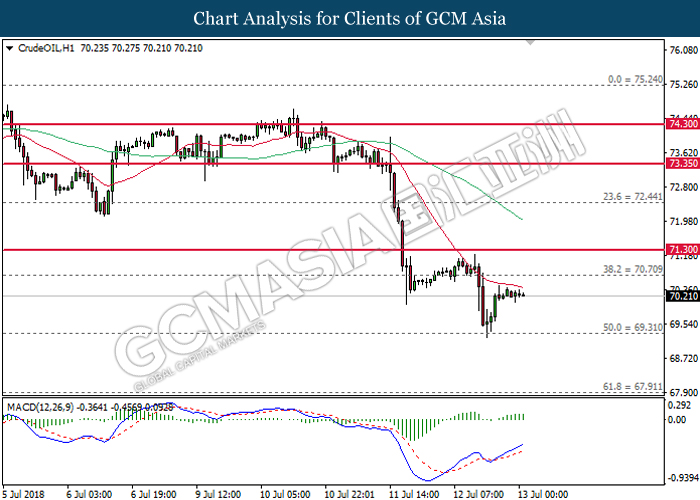
CrudeOIL, H1: Crude oil price was traded higher following prior rebound from the support level of 69.30. However, MACD histogram which illustrate diminishing upward momentum may suggest the commodity price to resume its bearish bias following a retracement from the 20-MA line (red).
Resistance level: 70.70, 71.30
Support level: 69.30, 67.90
GOLD
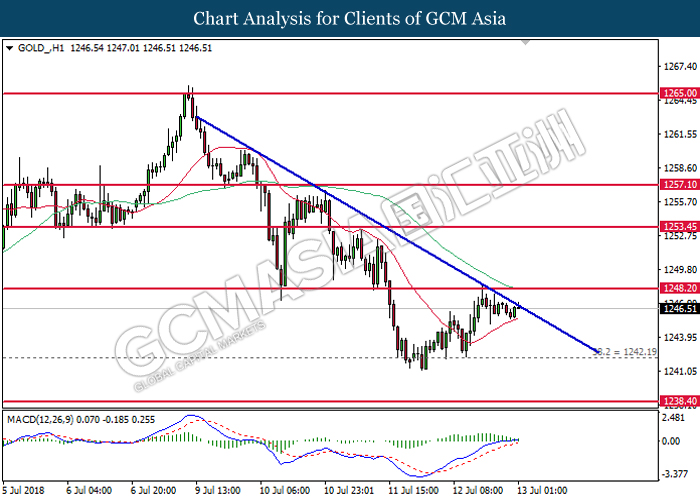
GOLD_, H1: Gold price was traded lower following prior retrace from the bearish trendline. MACD histogram which illustrate diminishing upward momentum suggests the commodity price to extend its losses after closing below the 20-MA line (red).
Resistance level: 1248.20, 1253.45
Support level: 1242.20, 1238.40