15 May 2018 Daily Analysis
Greenback rebounds following a rising U.S. bond yields.
Greenback was traded higher against a basket of major currencies by 0.1% to 92.45 following an uptick in U.S. bond yields as U.S. – China trade tensions eased. Overnight, the benchmark 10-year U.S. Treasury yield rose 2 basis points to 2.999% in the wake of U.S. President Donald Trump’s pledge to help Chinese telecommunications company namely ZTE Corp. The latter was being penalized for violating U.S. sanctions with Iran. The rise in U.S. Treasury yields highlighted wide interest rate gap between the U.S. and the other developed countries which has led to an overall optimistic market outlook towards a stronger dollar in near future. On the contrary, USD/CAD fell 0.20% to $1.2764 following recent surge in the oil prices attributed to a bullish outlook of the OPEC report released yesterday.
In the commodities market, crude oil price extended gains by 26 cents to $71.03 per barrel after OPEC monthly report has shown a fall of oil inventories in developed nations by 9 million barrels, implying its strong compliance with the output cut agreement. Otherwise, gold price fell by 0.30% to $1314.04 a troy ounce amid an uptick in U.S. bond yields.
Today’s Holiday Market Close
Time Market Event
N/A
Today’s Highlight Events
Time Market Event
09:30 AUD RBA Meeting Minutes
17:00 GBP Inflation Report Hearings
Today’s Highlight Economy Data
| Time | Nation & Data | Previous | Forecast | Actual |
| 10:00 | CNY – Industrial Production (YoY) (Apr) | 6.0% | 6.4% | – |
| 10:00 | CNY – Retail Sales (YoY) (Apr) | 10.1% | 10.0% | – |
| 14:00 | EUR – German GDP (QoQ) (Q1) | 0.6% | 0.4% | – |
| 16:30 | GBP – Average Earnings Index + Bonus (Mar) | 2.8% | 2.7% | – |
| 16:30 | GBP – Claimant Count Change (Apr) | 11.6K | 13.3K | – |
| 16:30 | GBP – Unemployment Rate (Mar) | 4.2% | 4.2% | – |
| 17:00 | EUR – German ZEW Economic Sentiment (May) | -8.2 | -8.0 | – |
| 17:00 | EUR – GDP (QoQ) (Q1) | 0.4% | 0.4% | – |
| 17:00 | EUR – ZEW Economic Sentiment | 1.9 | 2.0 | – |
| 20:30 | USD – Core Retail Sales (MoM) (Apr) | 0.2% | 0.5% | – |
| 20:30 | USD – Retail Sales (MoM) (Apr) | 0.6% | 0.4% | – |
| 22:00 | USD – Business Inventories (MoM) (Apr) | 0.6% | 0.2% | – |
| 04:30 | CrudeOIL – API Weekly Crude Oil Stock | -1.850M | – | – |
GBPUSD
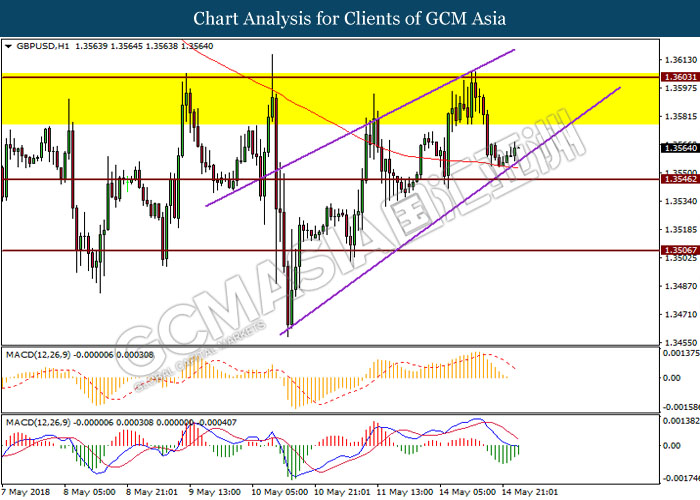
GBPUSD, H1: GBPUSD was traded higher prior rebound from 200-MA line within an ascending wedge. MACD signal line that hovers above the neutral line would suggest bullish bias for the pair yet a golden-signal is required to verify the indication.
Resistance level: 1.3600, 1.3660
Support level: 1.3550, 1.3500
EURUSD
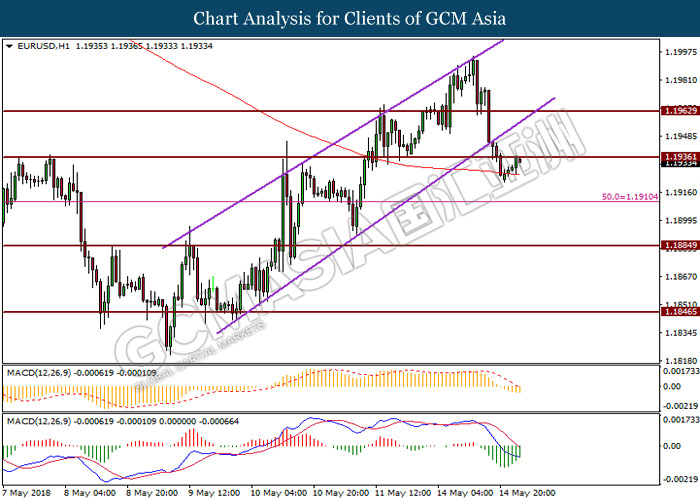
EURUSD, H1: EURUSD was traded higher prior rebound from 200-MA line. An upward twist of MACD signal line would suggest the pair on bullish bias yet a breakout above the resistance level at 1.1940 is required to verify the signal.
Resistance level: 1.1940, 1.1960
Support level: 1.1910, 1.1880
USDJPY
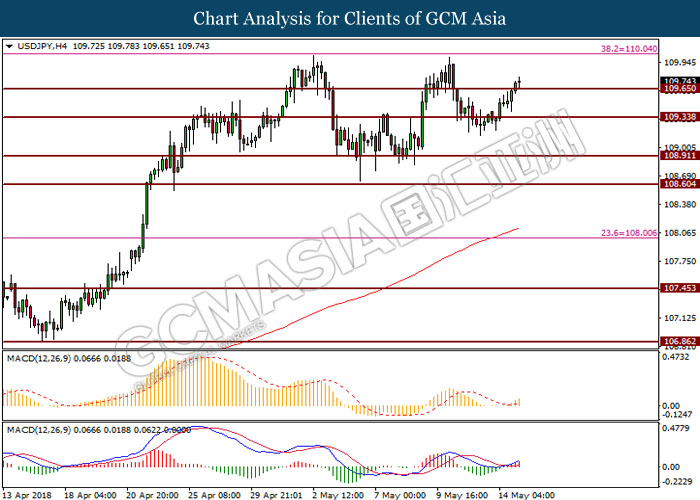
USDJPY, H4: USDJPY was traded higher prior breaking resistance level at 109.60. Golden-cross as displayed by MACD signal line would suggest the pair to extend its gains towards the next resistance level at 110.00 if current candlestick successfully closes above its previous high.
Resistance level: 110.00, 110.40
Support level: 109.60, 109.30
CrudeOIL
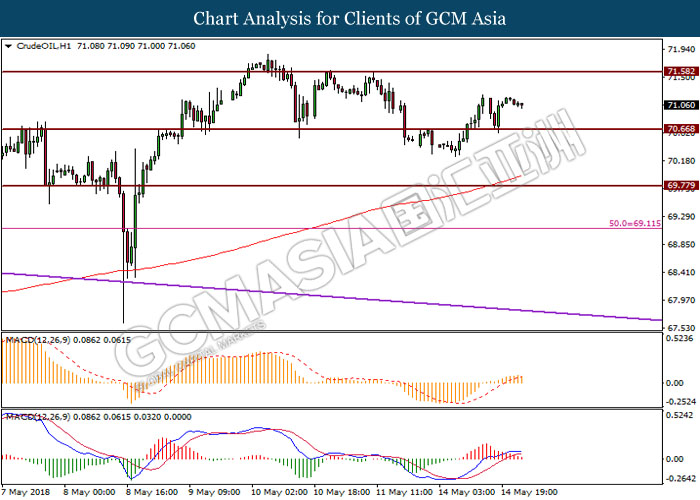
CrudeOIL, H1: Crude oil price was traded higher prior rebound from support level at 70.65. However, MACD signal line that is about to form a death-cross would suggest the pair to undergo short-term technical correction to trade lower to retest its previous high.
Resistance level: 71.60, 73.60
Support level: 70.65, 69.75
GOLD
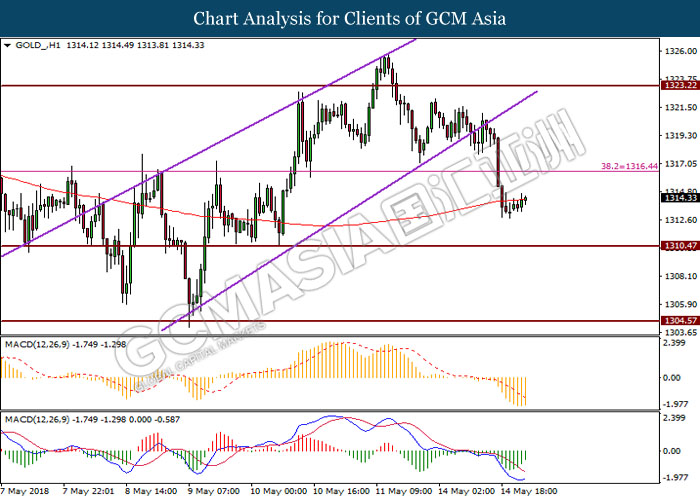
GOLD_, H1: Gold price was traded lower after breaking 200-MA line. However, MACD signal line that hovers upward would suggest the safe-haven asset price to undergo short-term technical correction to trade higher if candlestick successfully closes above the MA line.
Resistance level: 1316.40, 1323.20
Support level: 1310.50, 1304.60