17 July 2018 Daily Analysis
Low-spirited dollar awaits Powell’s speech.
Greenback extended its losses on yesterday while US economic data that are in line with economist forecast did little to cap its bearish momentum. The dollar index was down 0.25% to 94.20 during early Asian trading session. According to US Commerce Department, Core Retail Sales for the month of June came in within economist expectation with 0.4% while the reading for the month of May was revised higher to 1.3%. On the other hand, although Empire State Manufacturing Index fell by 2.4 points, its reading was well above economist forecast of 22.00 with 22.60 for the month of July. However, dollar bulls remained subdued since the start of the week as they await further clues on US monetary policy when Federal Reserve Chair Jerome Powell testifies before the US Senate Banking Committee later tonight. Otherwise, pair of GBP/USD tacks up 0.01% to $1.3235 ahead of a series of data bound to be released within this week. Investors will place their attention on major economic release from Britain to gauge the prospect of an August interest rate hike from the Bank of England.
As for commodities market, crude oil price settled down more than 4% to $66.95 per barrel after Iraq crude exports reportedly rose 6% to 4.05 million barrels per day in the first half of July. Otherwise, gold price threaded lower by 0.03% to $1,240.61 a troy ounce while investors place their attention over the imminent speech by Fed Chair Jerome Powell scheduled later tonight.
Today’s Holiday Market Close
Time Market Event
N/A
Today’s Highlight Events
Time Market Event
09:30 AUD RBA Meeting Minutes
16:00 GBP BoE Gov Carney Speaks
22:00 USD Fed Chair Powell Testifies
Today’s Highlight Economic Data
| Time | Nation & Data | Previous | Forecast | Actual |
| 06:45 | NZD – GDP (QoQ) (Q2) | 0.5% | 0.5% | 0.4% |
| 16:30 | GBP – Average Earnings Index +Bonus (May) | 2.5% | 2.5% | – |
| 16:30 | GBP – Claimant Count Change (Jun) | -7.7K | 2.3K | – |
| 20:30 | CAD – Manufacturing Sales (MoM) (May) | -1.3% | 0.5% | – |
| 21:15 | USD – Industrial Production (MoM) (Jun) | -0.1% | 0.5% | – |
| 04:30 | CrudeOIL – API Weekly Crude Oil Stock | -6.796M | – | – |
GBPUSD
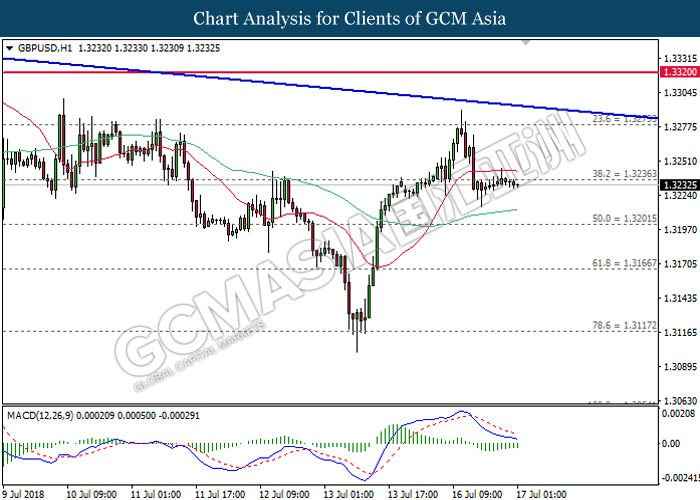
GBPUSD, H1: GBPUSD was traded lower following prior retracement from the resistance level at 1.3280. However, MACD histogram which illustrate bearish signal suggests the pair to extend its losses after closing below the 60-MA line (green).
Resistance level: 1.3235, 1.3280
Support level: 1.3200, 1.3165
EURUSD
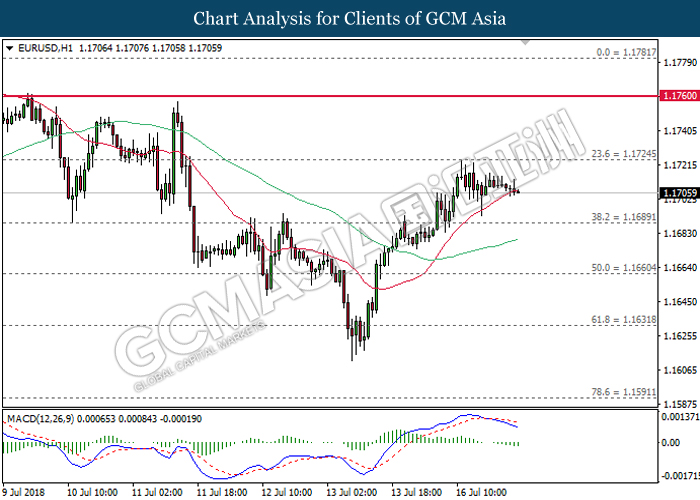
EURUSD, H1: EURUSD was traded lower following prior retracement from the resistance level at 1.1725. MACD histogram which begins to form a bearish signal suggests the pair to extend its losses after closing below the 20-MA line (red).
Resistance level: 1.1725, 1.1760
Support level: 1.1690, 1.1660
USDJPY
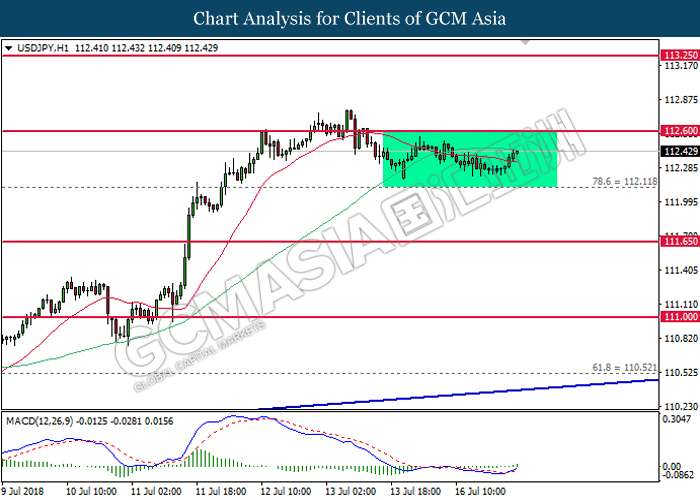
USDJPY, H1: USDJPY was traded higher following prior rebound from the bottom level of the range near 112.10. MACD histogram which illustrate bullish signal suggests the pair to be traded higher in short-term. Otherwise, long-term trend direction can only be determined following a successful breakout from either side of the range.
Resistance level: 112.60, 113.25
Support level: 112.10, 111.65
CrudeOIL
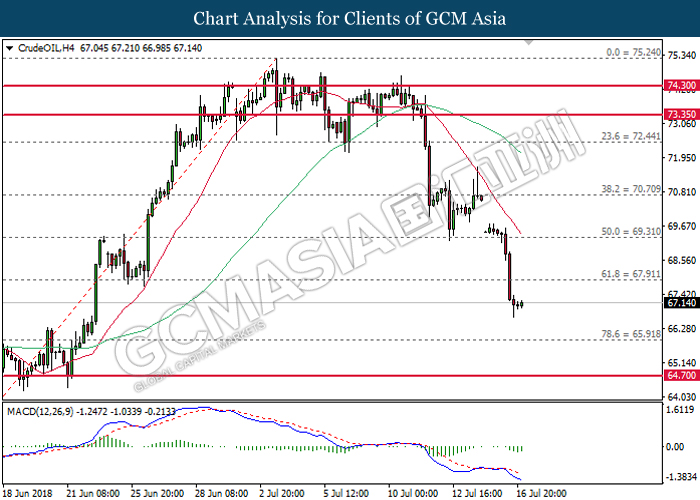
CrudeOIL, H4: Crude oil price extended its losses following prior breakout from the support level near 67.90. However, MACD histogram which illustrate diminishing downward momentum suggests the commodity price to be traded higher in short-term as technical correction before extending its losses.
Resistance level: 67.90, 69.30
Support level: 65.90, 64.70
GOLD
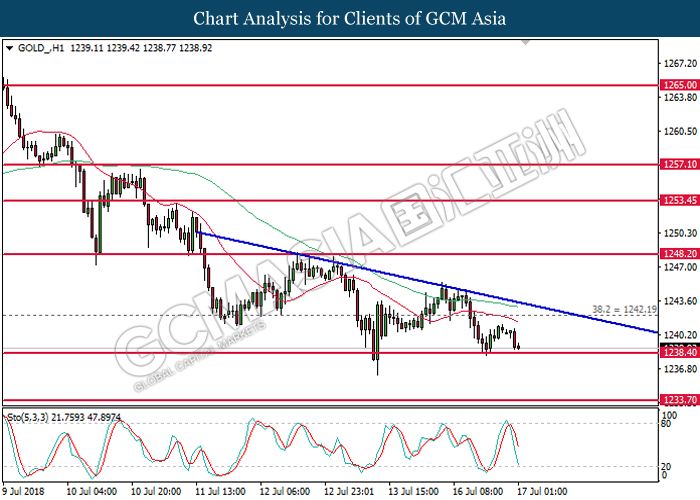
GOLD_, H1: Gold price remains traded within a descending triangle while recently retraced from the mid-level. Stochastic Oscillator which illustrate a retracement signal from the overbought regions suggests gold price to be traded lower. However, a break below 1238.40 is required to validate such bias.
Resistance level: 1242.20, 1248.20
Support level: 1238.40, 1233.70