19 June 2017 Weekly Analysis
GCMAsia Weekly Report: June 19 – 23
Market Review (Forex): June 12 – 16
U.S. Dollar
Greenback slipped against a basket of other major peers on Friday following weak US housing and consumer sentiment data that has backed bets for a slower pace of interest rate hikes from the Federal Reserve. The dollar index was down 0.3% to 97.14 during late Friday trading. It has ended the week with roughly 0.1% of loss.
US homebuilding fell for a third consecutive month in May to its lowest level in eight months which suggest that subdued housing activity may dent economic growth for the second quarter. In a separate report, University of Michigan reported that its consumer sentiment fell to 94.5 in June from 91.1 in May. Analyst expected for a reading of 97.1.
Previously, the US dollar rose to more than a two-weeks high on Thursday after Federal Reserve raised interest rates as widely expected while maintaining their outlook to go ahead with another rate hike by year-end. In addition, the central bank has provided more details about their plans to reduce its massive $4.5 trillion balance sheet.
Despite the relatively hawkish signals, market participants remained doubtful over central bank’s ability to raise its benchmark rates by year end due to a series of disappointing US economic data.
US Building Permits

—– Forecast
Number of building permits issued declined to 1.168 million for the month of May.
US Consumer Sentiment
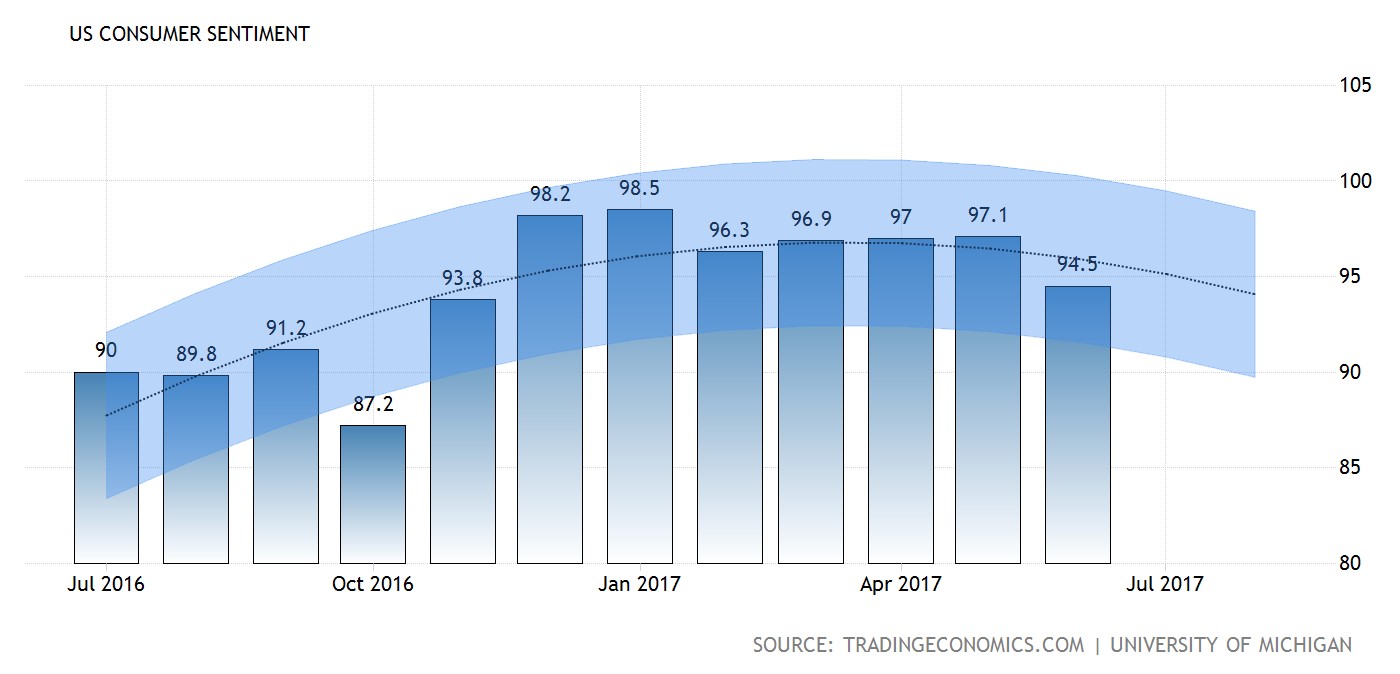
—– Forecast
Consumer sentiment was down to 94.5 for the month of June.
US Fed Funds Rate
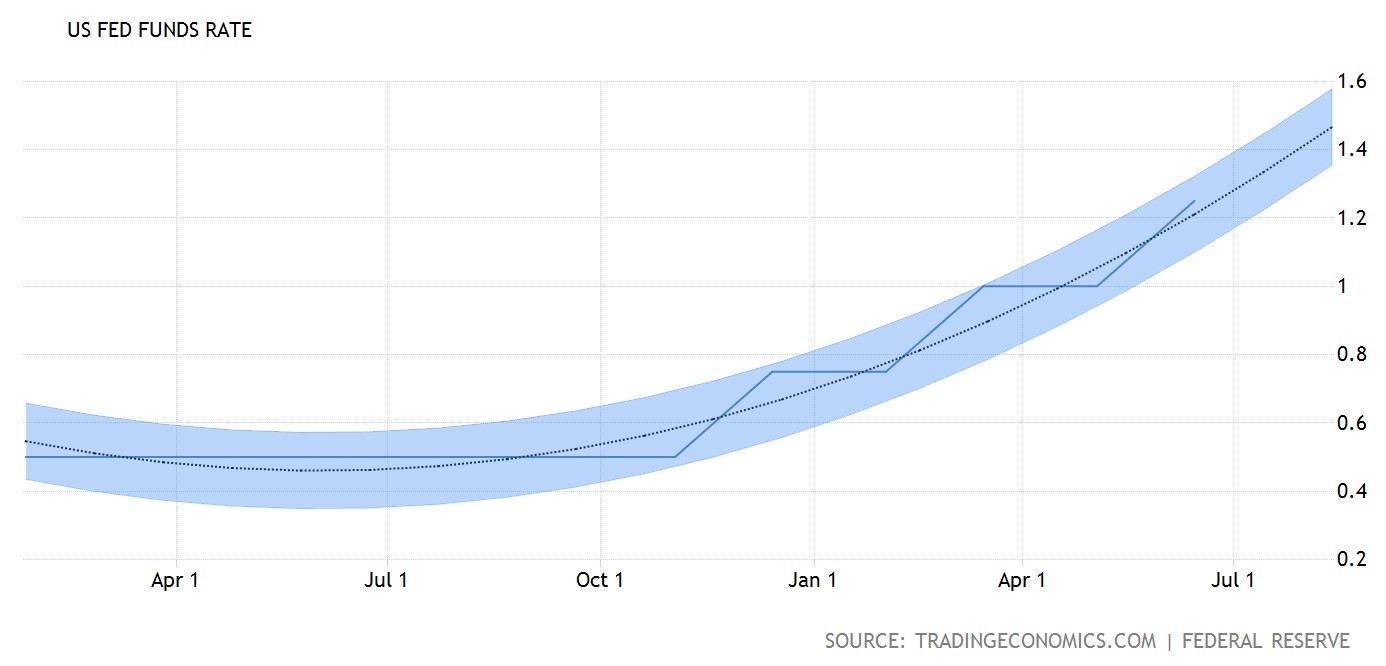
—– Forecast
US interest rates were increased by 25 basis points to 1.25%.
USD/JPY
Pair of USD/JPY was traded flat at 110.91 on Friday.
EUR/USD
Euro rose 0.46% to $1.1197 against the greenback after EU zone’s 19 finance minister backed for a payout for €8.5 billion to Greece in order to pull the country from a default and avert its debt crisis.
GBP/USD
Pound sterling inches higher on Friday, up 0.18% to $1.2780. It remained supported with higher expectations that Bank of England may alter its stance on low interest rates due to increasing number of its members voted in favor for a rate hike on Thursday.
Market Review (Commodities): June 12 – 16
GOLD
Gold prices ended higher on Friday albeit recording its second weekly losses after Federal Reserve hiked their benchmark rates while maintaining its plans to go ahead with another rate hike by year-end. Price of the yellow metal was up 0.2% and closed the week at $1,256.50 a troy ounce after having touch its lowest level since May 24th at $1,252.70 last Thursday. For the week, it has suffered a loss of $13.20 or 1.2%. Likewise, the Fed Rate Monitor Tool is currently showing a 15% for a rate hike in September and 35% chance for December.
Generally, gold price and dollar moves in opposite directions, whereby a weaker dollar would boost the appeal of gold as an alternative asset to investors who uses currencies other than the greenback. Likewise, gold price is sensitive to rising interest rates where it could lift the opportunity cost of holding non-yielding asset.
Crude Oil
Oil futures settled a tad higher while suffering its fourth weekly losses as the market remained pessimist over rising US drilling activity on the backdrop of ongoing efforts by other major producers to cut output and rebalance the oil price. Crude oil price inched up 0.6% and ended at $44.74 a barrel. For the week, it has suffered a loss of $1.13 or 2.4% thus far which marks the longest weekly loss streak since August 2015.
Investors are concerned that ongoing rebound in US shale production could derail efforts of other producers in reducing global supply glut that has plagued the market for more than two years. Data from energy services company Baker Hughes showed that US drillers has added 6 rigs last week to a total of 747, extending its year-long drilling recovery to its highest level since April 2015.
Last month, OPEC and other non-OPEC producers has extended a deal to cut 1.8 billion barrels per day in supply until March 2018. However, the production-cut agreement has yet to show its impact on global inventories level due to rising supply from non-participants such as Libya, Nigeria and the US.
U.S. Baker Hughes Oil Rig Count
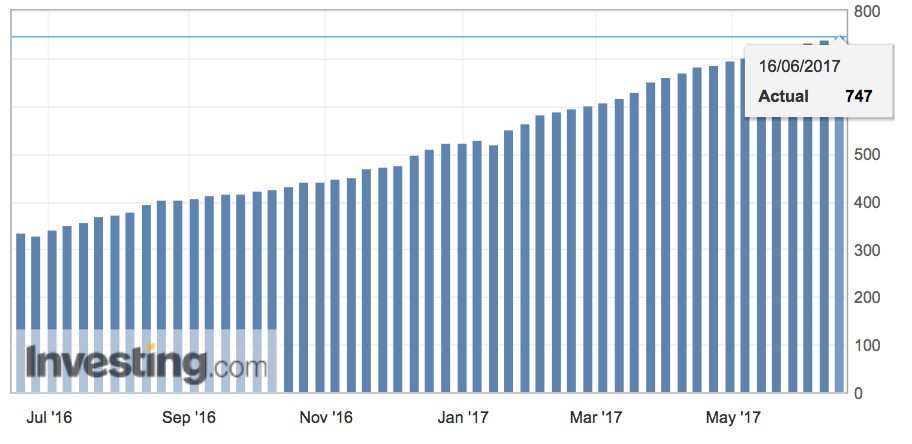
Active oil drilling rig in US was increased by 6 last week to a total of 747 thus far.
Weekly Outlook: June 19 – 23
For the week ahead, market players will be focusing on a handful of Federal Reserve speakers as they look for more cues on future monetary policy outlook. In Europe, market players will be eagerly waiting for the start of Brexit negotiations between Britain and European Union. They will also focus on flash survey data on EU zone business activity for fresh clues on the region’s manufacturing and services sector performance.
As for oil traders, they will keep an eye on fresh weekly information on US stockpiles for crude and refined products due Tuesday and Wednesday to gauge the strength of demand from world’s largest oil consumer. Likewise, they will also pay attention to comments from global oil producers for further signals regarding their compliance towards an agreement to reduce its output.
Highlighted economy data and events for the week: June 19 – 23
| Monday, June 19 |
Data JPY – Trade Balance (May)
Events USD – FOMC Member Dudley Speaks
|
| Tuesday, June 20 |
Data Crude Oil – API Weekly Crude Oil Stock
Events AUD – RBA Meeting Minutes GBP – BoE Gov Carney Speaks USD – FOMC Member Rosengren Speaks USD – FOMC Member Stanley Fischer Speaks USD – FOMC Member Kaplan Speaks
|
| Wednesday, June 21 |
Data GBP – Public Sector Net Borrowing (May) USD – Existing Home Sales (May) Crude Oil – Crude Oil Inventories
Events N/A
|
| Thursday, June 22 |
Data NZD – RBNZ Interest Rate Decision USD – Initial Jobless Claims CAD – Core Retail Sales (MoM) (Apr)
Events NZD – RBNZ Rate Statement
|
|
Friday, June 23
|
Data EUR – German Manufacturing PMI (June) CAD – Core CPI (MoM) (May) USD – New Home Sales (May) Crude Oil – U.S. Baker Hughes Oil Rig Count
Events USD – FOMC Member Bullard Speaks USD – FOMC Member Mester Speaks USD – FOMC Member Powell Speaks
|
Technical weekly outlook: June 19 – 23
Dollar Index
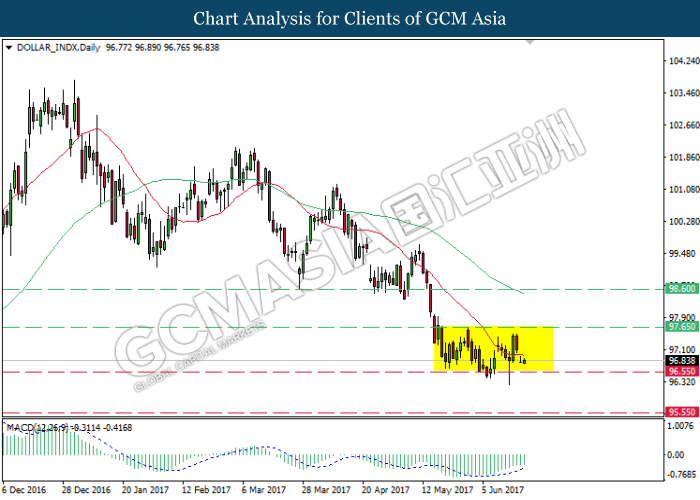
DOLLAR_INDX, Daily: Dollar index was traded lower following prior retracement from the top level of the range at 97.65. MACD indicator which remained hovered outside of downward momentum suggests dollar index to be traded higher in short-term as technical correction. Long-term trend direction only can be determined following a successful breakout from either side of the range.
Resistance level: 97.65, 98.60
Support level: 96.55, 95.55
GBPUSD
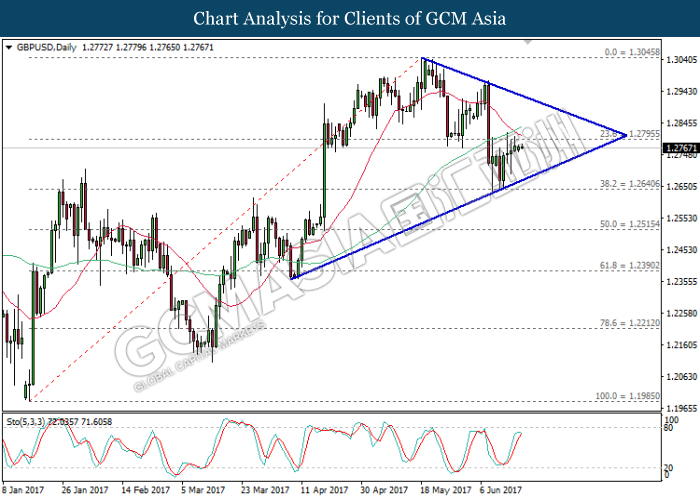
GBPUSD, Daily: GBPUSD remained traded within a narrowing triangle while currently testing near the resistance level of 1.2795. Stochastic Oscillator begins to form a retracement signal suggests higher possibility for GBPUSD to be traded lower towards the lower level in short-term. Likewise, long-term trend direction could only be determined after a successful breakout from either side of the triangle.
Resistance level: 1.2795, 1.3045
Support level: 1.2640, 1.2515
USDJPY
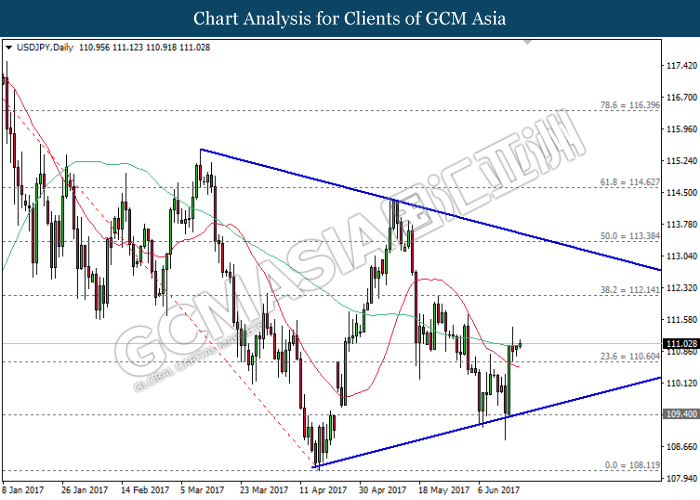
USDJPY, Daily: USDJPY remained traded within a narrowing triangle following prior rebound from the support level of 109.40. A closure above the 60-moving average line (green) would suggest USDJPY to extend its upward momentum towards the target of 112.15.
Resistance level: 112.15, 113.40
Support level: 110.60, 109.40
EURUSD
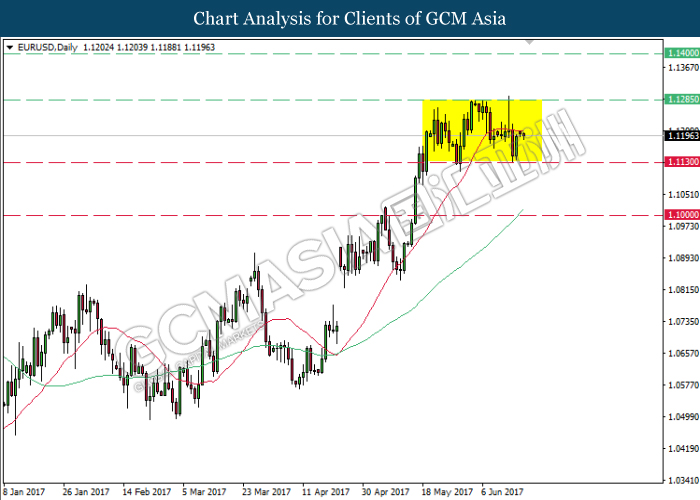
EURUSD, Daily: EURUSD remained traded within a range of 1.1130 and 1.1285 while recently retraced from the 20-moving average line (red). It is suggested to fallback towards the lower level of the range in short-term, heading towards the target of 1.1130. Long-term trend direction could only be determined after a successful closure at either side of the range.
Resistance level: 1.1285, 1.1400
Support level: 1.1130, 1.1000
GOLD
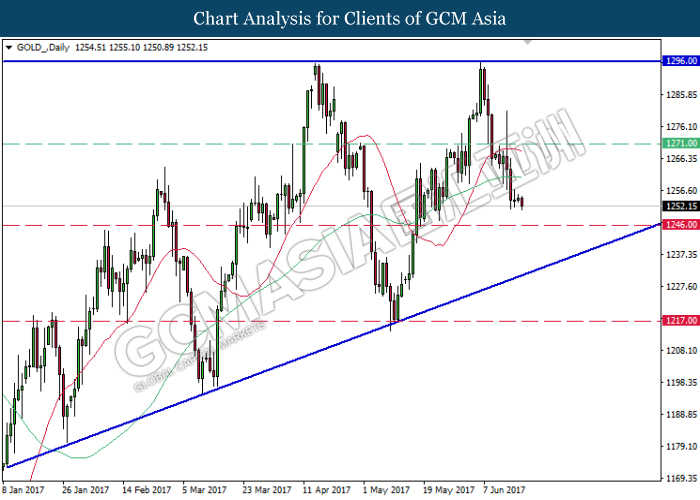
GOLD_, Daily: Gold price remained traded within an ascending triangle following prior retracement from the strong resistance level of 1296.00 while forming a double top. Recent closure below the 60-moving average line (green) suggests gold price to extend its downward momentum towards the support level of 1246.00
Resistance level: 1271.00, 1296.00
Support level: 1246.00, 1217.00
Crude Oil
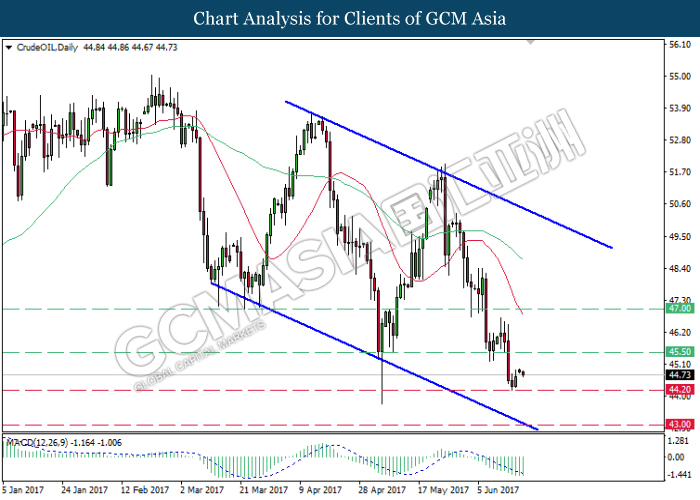
CrudeOIL, Daily: Crude oil price remained traded within a downward channel while currently hovering near the lower level. MACD indicator which remained hovered inside the downward momentum suggests crude oil price to extend its losses towards the support level of 44.20.
Resistance level: 45.50, 47.00
Support level: 44.20, 43.00