19 June 2018 Daily Analysis
US dollar fumbled as trade-war on the brink.
Greenback continued its depreciation since the start of the week as investors pile over to safe-haven assets amid heightened trade-war risk in between the United States and China. The dollar index slumped 0.03% while last quoted around 94.35 during Asian trading hours. Fears over imminent trade-wars were evoked following provocative introduction of 25% tariff by the Trump administration against a list of China imported goods last Friday. Adding up to the risk, US President Donald Trump vowed to take extra measures if China retaliates against the measure taken, fuming higher risk aversion in the financial market. However, downside on the US dollar were somehow limited as Euro thread lower following EU political uncertainty arise from Germany’s governing coalition. Pair of EUR/USD quoted down 0.02% to $1.1623 as of writing.
Peering into commodities market, crude oil price pared its losses by 1.30% to $65.69 per barrel after report suggested that Organization of the Petroleum Exporting Countries (OPEC) is considering to hike their output below the level of initially speculated. Members of OPEC is considering to raise oil output by 300,000 to 600,000 barrels per day over the next few months in order to offset imminent supply shortage from Venezuela and Iran. Concurrently, gold price tacks up 0.06% to $1,279.24 a troy ounce while investors mull mixed sentiment between rising trade tension and faster pace of rate hike in the US.
Today’s Holiday Market Close
Time Market Events
N/A
Today’s Highlight Events
Time Market Events
09:30 AUD RBA Meeting Minutes
16:00 EUR ECB President Draghi Speaks
20:30 USD FOMC Member Bullard Speaks
Today’s Highlight Economic Data
| Time | Nation & Data | Previous | Forecast | Actual |
| 20:30 | USD – Building Permits (May) | 1.364M | 1.350M | – |
| 04:30 | CrudeOIL – API Weekly Crude Oil Stock | 0.833M | – | – |
GBPUSD
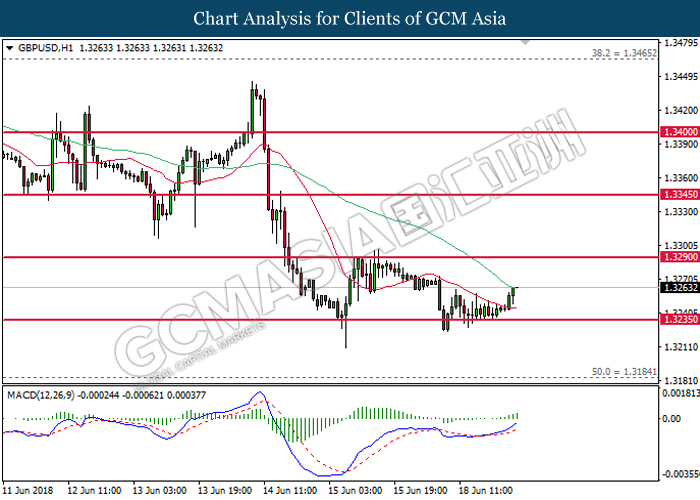
GBPUSD, H1: GBPUSD was traded higher following prior rebound from the support level near 1.3235. MACD histogram which has formed a golden cross signal may suggest the pair to extend its bullish bias in short-term, towards the direction of 1.3290.
Resistance level: 1.3290, 1.3345
Support level: 1.3235, 1.3185
EURUSD
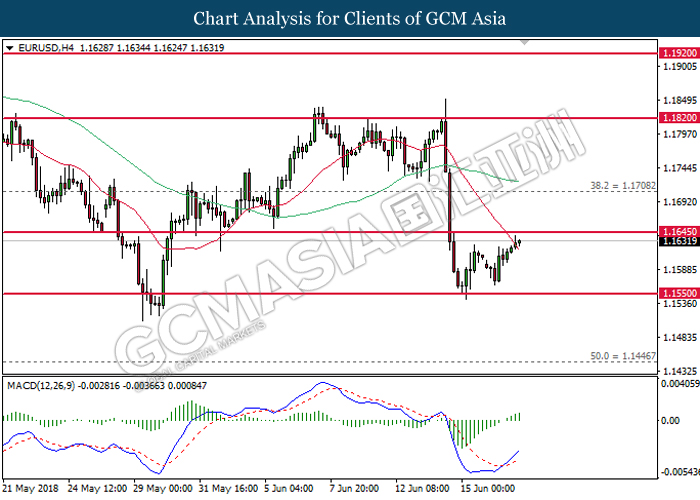
EURUSD, H4: EURUSD extended gains following prior rebound from the support level near 1.1550. MACD histogram which has formed an upward signal suggests the pair to advance further up after breaking the resistance level at 1.1645.
Resistance level: 1.1645, 1.1710
Support level: 1.1550, 1.1445
USDJPY
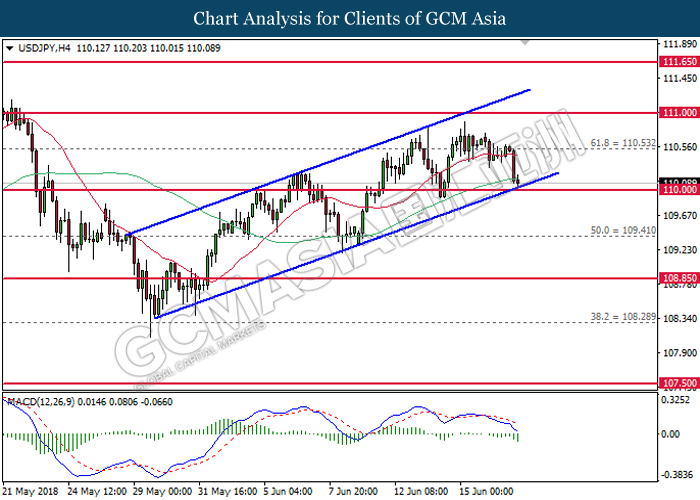
USDJPY, H4: USDJPY remains traded within an ascending channel while currently testing at the bottom level. MACD histogram which illustrate downward signal suggests the pair to extend its losses in the event of a breakout from the bottom level.
Resistance level: 110.55, 111.00
Support level: 110.00, 109.40
CrudeOIL
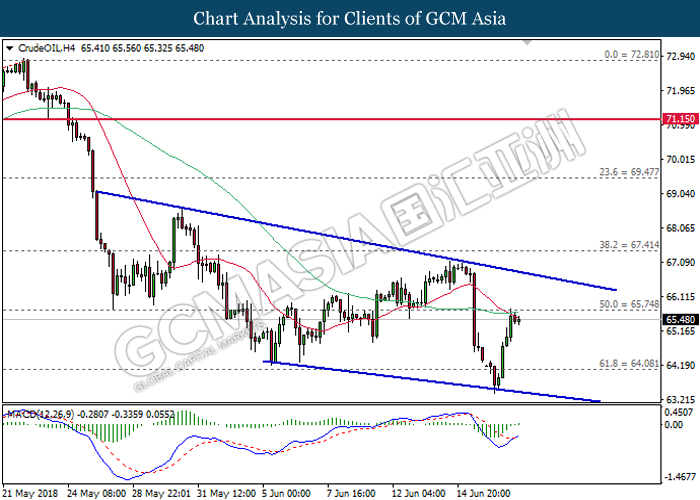
CrudeOIL, H4: Crude oil price remains traded higher following prior rebound from the bottom level. MACD histogram which illustrate the formation of bullish signal suggests the pair to extend its gains after breaking the threshold of 65.75.
Resistance level: 65.75, 67.40
Support level: 64.10, 62.90
GOLD
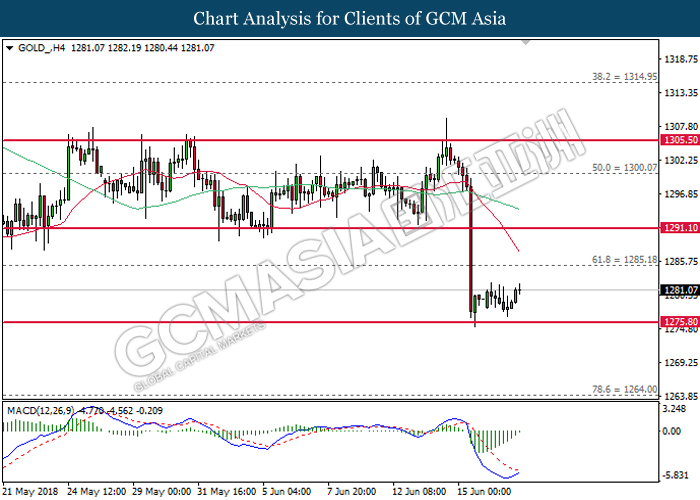
GOLD_, H4: Gold price pared some of its losses after regaining its support at 1275.80. MACD histogram which illustrate diminishing downward momentum suggests the pair to be traded higher in short-term as technical correction.
Resistance level: 1285.20, 1291.10
Support level: 1275.80, 1264.00