24 May 2019 Morning Session Analysis
Greenback nosedived after T-bill collapse.
Greenback nosedived during Thursday’s American trading session following concerns over global economic downturn spurred by the ongoing US-China trade tensions. Bearish sentiment within the market was further exacerbated following lower-than-expected preliminary estimates from Markit which shows sharp depreciation in business activity for both EU and US. In the US front, both Manufacturing and Services component shows slight contraction with actual reading of 50.6 and 50.9 versus prior of 52.6 and 53.0 respectively. In addition, housing market in the US portrays similar notion after New Home Sales for the month of April came in at only 673K, missing economist forecast for 675K. A few sets of bearish economic data from the US spur higher risk aversion among market participants, evoking a large drop in 10-year US Treasury bond yield which recorded a loss of more than 4%. On the other hand, pair of EUR/USD reverses its losses after touching two-years low of 1.1105 on yesterday. Traders begin to initiate a buyback on the single common currency following large depreciation of the greenback. However, gains on euro remains limited as its economic fundamentals remains bleak for the time being. As of writing, the dollar index fell 0.19% to 97.67 while EUR/USD ticks up 0.02% to 1.1183.
As for commodities market, crude oil price extended its losses by 0.10% to $57.98 per barrel. Price of oil futures plunged sharply on yesterday as bearish economic data spur higher concern over global recession which may lead to lower demand for this commodity in the future. Otherwise, gold price tacks up 0.05% to $1,284.05 a troy ounce due to weaker greenback.
Today’s Holiday Market Close
Time Market Event
N/A
Today’s Highlight Events
Time Market Event
N/A
Today’s Highlight Economic Data
| Time | Market & Data | Previous | Forecast | Actual |
| 16:30 | GBP – Retail Sales (MoM) (Apr) | 1.1% | -0.3% | – |
| 20:30 | USD – Core Durable Goods Orders (MoM) (Apr) | 0.2% | 0.2% | – |
| 01:00
(25th) |
CrudeOIL – US Baker Hughes Oil Rig Count | 802 | – | – |
Technical Analysis
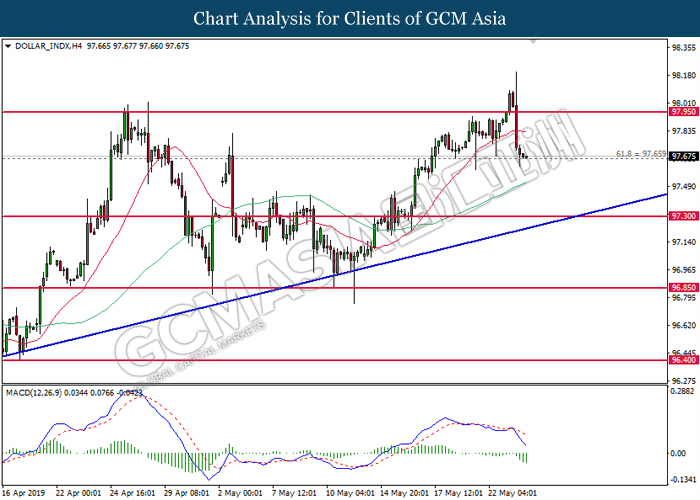
DOLLAR_INDX, H4: Dollar index was traded lower while currently testing at the support of 97.65. MACD which illustrate bearish signal suggests the index to extend its losses after closing below 97.65.
Resistance level: 97.95, 98.60
Support level: 97.65, 97.30
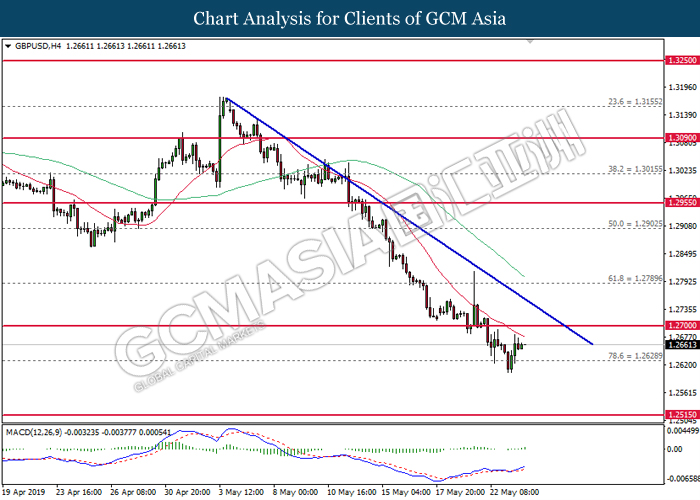
GBPUSD, H4: GBPUSD was traded higher following prior rebound from the support of 1.2630. MACD which illustrate bullish signal suggests the pair to be traded higher in short-term as technical correction.
Resistance level: 1.2700, 1.2790
Support level: 1.2630, 1.2515
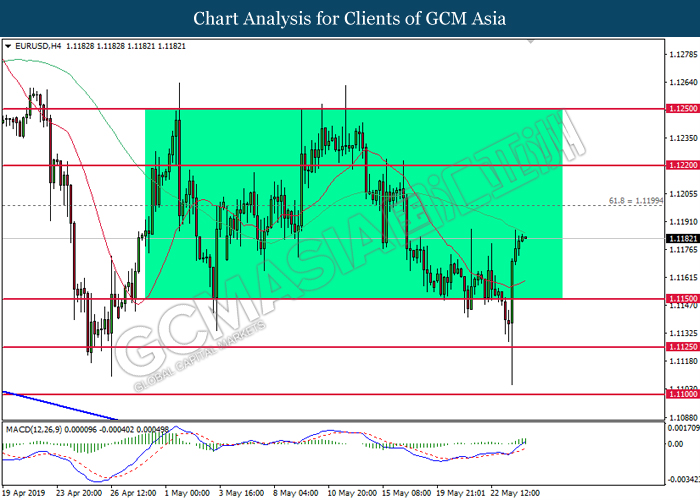
EURUSD, H4: EURUSD was traded higher following prior rebound from the lower level. MACD which illustrate bullish signal suggests the pair to extend its gains after closing above the 60-MA line (green).
Resistance level: 1.1200, 1.1220
Support level: 1.1155, 1.1125
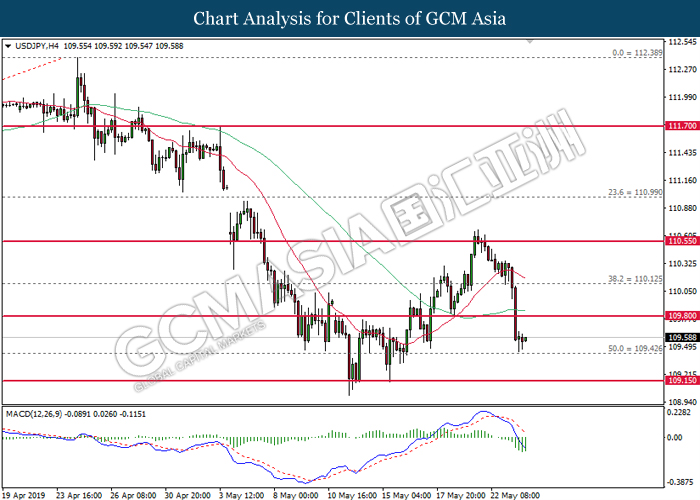
USDJPY, H4: USDJPY was traded lower following prior closure below 109.80. MACD which illustrate bearish signal suggests the pair to extend its losses after closing below the support of 109.40.
Resistance level: 109.80, 110.10
Support level: 109.40, 109.15
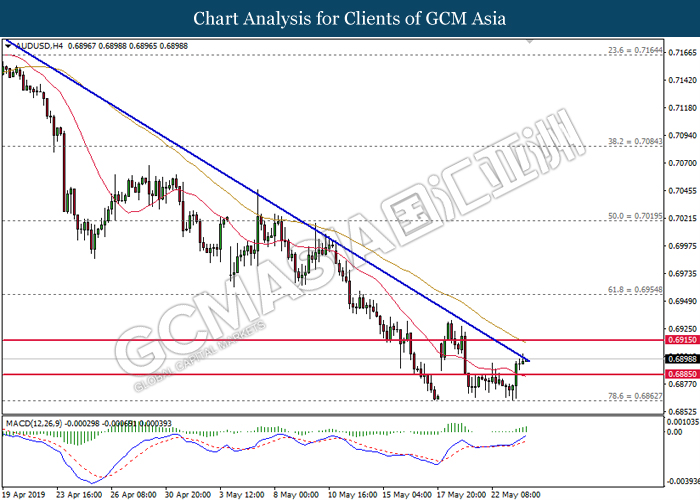
AUDUSD, H4: AUDUSD was traded higher while currently testing at the downward trendline. MACD which illustrate bullish signal suggests the pair to extend its gains after breaking the trendline.
Resistance level: 0.6915, 0.6955
Support level: 0.6885, 0.6860
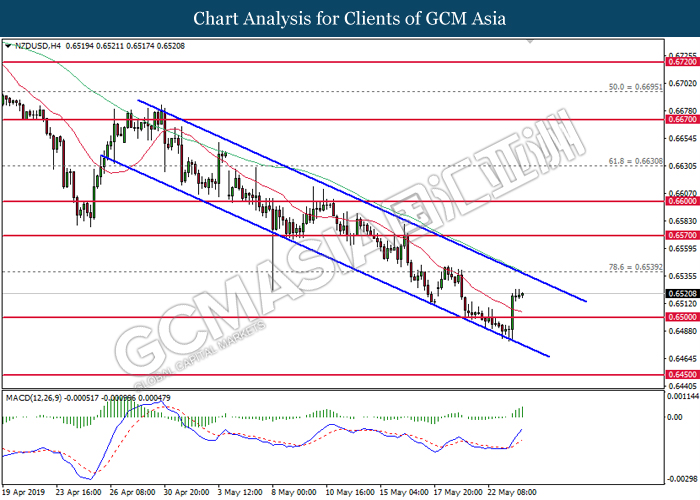
NZDUSD, H4: NZDUSD was traded higher following prior rebound from the lower level of the channel. MACD which illustrate bullish signal suggests the pair to be traded in short-term.
Resistance level: 0.6540, 0.6570
Support level: 0.6500, 0.6450
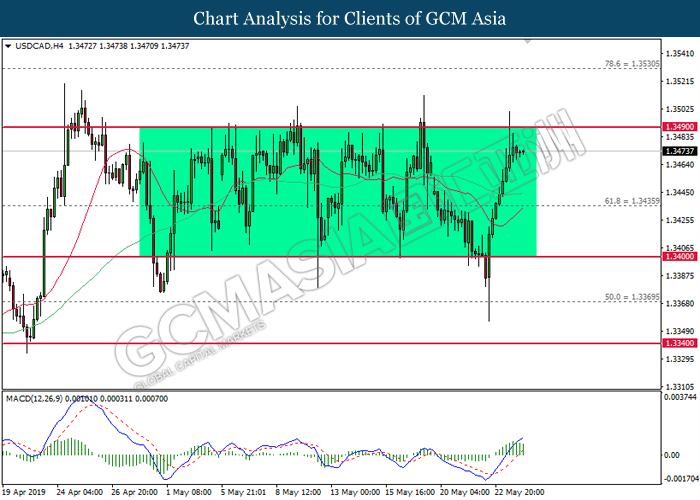
USDCAD, H4: USDCAD was traded lower following prior retracement from the resistance of 1.3490. MACD which illustrate diminishing upward momentum suggests the pair to be traded lower in short-term as technical correction.
Resistance level: 1.3490, 1.3530
Support level: 1.3435, 1.3400
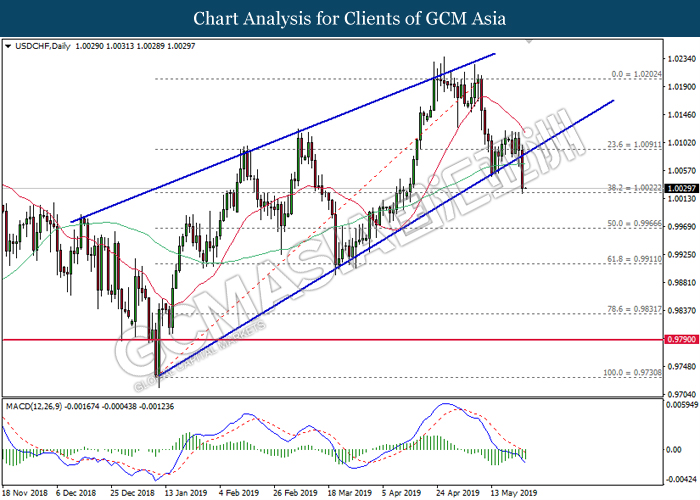
USDCHF, Daily: USDCHF was traded lower while currently testing at the support of 1.0020. MACD which illustrate bearish signal suggests the pair to extend its losses after closing below the support level.
Resistance level: 1.0090, 1.0200
Support level: 1.0020, 0.9965
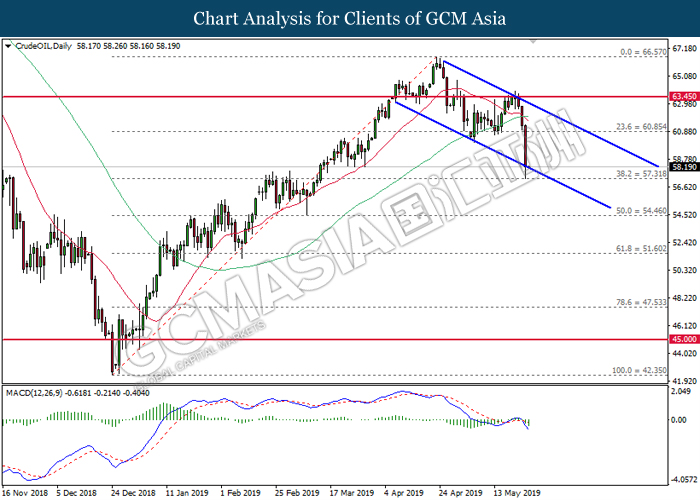
CrudeOIL, Daily: Crude oil price was traded lower while currently testing at the bottom level of the channel. MACD which illustrate bearish signal suggests its prices to extend its losses after successful breakout from the bottom level.
Resistance level: 60.85, 63.45
Support level: 57.30, 54.45
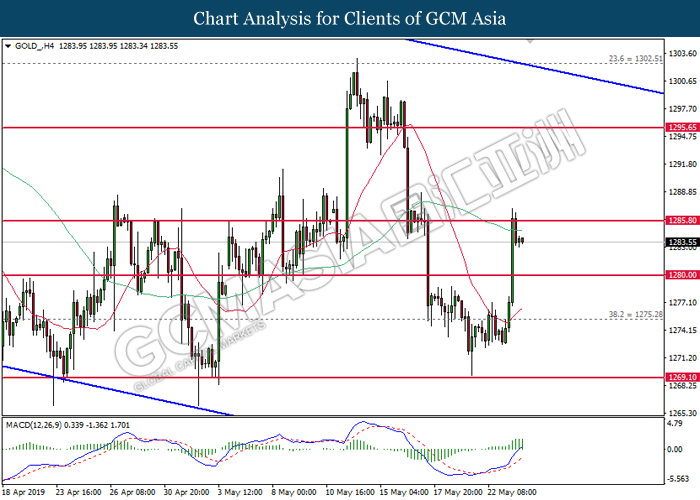
GOLD_, H4: Gold price was traded higher following prior rebound from the lower level. MACD which illustrate bullish signal suggests its prices to extend its gains after closing above the target near 1285.80.
Resistance level: 1285.80, 1295.65
Support level: 1280.00, 1275.30