26 September 2018 Morning Session Analysis
Investors awaits as Fed delivers interest rate decision.
Greenback was traded sideways against other major currencies on yesterday, shrugging off optimistic US economic data while investors look ahead to the conclusion of two-day policy meeting from the Federal Reserve. The dollar index rose 0.03% while last seen around 94.16 during Asian session. Overnight, Conference Board’s consumer confidence gauge rose to 138.4 in September, its highest level in almost 18 years due to optimistic sentiment towards the economy. However, the data failed to catalyzed larger bullish momentum on the greenback while investors awaits interest rate decision from the Feds which is expected to culminate a 25-basis point interest hike to a range of 2.00% – 2.25%. On the other hand, pound sterling hits fresh highs on yesterday after UK Prime Minister Theresa May reiterated her confidence in keeping to Brexit schedule. Pair of GBP/USD depreciates by 0.03% to 1.3175 this morning.
As for commodities market, crude oil price tumbled down 0.22% to $72.19 per barrel after American Petroleum Institute (API) reported an increase in crude oil stocks last week by 2.903 million barrels. Likewise, gold price was down by 0.03% to $1,200.50 a troy ounce as investors awaits the outcome of Fed’s interest rate decision.
Today’s Holiday Market Close
Time Market Event
N/A
Today’s Highlight Events
Time Market Event
02:00 (27th) USD FOMC Economic Projections
02:00 USD FOMC Statement
02:30 USD FOMC Press Conference
05:00 NZD RBNZ Rate Statement
05:00 NZD RBNZ Press Conference
Today’s Highlight Economy Data
| Time | Nation & Data | Previous | Forecast | Actual |
| 22:00 | USD – New Home Sales (Aug) | 627K | 630K | – |
| 22:30 | CrudeOIL – Crude Oil Inventories | -2.057M | -1.279M | – |
| 02:00 (27th) | USD – Fed Interest Rate Decision | 2.00% | 2.25% | – |
| 05:00 | NZD – RBNZ Interest Rate Decision | 1.75% | 1.75% | – |
Technical Analysis
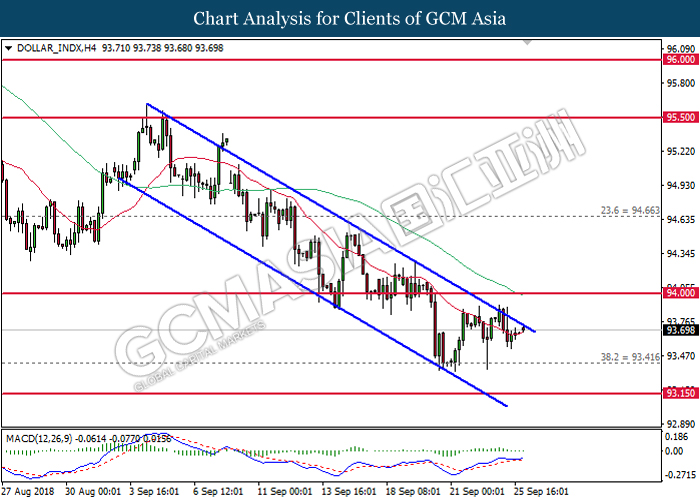
DOLLAR_INDX, H4: Dollar index remains traded within a descending channel while currently testing at the top level. Although MACD illustrate bullish signal, a break above the channel is required to further validate the upside bias.
Resistance level: 94.00, 94.65
Support level: 93.40, 93.15
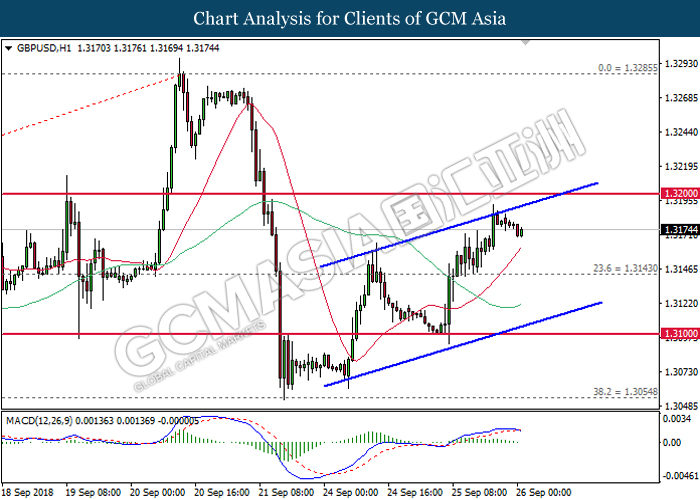
GBPUSD, H1: GBPUSD remains traded within an ascending channel following prior retrace from the top level. MACD which begins to form a death cross signal suggests the pair to be traded lower in short-term after closing below the 20-MA line (red).
Resistance level: 1.3200, 1.3285
Support level: 1.3145, 1.3100
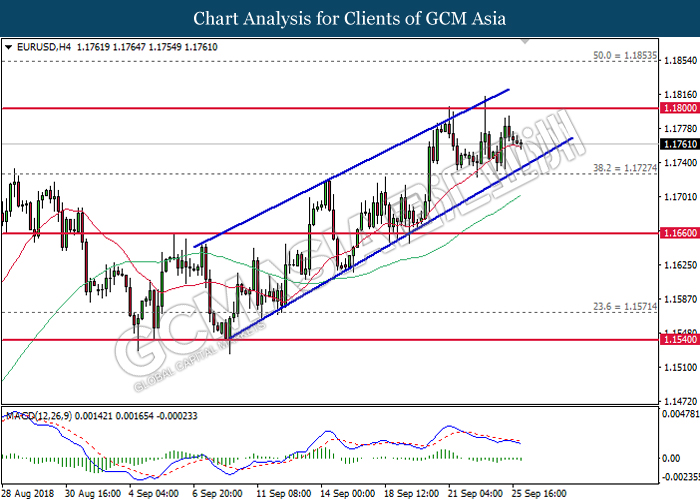
EURUSD, H4: EURUSD remains traded within an ascending channel following prior retrace from resistance level near 1.1800. MACD histogram which illustrate death cross signal suggests the pair to extend its losses after closing below the 20-MA line (red).
Resistance level: 1.1800, 1.1855
Support level: 1.1730, 1.1660
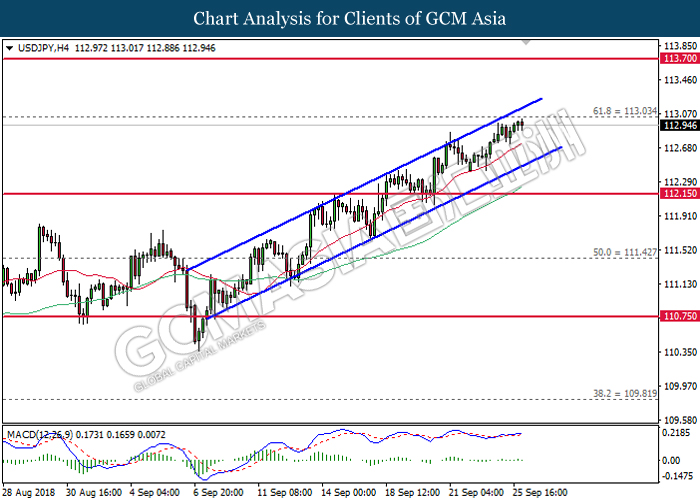
USDJPY, H4: USDJPY remains traded within an ascending channel while currently testing at the top level. Although MACD illustrate bullish signal, a break above the channel is required to affirm current upside bias.
Resistance level: 113.05, 113.70
Support level: 112.15, 111.40
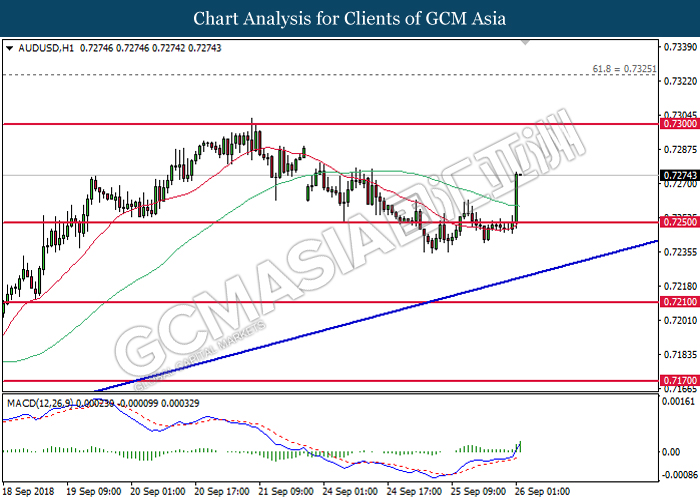
AUDUSD, H1: AUDUSD was traded higher following prior closure above the 60-MA line (green). MACD which illustrate the formation of golden cross suggests the pair to extend its gains, towards the direction of next target near 0.7300.
Resistance level: 0.7300, 0.7325
Support level: 0.7250, 0.7210
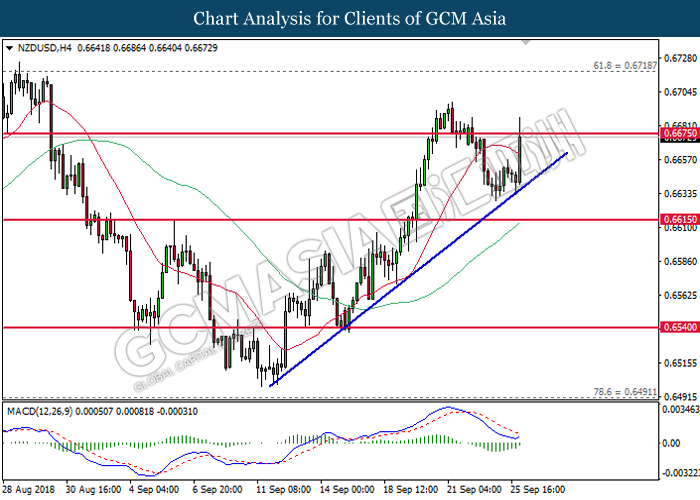
NZDUSD, H4: NZDUSD was traded higher following prior rebound from the upward trendline. MACD histogram which illustrate diminishing downward momentum suggests the pair to extend its bullish bias after breaking the resistance near 0.6675.
Resistance level: 0.6675, 0.6720
Support level: 0.6615, 0.6540
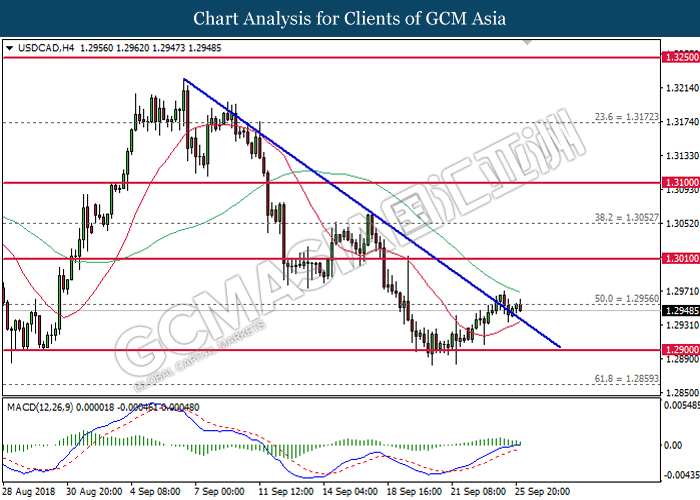
USDCAD, H4: USDCAD was traded higher following prior breakout from the downward trendline. Although MACD illustrate bullish bias, a close above 1.2955 is required to further validate its bullish signal.
Resistance level: 1.2955, 1.3010
Support level: 1.2900, 1.2860
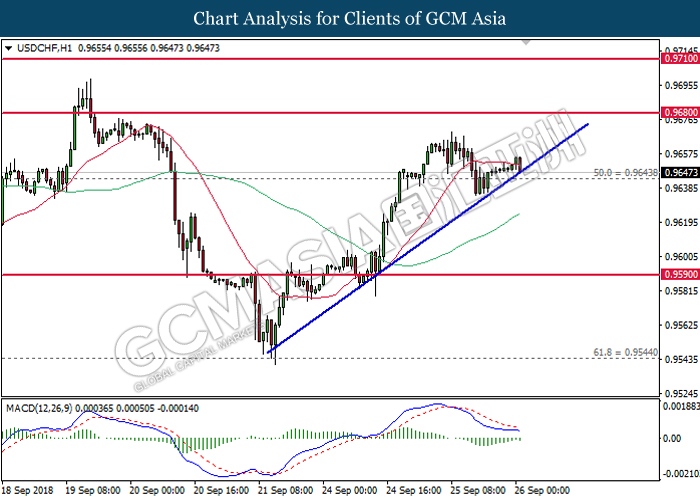
USDCHF, H1: USDCHF was traded flat while currently testing near the upward trendline. MACD histogram which illustrate death cross signal suggests the pair to extend its losses after breaking the upward trendline.
Resistance level: 0.9680, 0.9710
Support level: 0.9645, 0.9590
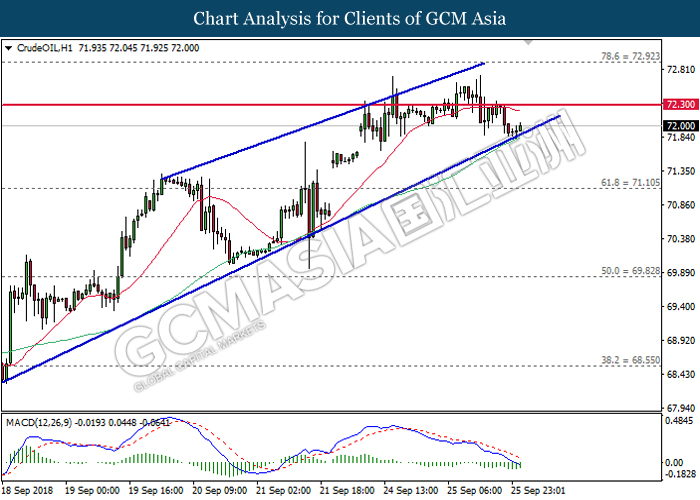
CrudeOIL, H1: Crude oil price remains traded within an ascending channel while currently testing at the bottom level. Although MACD illustrate bearish signal, a break below the channel is required to attain further confirmation.
Resistance level: 72.30, 72.90
Support level: 71.10, 69.80
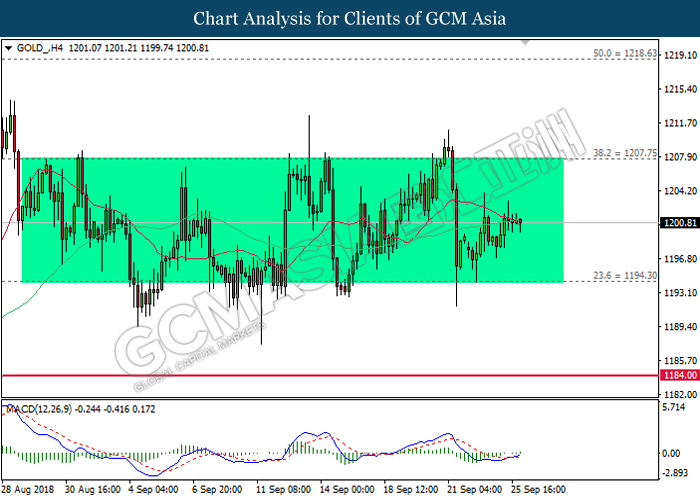
GOLD_, H4: Gold price remains traded within a sideways channel while currently testing near the mid-level. As recent price action and MACD does not illustrate prominent signal, it is suggested to wait for further signal to emerge before entering the market.
Resistance level: 1207.75, 1218.65
Support level: 1194.30, 1184.00