27 March 2017 Weekly Analysis
GCMAsia weekly report: March 27 – 31
Market Review (Forex): March 20 – 24
U.S. Dollar
US dollar hovered near four-months low after Republican leaders dropped legislation to replace the Affordable Care Act before a planned vote, in a setback to the US President Donald Trump. The dollar index was a little changed last Friday at 99.59, not far from four-months trough of 99.36. Republican leaders pulled the legislation to overhaul the US healthcare system before a vote in the House of Representatives after it failed to garner enough support for the bill.
The defeat has added more doubts over Trump administration’s ability to push through pro-growth economic agenda that was previously promised during his election campaign. Investors view the Trump administration’s failure to push healthcare legislation overhaul is a signal that he may face further setbacks in delivering other policy pledges that may include corporate tax cuts, regulatory reform and infrastructure spending.
USD/JPY
Dollar was up against the safe-haven Yen, with pair of USD/JPY rose 0.4% to 111.36 during late Friday trading, pulling away from its lowest level since November 23rd at 110.63. For the week, the pair was down 1.16%.
EUR/USD
Euro was slightly higher against the greenback, up 0.14% to $1.0797.
GBP/USD
Great British Pound was slightly lower with the pair of GBP/USD down 0.38% to $1.2472 as investors braced for Britain to begin the process of exiting EU on March 29.
Market Review (Commodities): March 20 – 24
GOLD
Gold prices trims some earlier gains on late Friday while notched up a second weekly rise as concerns over Trump administration’s ability to push through its pro-growth economic agenda has underpinned the demand for safe-haven bullion. Gold price for April delivery was down 0.34% and was last quoted at $1,243.00, not far from session high of $1,251.85. Gold priced touched its highest level since February 28th at $1,253.15 while ended the week with a gain of 1.07%.
Price of the yellow metal turned lower as the dollar steadied after Republican leaders dropped legislation to replace the Affordable Care Act before a planned vote in the House of Representatives after it failed to garner enough support to pass. A stronger dollar usually weights on gold price as it dampens the metal’s appeal as alternative asset while dollar-priced commodities will become more expensive for holders of other currencies.
Crude Oil
Oil futures settled higher on Friday albeit posting a weekly loss of almost 2% as the market remained divided between rising shale production and record high stockpiles in the US against the efforts by major oil producers to cut their daily output in order to reduce an oversupply glut. Crude oil price inched up 27 cents or 0.6% to $47.97 per barrel during late Friday trading, snapping out from a fourth consecutive session of losses. For the week, crude oil price was down 81 cents or 1.7%, its third weekly loss in a month.
Data from oilfield services provider Baker Hughes last Friday revealed that the number of active US oil rigs rose 21 last week, its tenth weekly increase while the total count rise to 652, its highest since September 2015. Meanwhile, the US Energy Information Administration reported that the crude oil inventories rose by 4.95 million barrels last week, sending total inventories to an all-time high of 533.1 million thus far, adding further concerns towards global supply glut. Oil prices has fallen sharply this month amid concerns of ongoing rebound in US shale production could undermined efforts by other major producers in rebalancing global supply and demand.
U.S. Baker Hughes Oil Rig Count
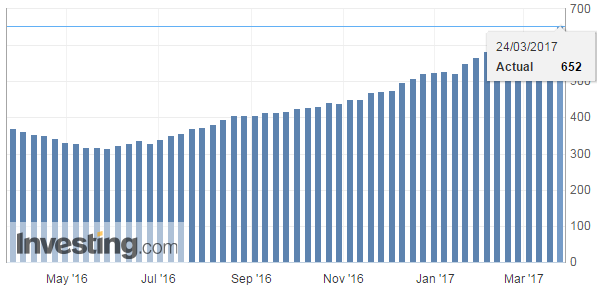
Oilfield services provider Baker Hughes reported that U.S. active oil rig count increased by 21 to 652 last week.
U.S. Crude Oil Stocks Change
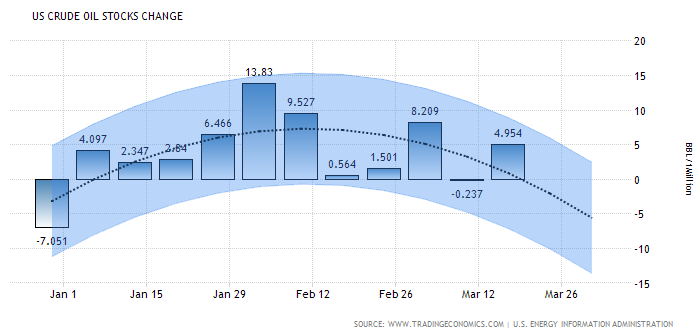
—– Forecast
Energy Information Administration reported a swell in crude inventories by 4.954 million barrels last week, sending total inventories to a record high of 533.1 million barrels.
Weekly Outlook: March 27 – 31
For the week, investors will continue to monitor political developments in the United States, with Trump’s promised tax reforms to be the main limelight. Market watchers will also be looking into US economic reports which includes reading on personal income and spending while side-lined by a number of appearance of Fed officials.
As for oil traders, they will eye on fresh weekly information on US stockpiles of crude which will be released on Wednesday for further indication of demand from world’s largest oil consumer. Otherwise, they will also pay close attention to comments from global oil producers for further evidence of their compliance to reduce output this year.
Highlighted economy data and events for the week: March 27 – 31
| Monday, March 27 |
Data EUR – German Ifo Business Climate Index (Mar)
Events N/A
|
| Tuesday, March 28 |
Data USD – CB Consumer Confidence (Mar) Crude Oil – API Weekly Crude Oil Stock
Events CAD – BoC Gov Poloz Speaks USD – Fed Chair Yellen Speaks
|
| Wednesday, March 29 |
Data GBP – Net Lending to Individuals USD – Pending Home Sales (MoM) (Feb) Crude Oil – Crude Oil Inventories
Events N/A
|
| Thursday, March 30 |
Data EUR – Spanish CPI (MoM) (Mar) EUR – German CPI (MoM) (Mar) USD – GDP (QoQ) (Q4) USD – Initial Jobless Claims CAD – RMPI (MoM) (Feb)
Events N/A
|
|
Friday, March 31
|
Data JPY – Household Spending (MoM) (Feb) JPY – National Core CPI (YoY) (Feb) NZD – ANZ Business Confidence (Mar) CNY – Manufacturing PMI (Mar) EUR – German Retail Sales (MoM) (Feb) EUR – German Unemployment Change (Mar) GBP – Current Account (Q4) GBP – GDP (QoQ) (Q4) EUR – CPI (YoY) (Mar) USD – Personal Income (MoM) (Feb) USD – Personal Spending (MoM) (Feb) CAD – GDP (MoM) (Jan) USD – Chicago PMI (Mar) USD – Michigan Consumer Sentiment (Mar) Crude Oil – U.S. Baker Hughes Oil Rig Count
Events N/A
|
Technical weekly outlook: March 27 – 31
Dollar Index
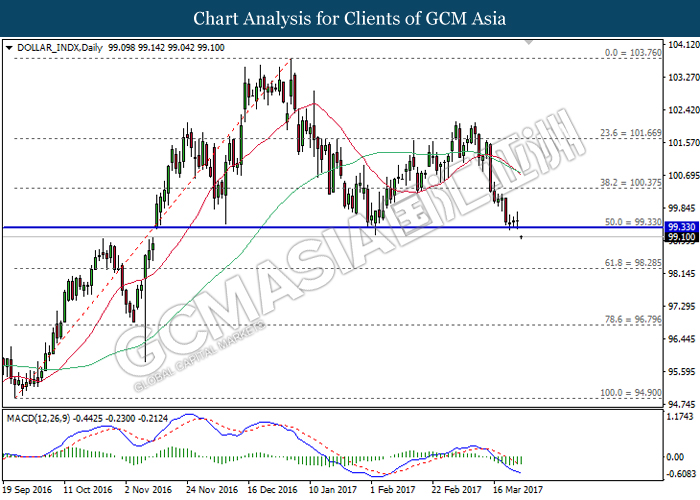
DOLLAR_INDX, Daily: The dollar index has recently opened below the key neckline of head and shoulder formation of 99.30, signaling a change in trend direction to move further downwards. With regards to the MACD histogram which illustrate downward signal and momentum, it is expected to advance further down towards the target of support level at 98.30.
Resistance level: 99.30, 100.40
Support level: 98.30, 96.80
GBPUSD
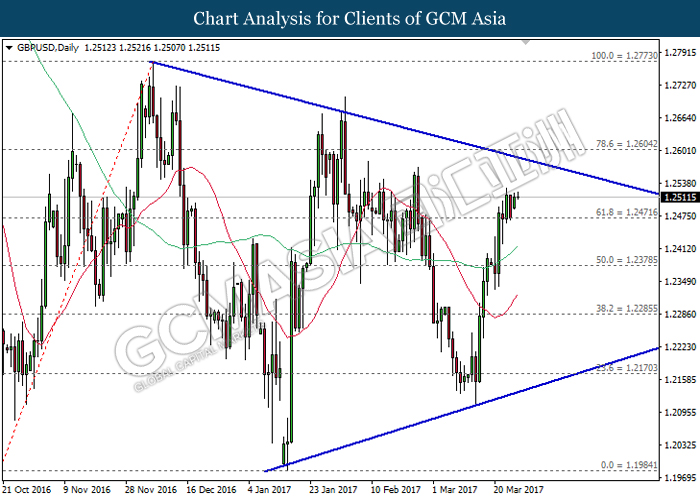
GBPUSD, Daily: GBPUSD remains traded within a narrow triangle following prior rebound from the bottom level of the triangle while closing above both moving average line. It is suggested to continue advancing further up, towards the upper level of the triangle in short-term. Long-term trend direction could only be determined after a successful breakout from either side of the triangle.
Resistance level: 1.2605, 1.2775
Support level: 1.2470, 1.2380
USDJPY
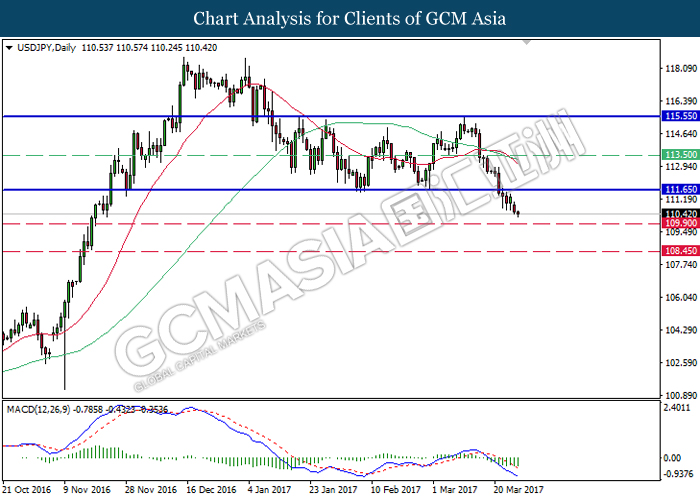
USDJPY, Daily: USDJPY has extended its losses following prior breakout from the lower level of sideways channel, signifying a change in trend direction to move further downwards. As the downward signal from MACD histogram continues to expand downwards, a successful closure below the support level of 109.90 would suggest USDJPY to extend its downward momentum thereafter.
Resistance level: 111.65, 113.50, 115.55
Support level: 109.90, 108.45
EURUSD
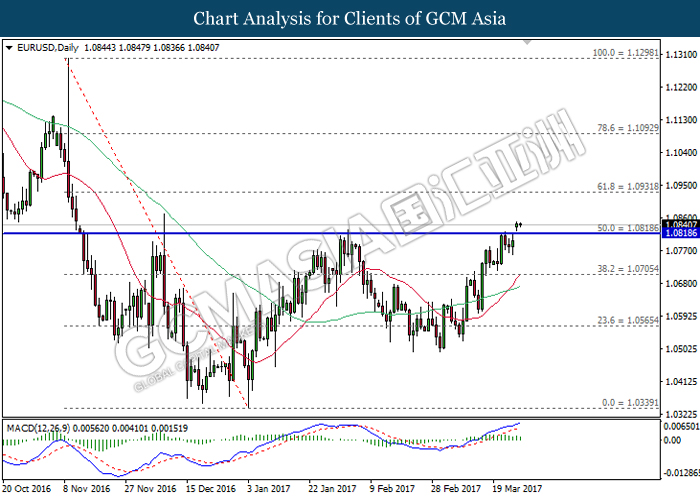
EURUSD, Daily: EURUSD opened the week above the key neckline of inverse head and shoulders formation of 1.0820, signaling a change in trend direction to move further upwards. As the MACD histogram continues to illustrate upward signal while coupled with recent golden cross formation from both MA lines, EURUSD is expected to advance further up, towards the next target of resistance level at 1.0930.
Resistance level: 1.0930, 1.1090
Support level: 1.0820, 1.0705
GOLD
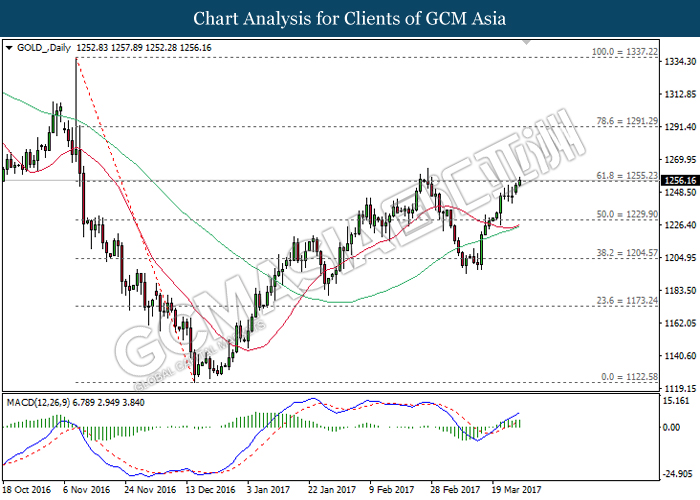
GOLD_, Daily: Gold price extended its gains following prior rebound from the 20-moving average line (red). Referring to the upward signal from MACD histogram which continues to expand upwards, gold price is expected advance further up after breaking the strong resistance level of 1255.25.
Resistance level: 1255.55, 1291.30
Support level: 1229.90, 1204.55
Crude Oil
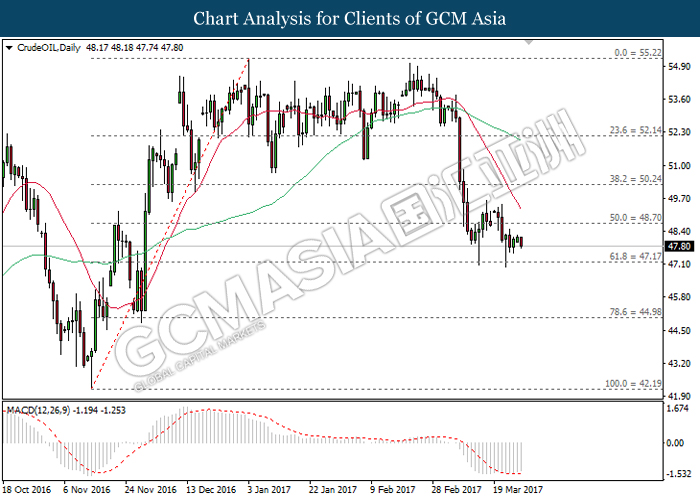
CrudeOIL, Daily: Crude oil price continues to be traded within the range of 47.15 and 48.70 following previous plunge due to the formation of death cross by both moving average line. With regards to the MACD indicator which continues to hover outside of downward momentum, crude oil price is expected to extend its brief retracement period to hover within the range of 47.15 and 48.70 in the short-term. Otherwise, long-term direction still suggests crude oil price to extend its downward momentum.
Resistance level: 48.70, 50.25
Support level: 47.15, 45.00