28 September 2017 Daily Analysis
Dollar soared higher, U.S. data under further examination.
Dollar index was traded higher against a basket of currencies near its one-month high at 93.40, with a total of 1.3% gains this week due to positive market sentiment toward U.S. President Donald Trump’s proposal to cut taxes for most Americans. However, criticism were catalyzed around the plan as it may benefit only to the rich and companies, as well as it could cause a deficit of trillions of dollars in the future. In addition, an upbeat data on U.S. durable goods orders added further support to the Greenback, which indirectly benefited U.S. 10-year treasury yield to reach to its highest since August 1st at 2.316 percent. However, based on views by market strategists, the greenback is still far from being a “strong rebound”. A couple of U.S. data will be on-eyed such as the personal consumption expenditures (PCE) price index for August and U.S. jobs data to further gauge the strength of the Greenback.
In the commodity market, crude oil prices slipped by 0.33%, traded at $51.97 after U.S crude inventories shown a surprise fall albeit a sharp rise in US crude production. Likewise, gold prices fell sharply by 1.02% to $1284.45 a troy ounce amid an increase in the strength of the Greenback as fuelled by rising expectations for a year-end rate hike and Trump’s tax reform.
Today’s Holiday Market Close
Time Market Event
N/A
Today’s Highlight Events
Time Market Event
04:00 NZD RBNZ Rate Statement
07:00 USD FOMC Member Rosengren Speaks
14:35 JPY BoJ Govenor Kuroda Speaks
16:15 GBP BoE Govenor Carner Speaks
21:45 USD FOMC Member George Speaks
22:15 USD FOMC Member Stanley Fischer Speaks
Today’s Highlight Economy Data
| Time | Nation & Data | Previous | Forecast | Actual |
| 04:00 | NZD – RBNZ Interest Rate Decision | 1.75% | 1.75% | 1.75% |
| 20:00 | EUR – German CPI (MoM) (Sep) | 0.1% | 0.1% | – |
| 20:30 | USD – GDP (QoQ) (Q2) | 3.0% | 3.0% | – |
| 20:30 | USD – Initial Jobless Claims | 259K | 270K | – |
GBPUSD
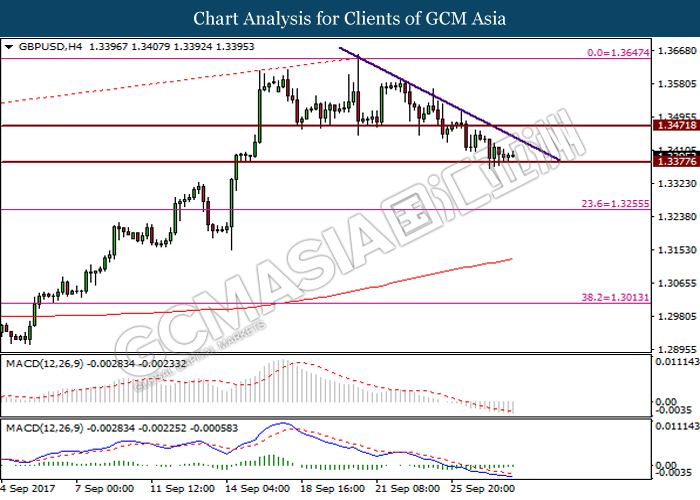
GBPUSD, H4: GBPUSD was traded within descending triangle and is currently testing the support level at 1.3375. Successful breakout below the said support level would suggest further downside bias for the pair, heading toward the next support level at 1.3255.
Resistance level: 1.3470, 1.3645
Support level: 1.3375, 1.3255
EURUSD
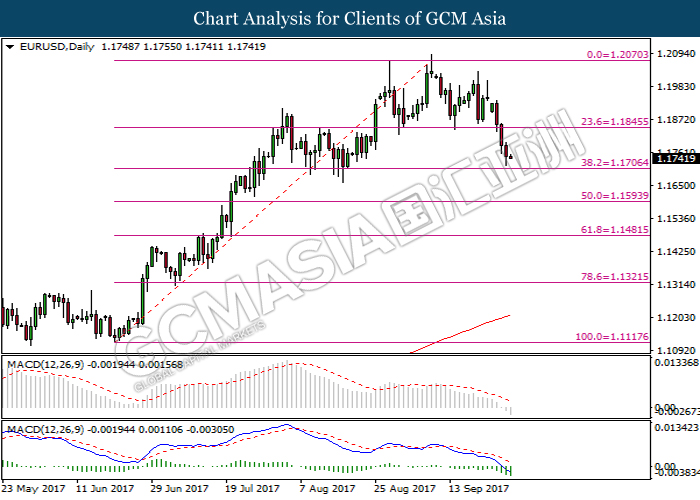
EURUSD, Daily: EURUSD was traded lower prior successful breakout below support level at 1.1845. Death cross as formed by MACD histogram suggests the pair to continue its bearish momentum, heading toward the next support level at 1.1705.
Resistance level: 1.1845, 1.2070
Support level: 1.1705, 1.1595
USDJPY
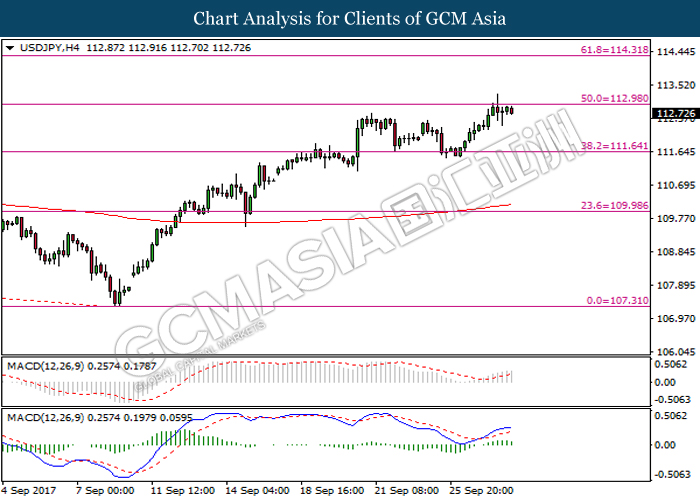
USDJPY, H4: USDJPY was traded higher its rebound from support level at 111.65. The pair is currently testing the resistance level at 113.00. Successful breakout above the said resistance level suggests the pair to continue its bullish momentum toward the next resistance level at 114.30.
Resistance level: 113.00, 114.30
Support level: 111.65, 110.00
CrudeOIL
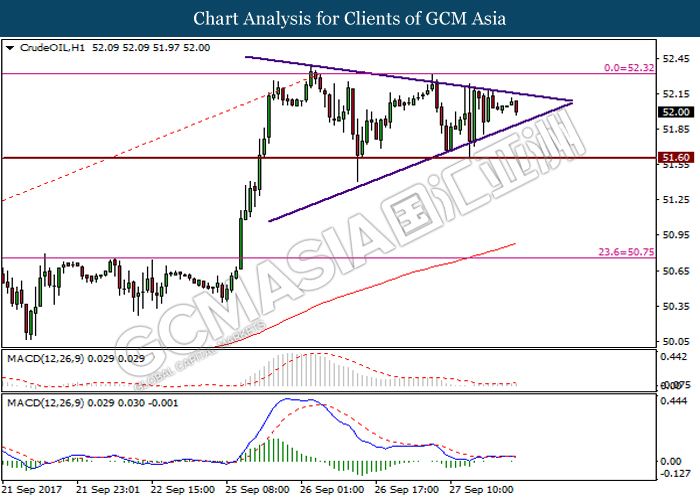
Crude OIL, H1: Crude oil prices was traded within symmetry triangle. A breakout above the top or below the bottom of the triangle is required to determine a clearer indication for the price movement.
Resistance level: 52.30, 52.80
Support level: 51.60, 50.75
GOLD
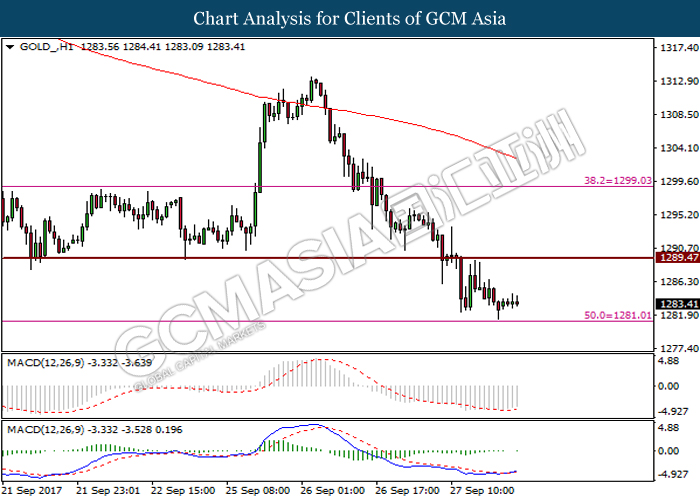
GOLD_, H1: Gold prices was traded higher prior its rebound from support level at 1281.00. Formation of pin bar and upward slope of MACD histogram suggests gold prices to undergo short-term technical correction, trading higher toward the resistance level at 1289.45.
Resistance level: 1289.45, 1299.00
Support level: 1281.00, 1272.00