29 June 2018 Daily Analysis
Dollar swings as GDP retreats.
Greenback seesawed against other major peers on Thursday as market bulls were held back following the release of dovish economic data from the United States. During yesterday’s North American trading hours, Bureau of Economic Analysis reported that the Gross Domestic Product (GDP) for first quarter came in at only 2.0%, missing economist forecast to read at 2.2%. In addition to that, last week’s Initial Jobless Claims rose by 9,000 individuals to 227,000, exceeding economist expectation to come in with only 220,000. However, the downside risk on the US dollar remains limited as Euro pared its earlier gains due to rising political uncertainty within the single economic bloc. During the highly anticipated EU leaders summit, several countries rejected Brussels proposal to implement EU-wide quota system where refugees and asylum seekers will be distributed among member countries to ease the burden. Countries such as Poland and Hungary refused to take part as it may threaten their national sovereignty and security while Italy threatened to block the initiative which has led to an impasse. As of writing, dollar index ticked up 0.05% to 94.94 while pairing of EUR/USD depreciates by 0.03% to $1.1564.
As for commodities, crude oil price extended gains by 0.10% to $73.45 per barrel despite US consideration to ease its tough stance against countries that import crude oil from Iran. The commodity remained supported as recent data showed that oil inventories in Oklahoma fell by 3.1 million barrels last week, easing market concern for further escalation in global supply glut. Similarly, gold price rose 0.07% to $1,249.01 a troy ounce following larger buyback after hitting fresh 6-months low on yesterday.
Today’s Holiday Market Close
Time Market Event
N/A
Today’s Highlight Events
Time Market Event
Tentative EUR EU Leaders Summit
Today’s Highlight Economic Data
| Time | Nation & Data | Previous | Forecast | Actual |
| 07:30 | JPY – Tokyo Core CPI (YoY) (Jun) | 0.5% | 0.6% | 0.7% |
| 07:50 | JPY – Industrial Production (MoM) (May) | 0.5% | -1.1% | -0.2% |
| 14:00 | EUR – German Retail Sales (MoM) (May) | 2.3% | -0.5% | – |
| 15:55 | EUR – German Unemployment Change (Jun) | -11K | -8K | – |
| 15:55 | EUR – German Unemployment Rate (Jun) | 5.2% | 5.2% | – |
| 16:30 | GBP – GDP (QoQ) (Q1) | 0.1% | 0.1% | – |
| 17:00 | EUR – CPI (YoY) (Jun) | 1.9% | 2.0% | – |
| 20:30 | USD – Core PCE Price (Index (YoY) (May) | 1.8% | 1.9% | – |
| 20:30 | USD – Personal Income (MoM) (May) | 0.3% | 0.4% | – |
| 20:30 | USD – Personal Spending (MoM) (May) | 0.6% | 0.4% | – |
| 20:30 | CAD – GDP (MoM) (Apr) | 0.3% | 0.0% | – |
| 22:00 | USD – Michigan Consumer Sentiment (Jun) | 99.3 | 99.1 | – |
| 01:00 | CrudeOIL – US Baker Hughes Oil Rig Count | 862 | – | – |
GBPUSD
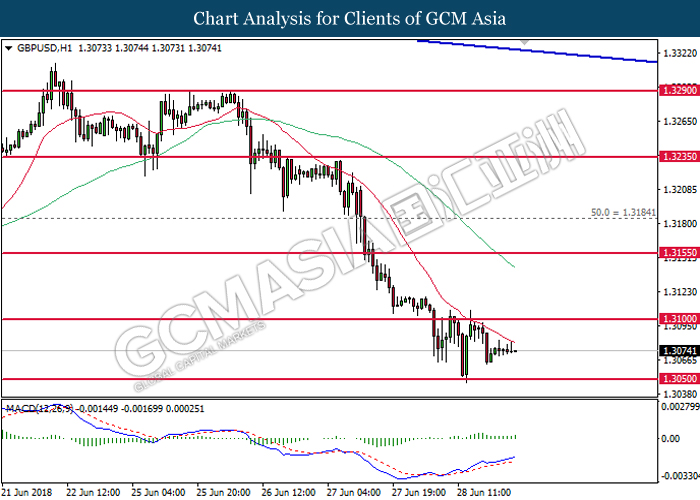
GBPUSD, H1: GBPUSD was traded higher following prior rebound from the support level at 1.3050. MACD histogram which illustrate upside signal suggests the pair to extend its gains in short-term as technical correction in the event of a closure above the 20-MA line (red).
Resistance level: 1.3100, 1.3155
Support level: 1.3050, 1.3010
EURUSD
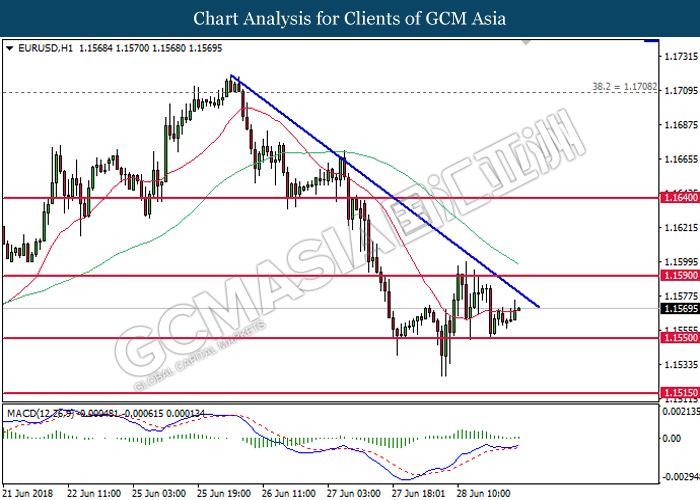
EURUSD, H1: EURUSD was traded higher after regaining its support at 1.1550. MACD histogram which begins to form a golden cross signal suggest the pair to extend its gains in short-term and retest near the downward trendline.
Resistance level: 1.1590, 1.1640
Support level: 1.1550, 1.1515
USDJPY
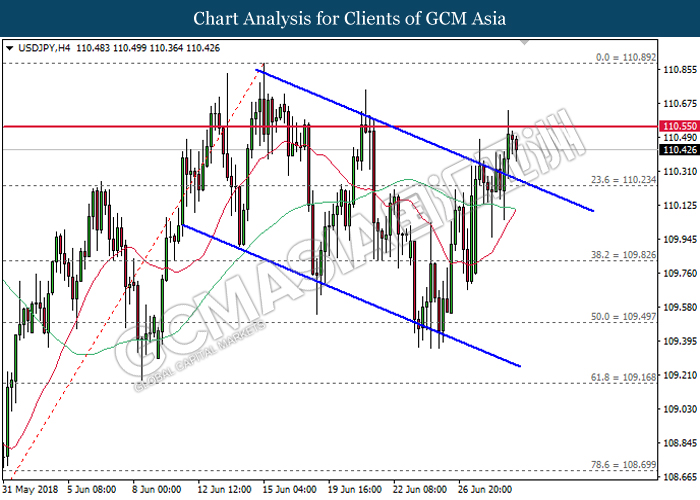
USDJPY, H1: USDJPY extended gains following prior breakout from the top level of descending channel. However, recent retracement from the resistance of 110.55 may suggest the pair to be traded lower in short-term as technical correction before extending its bullish bias.
Resistance level: 110.55, 110.90
Support level: 110.25, 109.80
CrudeOIL
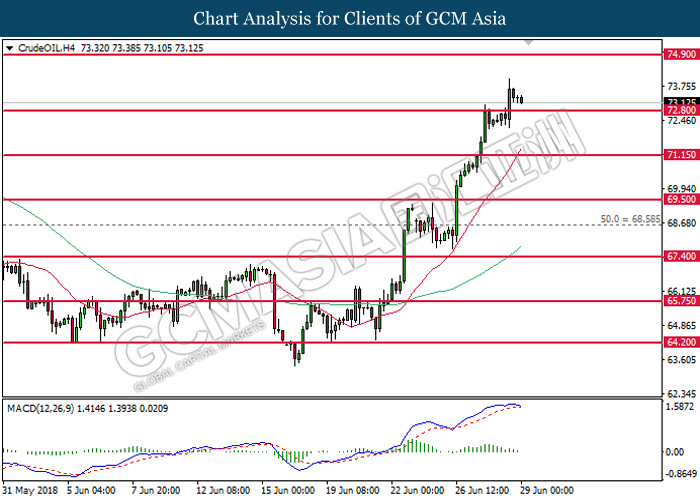
CrudeOIL, H4: Crude oil price was traded lower following prior retracement from its highest level in six months. MACD histogram which begins to form bearish signal may suggest the commodity price to be traded lower in short-term as technical correction before continuing its major bullish bias.
Resistance level: 74.90, 76.10
Support level: 72.80, 71.15
GOLD
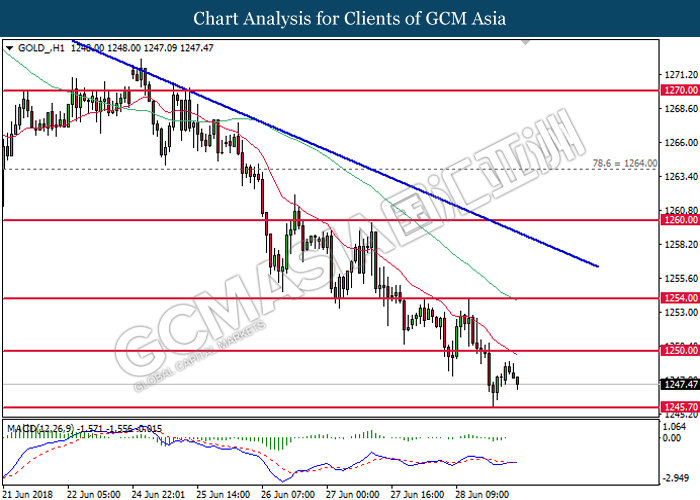
GOLD_, H1: Gold price was traded lower following a retrace prior to the resistance level at 1250.00. Recent price action suggests the pair to extend its losses, in tandem with the current bearish trendline towards the direction of 1245.70.
Resistance level: 1250.00, 1254.00
Support level: 1245.70, 1241.00