31 May 2018 Daily Analysis
Euro recuperate as political conundrum recedes.
US dollar received a bearish turnaround following the release of pessimistic economic data while coupled with a relief in EU political risk. The dollar index recorded a loss of 0.09% while last quoted at 94.00 during Asian trading hours. Overnight, ADP Nonfarm Employment Change showed lesser-than-expected jobs generated in the private sector with 178,000 versus 186,000. The data which is highly correlated to Nonfarm Payrolls report has dimmed economist expectation towards the latter. Similarly, Gross Domestic Product advanced slower than expected during the first quarter with only 2.2% versus 2.3% seen. In addition, greenback received further selling pressure after risk aversion towards Euro-denominated asset subsides. Abrupt change upon investor’s risk appetite came after interim Prime Minister Carlo Cottarelli postulate that the discussion to form an interim government is progressing, attenuating investors’ fear towards imminent EU-Exit referendum that may arise from fresh election for the time being. Pairing of EUR/USD ticked down 0.05% while last seen at $1.1656.
Peering into the commodities market, crude oil price settled down 0.40% to $67.89 per barrel after American Petroleum Institute reported an increase in US crude stockpiles by 1.001M during last week. On the other hand, gold price rose 0.15% to $1,303.07 a troy ounce over the backdrop of weaker US dollar.
Today’s Holiday Market Close
Time Market Event
N/A
Today’s Highlight Events
Time Market Event
00:30 USD FOMC Member Bostic Speaks
01:00 USD FOMC Member Brainard Speaks
Today’s Highlight Economy Data
| Time | Nation & Data | Previous | Forecast | Actual |
| 07:50 | JPY – Industrial Production (MoM) (Apr) | 1.4% | 1.5% | 0.3% |
| 09:00 | CNY – Manufacturing PMI (May) | 51.4 | 51.4 | – |
| 09:00 | CNY – Non-Manufacturing PMI (May) | 54.8 | 54.8 | – |
| 17:00 | EUR – CPI (YoY) (May) | 1.3% | 1.6% | – |
| 20:30 | USD – Core PCE Price Index (MoM) (Apr) | 0.2% | 0.1% | – |
| 20:30 | USD – Initial Jobless Claims | 234K | 234K | – |
| 20:30 | USD – Personal Income (MoM) (Apr) | 0.3% | 0.3% | – |
| 20:30 | USD – Personal Spending (MoM) (Apr) | 0.4% | 0.4% | – |
| 20:30 | CAD – GDP (MoM) (Mar) | 0.4% | 0.2% | – |
| 22:00 | USD – Pending Home Sales (MoM) (Apr) | 0.4% | 1.1% | – |
| 23:00 | CrudeOIL – Crude Oil Inventories | 5.778M | 2.214M | – |
| 23:00 | CrudeOIL – Gasoline Inventories | 1.883M | – | – |
GBPUSD
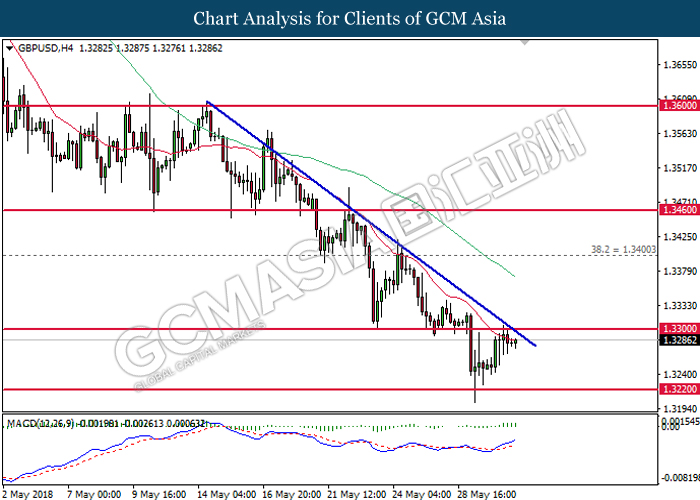
GBPUSD, H4: GBPUSD was traded lower following prior retracement from the downward trendline. However, MACD histogram which illustrate upward signal may suggest the pair to extend its gains and retest near the downward trendline at 1.3300 in short-term.
Resistance level: 1.3300, 1.3400
Support level: 1.3220, 1.3140
EURUSD
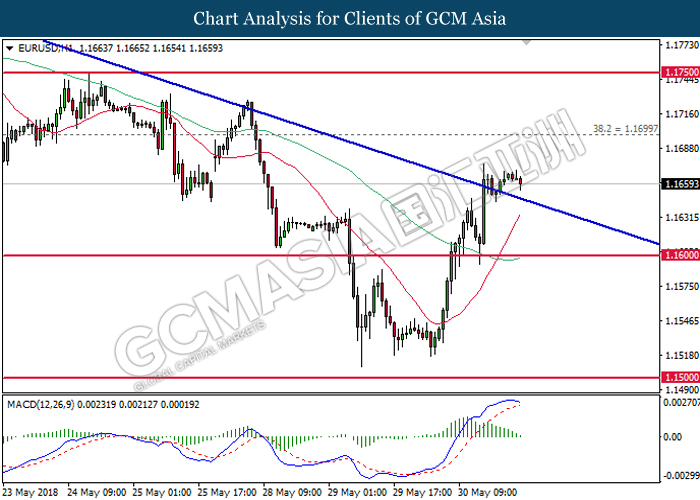
EURUSD, H1: EURUSD was traded higher following prior breakout from the downward trendline. However, MACD histogram which illustrate diminishing upward momentum may suggests the pair to be traded lower in short-term as technical correction, towards the direction of 20-MA line (red).
Resistance level: 1.1700, 1.1750
Support level: 1.1600, 1.1500
USDJPY
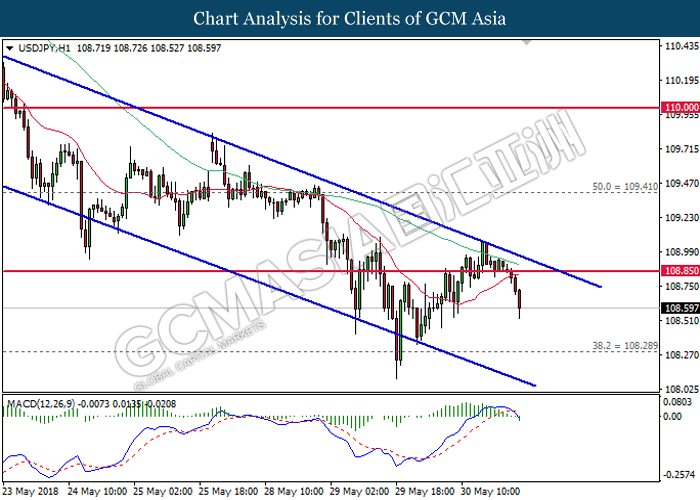
USDJPY, H1: USDJPY remained traded within a descending channel following prior retracement from the top level. MACD histogram which has formed a death cross signal suggests the pair to extend its losses, towards the direction of support level at 108.30.
Resistance level: 108.85, 109.40
Support level: 108.30, 107.50
CrudeOIL
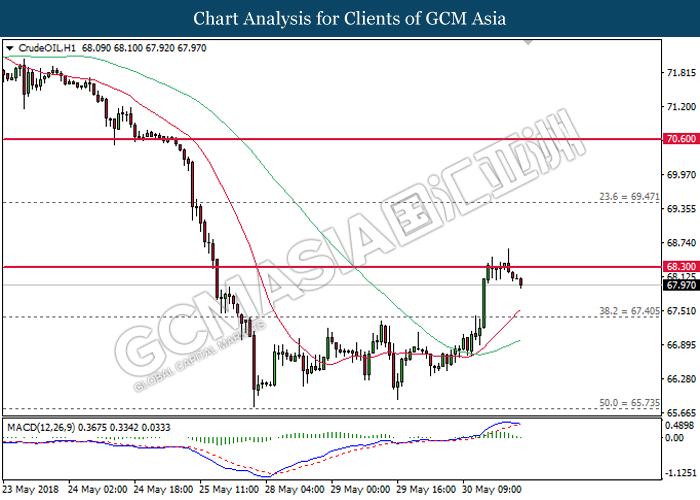
CrudeOIL, H1: Crude oil price was traded lower following prior retracement from the resistance level at 68.30. MACD histogram which illustrate diminished upward momentum may suggest the commodity price to extend its losses in short-term as technical correction, towards the 20-MA line (red).
Resistance level: 68.30, 69.45
Support level: 67.40, 65.75
GOLD
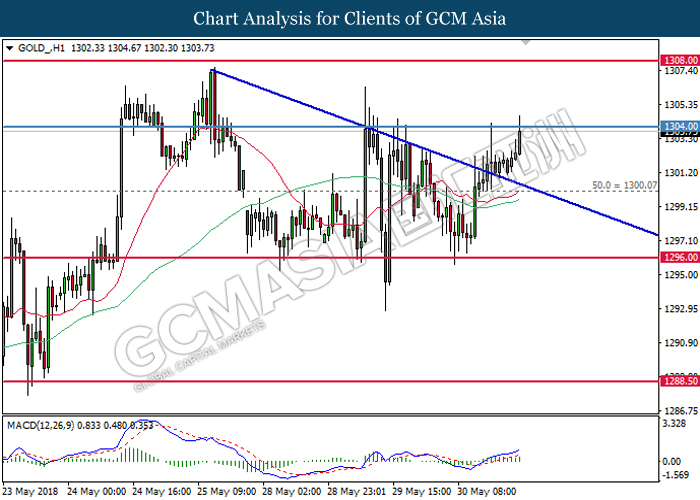
GOLD_, H1: Gold price extended gains following prior breakout from the top level of descending triangle. MACD histogram which illustrate upward signal suggests further bullish momentum. However, a close above the minor resistance at 1304.00 is required to attain further validation.
Resistance level: 1304.00, 1308.00
Support level: 1300.00, 1296.00