210518 Weekly Analysis
21 May 2018 Weekly Analysis
GCMAsia Weekly Report: May 21 – 25
Market Review (Forex): May 14 – 18
US dollar extended its bullish rally last Friday over the backdrop of higher anticipation towards the Federal Reserve to adopt aggressive measures in tightening their monetary policy. The dollar index rose 0.21% while peaking at fresh five-months high of 93.66 during late Friday trading.
Dollar has recovered extensively after bottoming out at 89.00 past few weeks ago due to recent positive progression in US economic performance when being compared to other nations. Over that backdrop, it has evoked bullish momentum on US Treasury yield which successfully breaches 3.000% threshold and peaking at 7-year’s high of 3.126%.
The rise in bond yields came along after recent economic data point towards higher inflationary pressure which catalyzed market speculation for the Federal Reserve to increase interest rate more rapidly to curb rising consumer prices. The Fed raised its rates in March and they are expected to raise rate twice more this year while some expecting for a third hike.
USD/JPY
Pair of USD/JPY remained unchanged at 110.77 during late Friday trading albeit recording a weekly gain of 1% last week.
EUR/USD
Euro extended losses by 0.20% to $1.1771 against the US dollar. The single common currency came under pressure amid higher political uncertainty in Italy after Five-Star movement and League reached a coalition agreement to govern the country which may jeopardize the country’s finances due to bulky spending proposals.
GBP/USD
Pair of GBP/USD dipped 0.34% while closing the week at $1.3470.
Market Review (Commodities): May 14 – 18
GOLD
Gold price received higher demand on last Friday following rising political uncertainty stemmed from the European Union albeit gains remained limited due to higher US bond yields. Price of the safe-haven asset extended gains by 0.17% while closing the week around $1,293.14 a troy ounce.
Despite the uptick, gold prices recorded an extensive loss of 1.60% as it struggled to pare its losses after US bond yields rallied sharply. Generally, rising bond yields will lead to a rise in the US dollar which may pressure gold prices due to higher opportunity cost to hold gold as an asset which does not pay any interest.
Crude Oil
Crude oil prices settled lower albeit recording a weekly gain following mixed signals from the global oil market. Price of the black commodity settled down 22 cents or 0.31% to $71.39 per barrel while recording a weekly gain of 0.46%.
Initially, crude oil price received some bullish uptick after United States pulled out from the nuclear agreement with Iran. The announcement which came last two weeks ago renewed market expectation for fresh sanctions to be enacted upon the oil producing country which could ease some pressure on global oversupply glut. The potential impact on global crude supplies from imminent US sanctions are yet to be known as Europe and China refused to support such restrictions.
However, concerns over rising US production continued to overshadow positive indication in the global market as analyst claims that rising output may jeopardize OPEC’s effort in rebalancing the global oil supply and demand levels. As such, Baker Hughes reported that the number of oil rigs in the US was unchanged at 844 but remained at its highest level since March 20th, 2015.
Weekly Outlook: May 21 – 25
For the week ahead, investors will be paying attention to the release of inflation data from the United Kingdom in order to gauge Bank of England’s next take on their monetary policy. Otherwise, investors will also keep an eye on FOMC meeting minutes scheduled to be released on Thursday to attain further signals with regards to future interest rate hikes.
As for oil traders, they will be eyeing on US inventories level reported by API and EIA to gauge the strength of crude demand for world’s largest oil consumer.
Highlighted economy data and events for the week: May 21 – 25
| Monday, May 21 |
Data N/A
Events CrudeOIL – OPEC Meeting
|
| Tuesday, May 22 |
Data GBP – CBI Industrial Trends Orders (May) CAD – Wholesale Sales (MoM) (Mar) CrudeOIL – API Weekly Crude Oil Stock
Events USD – FOMC Member Bostic Speaks USD – FOMC Member Harker Speaks USD – FOMC Member Kashkari Speaks
|
| Wednesday, May 23 |
Data EUR – German GDP (QoQ) (Q1) EUR – German Manufacturing PMI (May) EUR – Manufacturing PMI (May) EUR – Markit Composite PMI (May) EUR – Services PMI (May) GBP – CPI (YoY) (Apr) USD – New Home Sales (Apr) USD – Manufacturing PMI (May) USD – Markit Composite PMI (May) USD – Services PMI (May) CrudeOIL – Crude Oil Inventories CrudeOIL – Gasoline Inventories
Events N/A
|
| Thursday, May 24 |
Data EUR – German GDP (QoQ) (Q1) EUR – GfK German Consumer Climate (Jun) GBP – Retail Sales (MoM) (Apr) USD – Initial Jobless Claims USD – Existing Home Sales (Apr)
Events USD – FOMC Meeting Minutes GBP – Inflation Report Hearings
|
|
Friday, May 25
|
Data JPY – Tokyo Core CPI (YoY) (Mar) EUR – German Ifo Business Climate Index (May) GBP – GDP (QoQ) (Q1) USD – Core Durable Goods Orders (MoM) (Apr) USD – Michigan Consumer Sentiment (May) CrudeOIL – US Baker Hughes Oil Rig Count
Events USD – FOMC Member Harker Speaks USD – Fed Chair Powell Speaks USD – FOMC Member Bostic Speaks USD – FOMC Member Kaplan Speaks
|
Technical Weekly Outlook: May 21 – 25
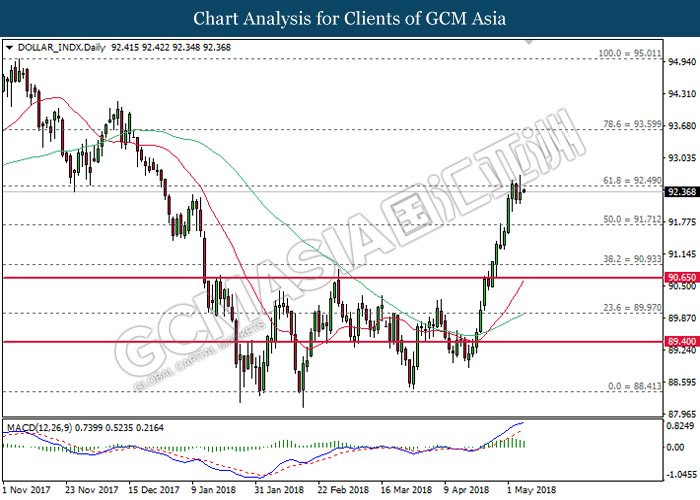
Dollar Index
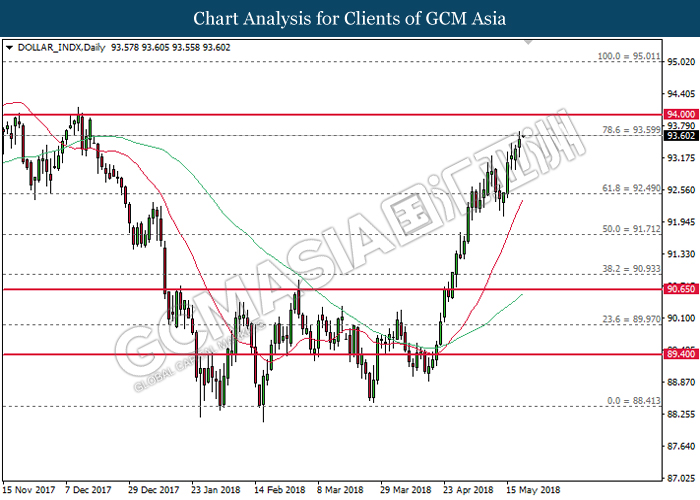
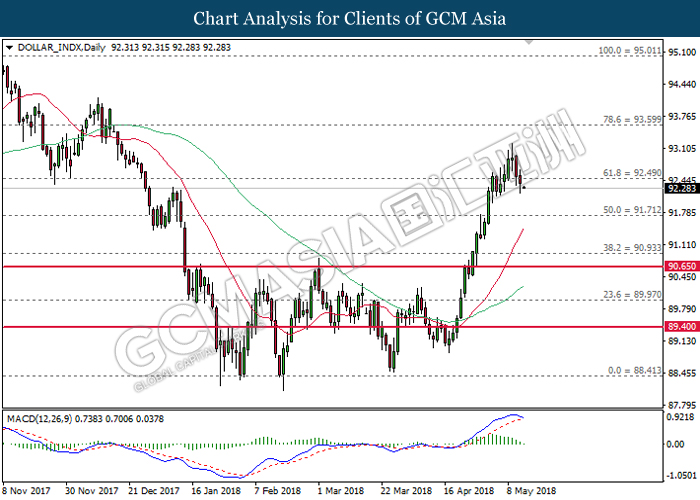
DOLLAR_INDX, Daily: Dollar index extended gains following prior rebound and closure above the resistance level at 92.50. Both MA line which continues to expand upwards suggests the index to advance further up after breaking the target at 93.60.
Resistance level: 93.60, 94.00
Support level: 92.50, 91.70
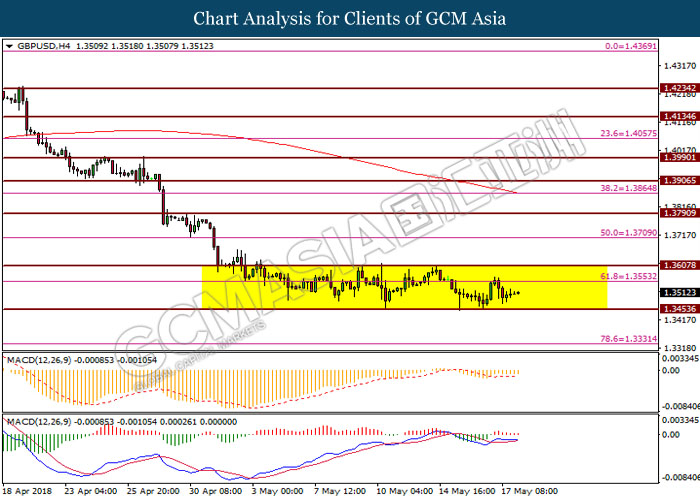
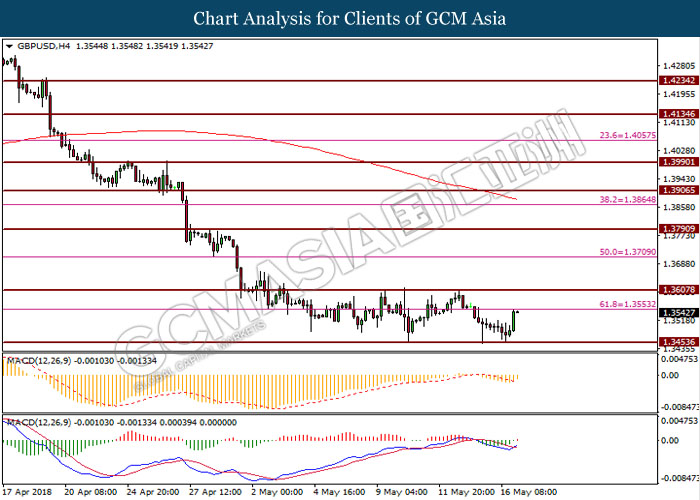
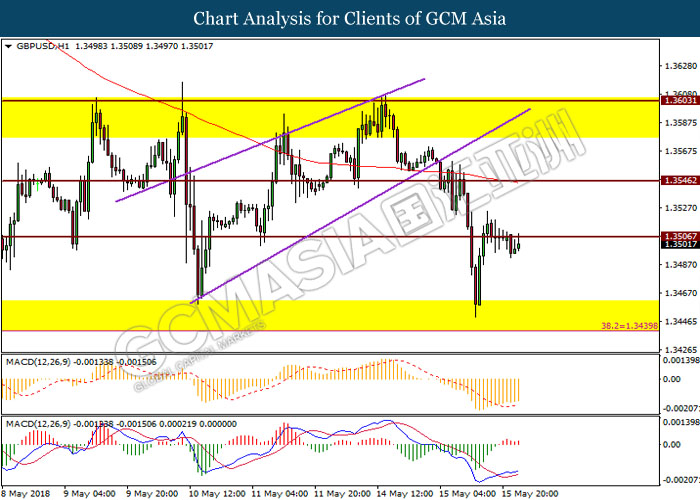
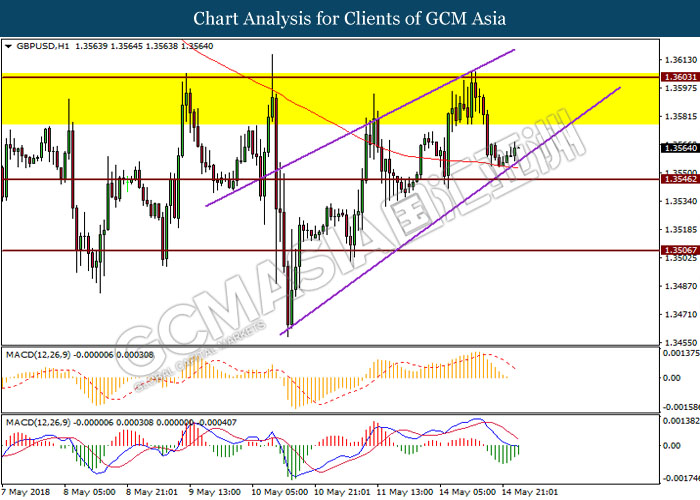
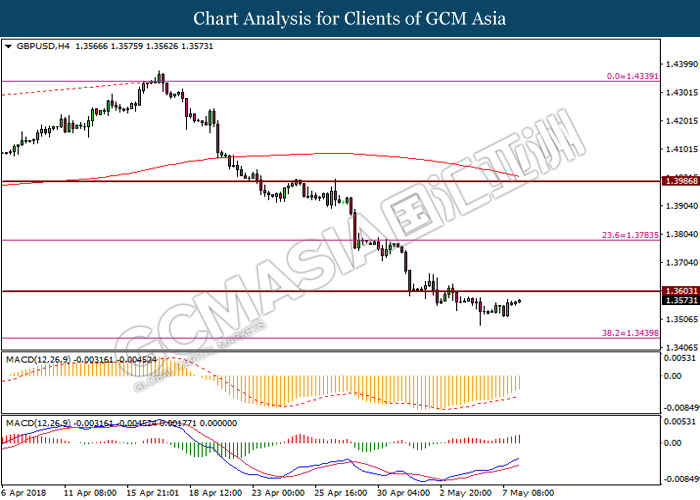
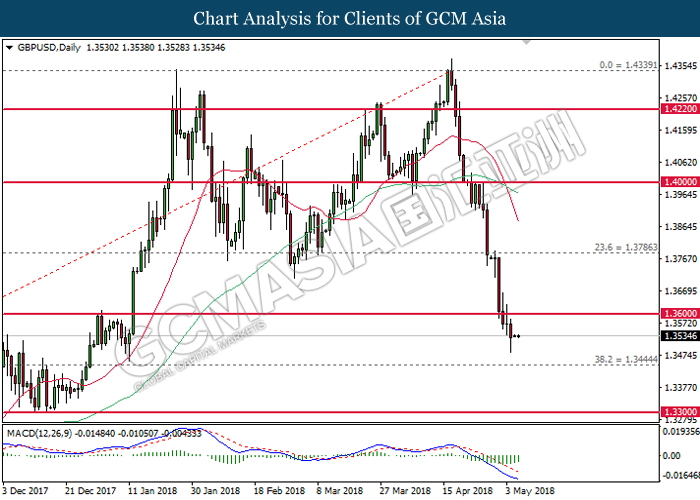
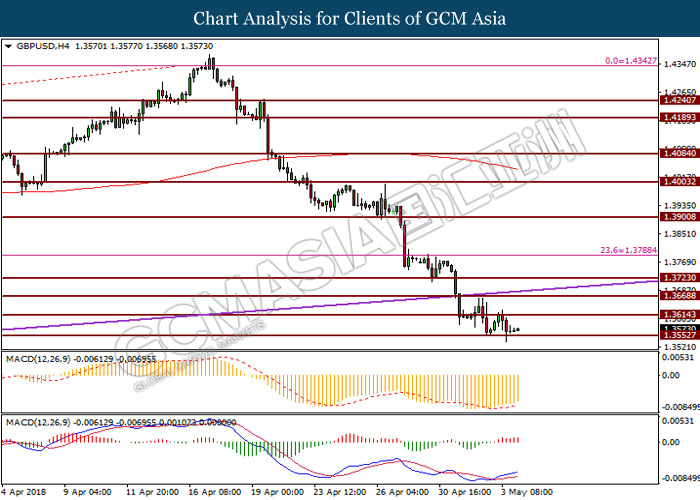
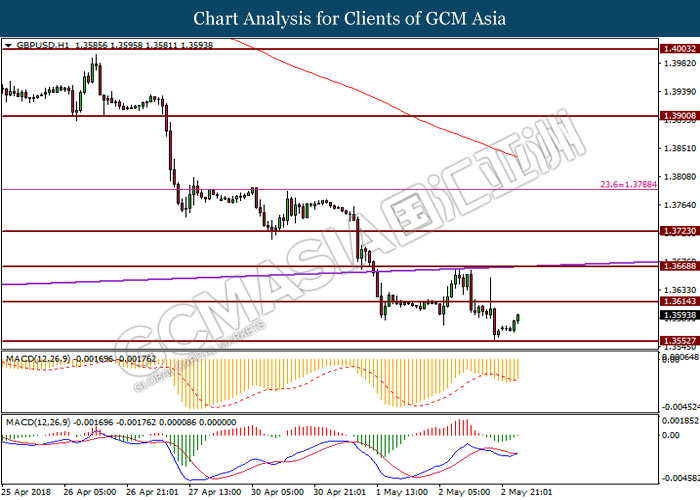
GBPUSD
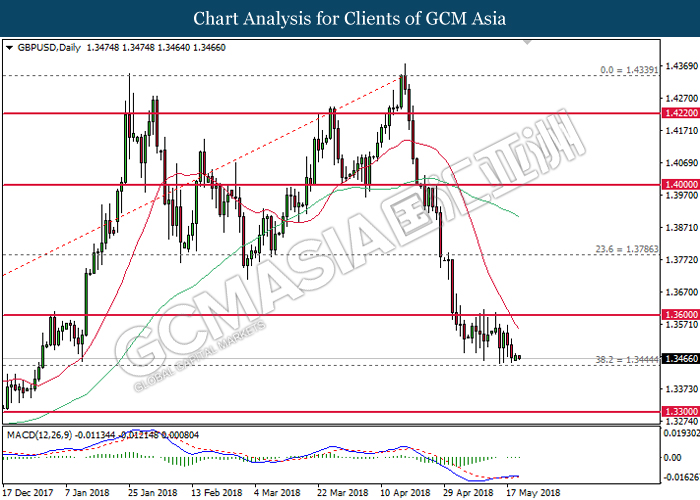
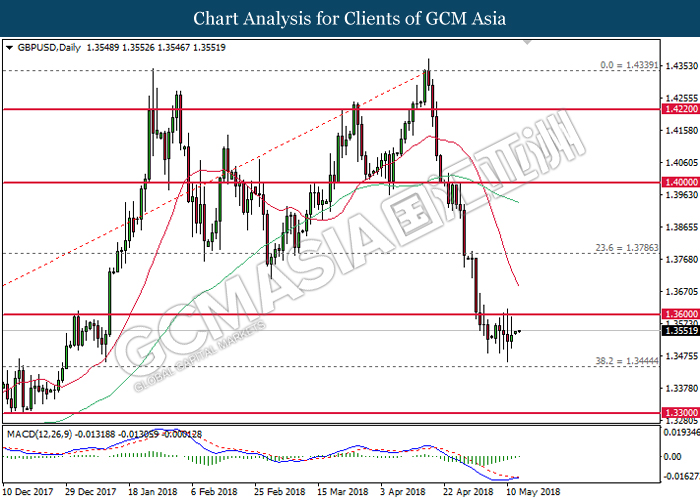
GBPUSD, Daily: GBPUSD extended losses following prior retracement from the resistance level at 1.3600. MACD histogram which begins to form a downward signal suggests the pair to extend its prior losses in the event of a breakout from the support level of 1.3445.
Resistance level: 1.3600, 1.3785
Support level: 1.3445, 1.3300
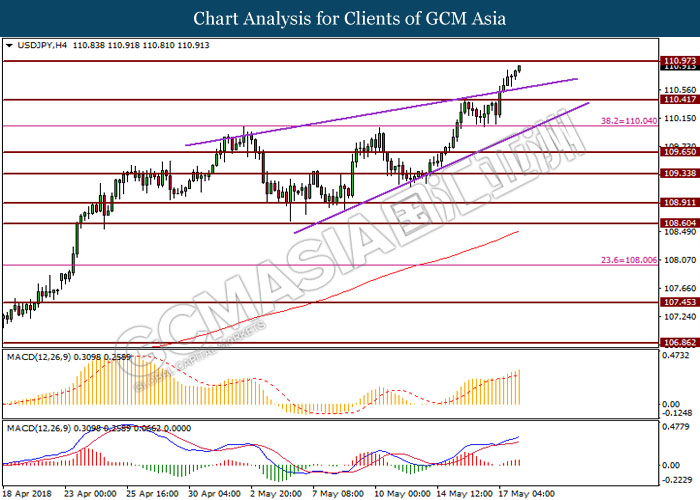
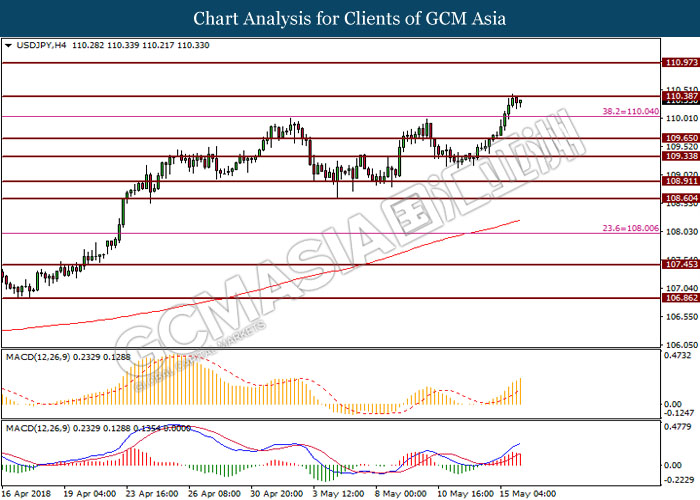
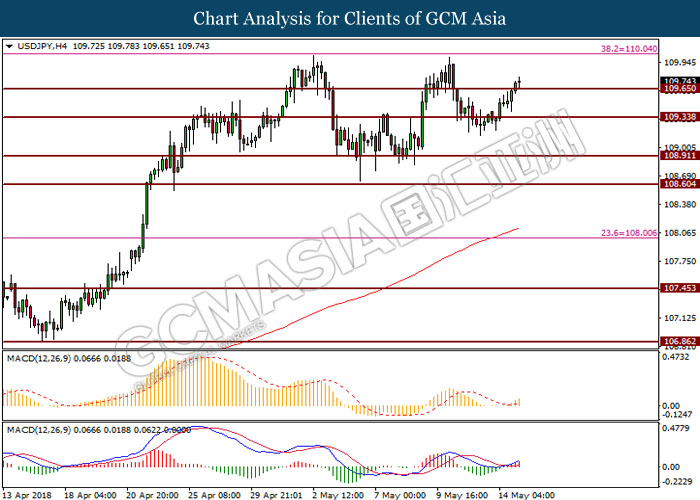
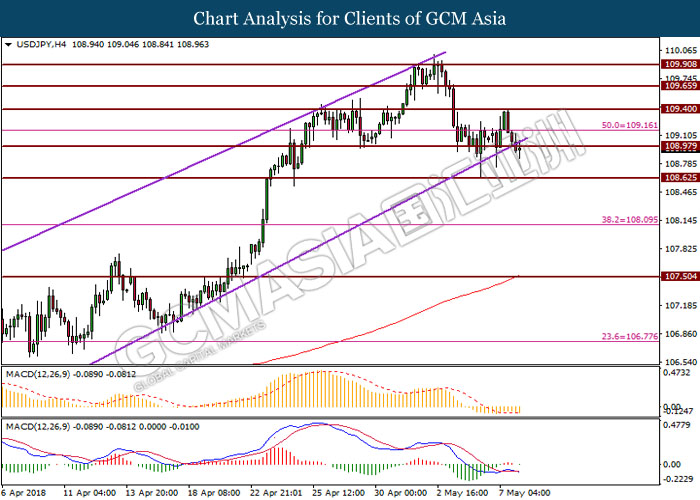
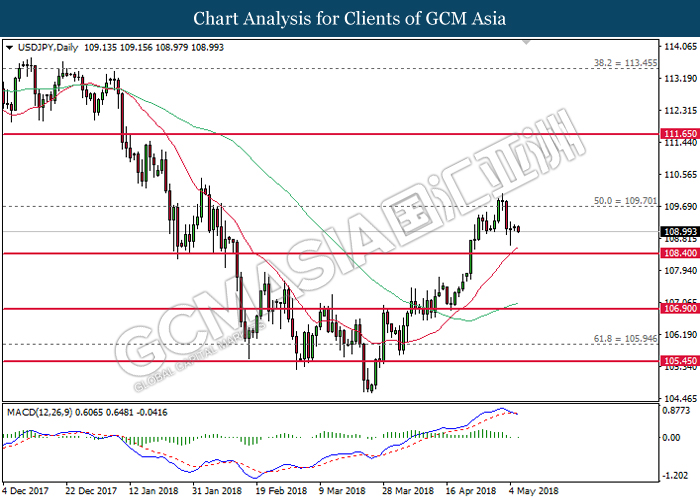
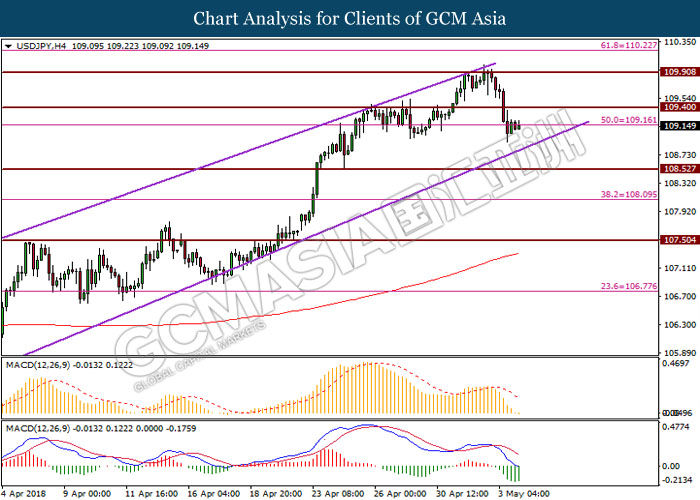
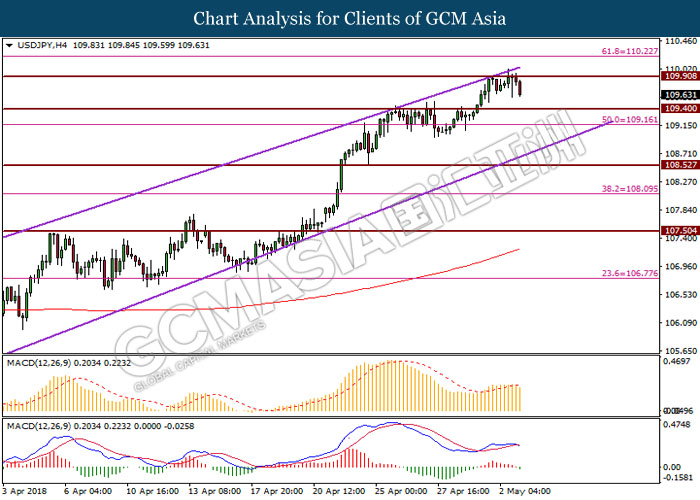
USDJPY
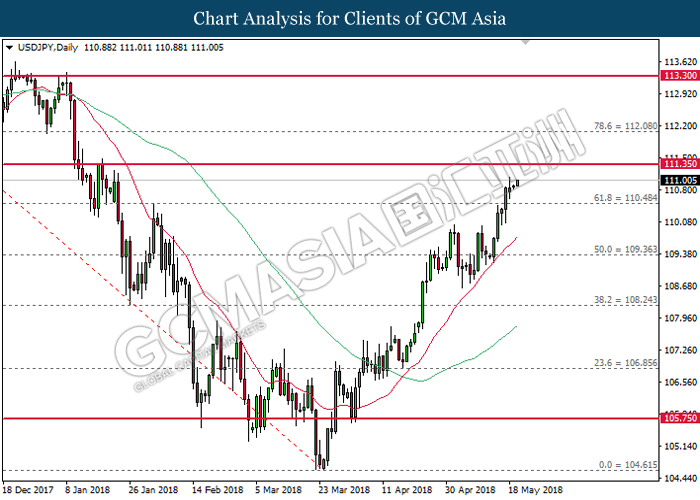
USDJPY, Daily: USDJPY advance further upwards following prior breakout from the resistance level at 110.50. Both MA line which continues to expand upwards suggests the pair to extend its gains towards the direction of resistance level near 111.35.
Resistance level: 111.35, 112.10
Support level: 110.50, 109.35
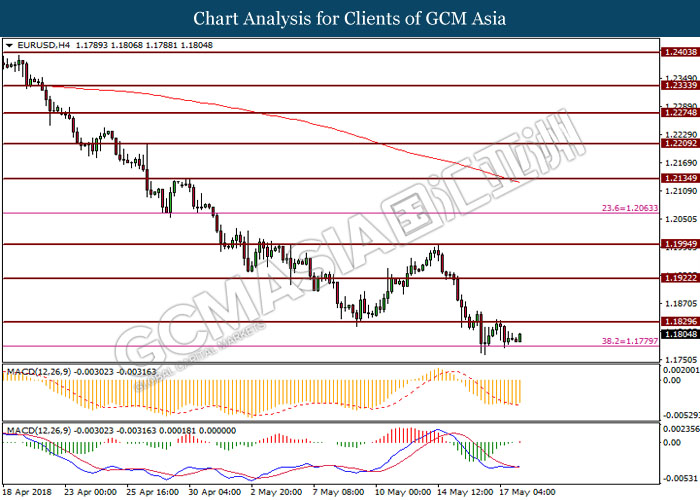
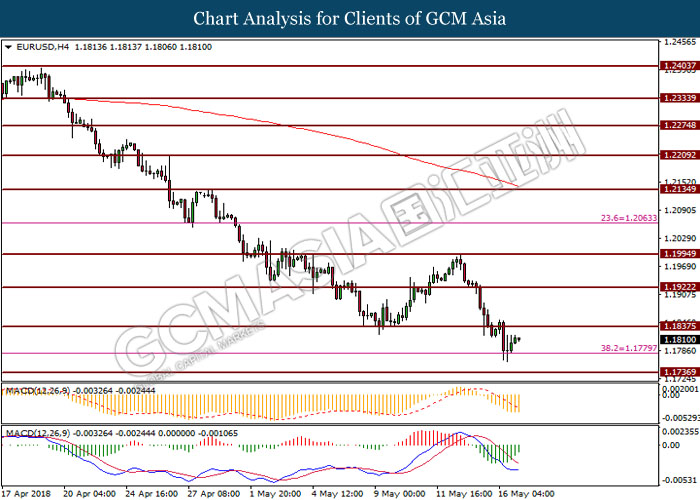
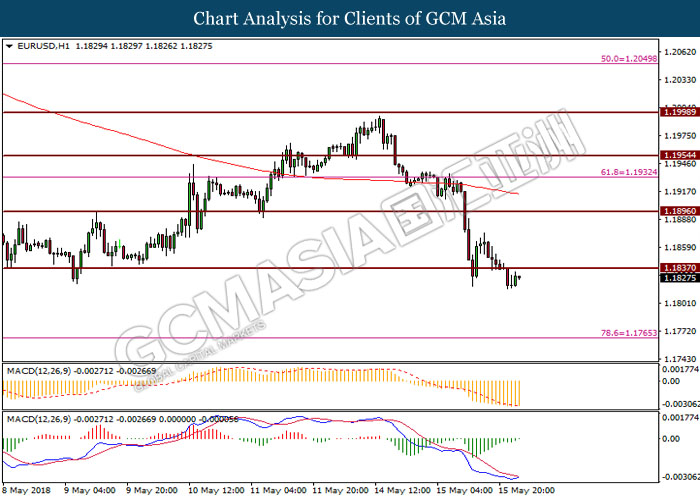
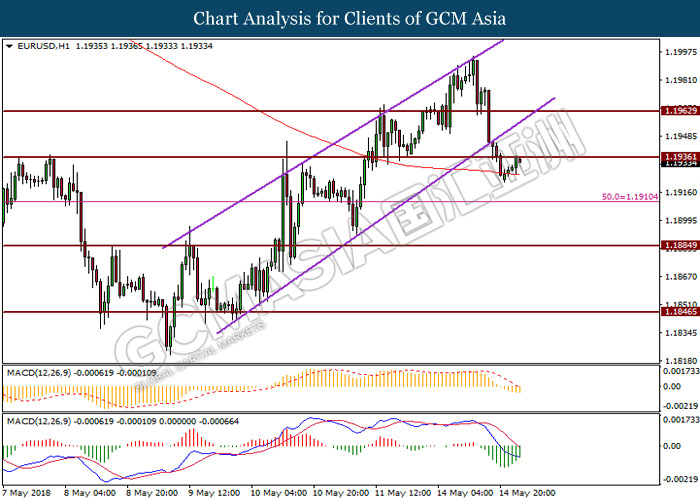
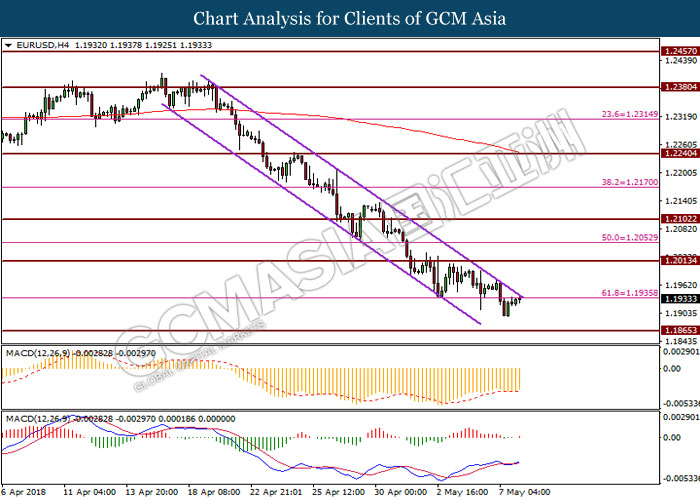
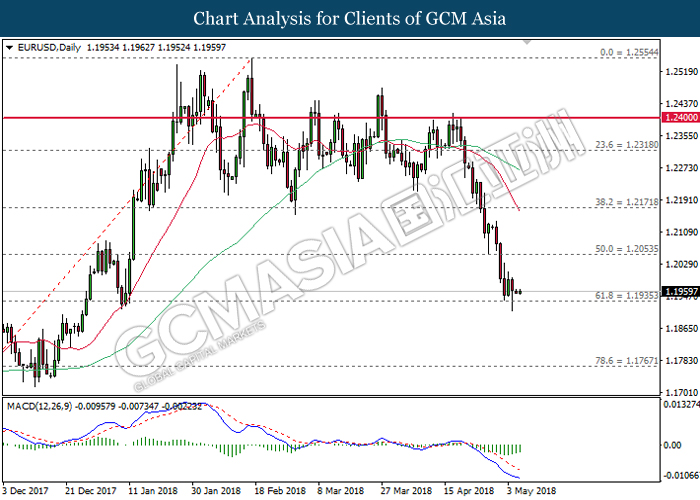
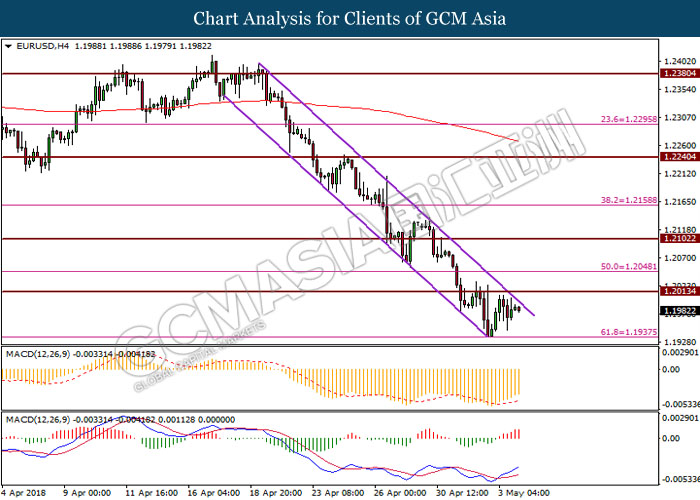
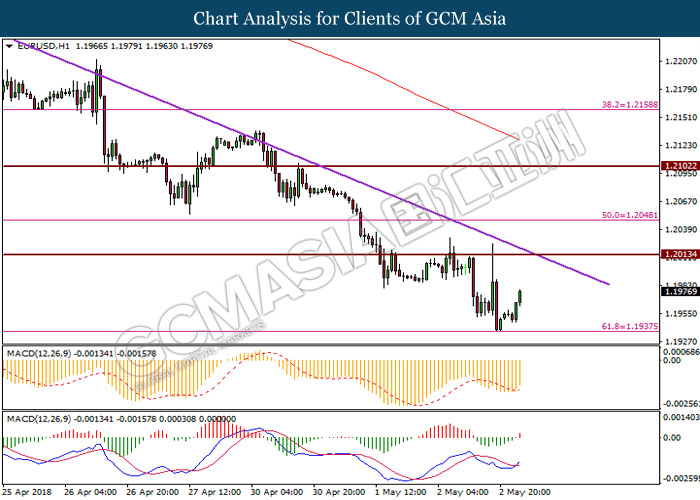
EURUSD
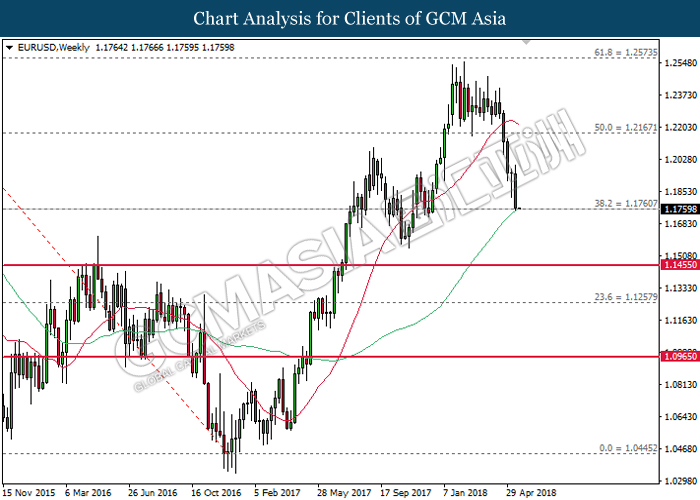
EURUSD, Weekly: EURUSD tumbled lower following prior closure below the 20-MA line (red). Recent price action suggests further bearish bias and thus a close below the 60-MA line (green) at 1.1760 would suggests the pair to extend its losses, towards next target at 1.1455 thereafter.
Resistance level: 1.2170, 1.2575
Support level: 1.1760, 1.1455
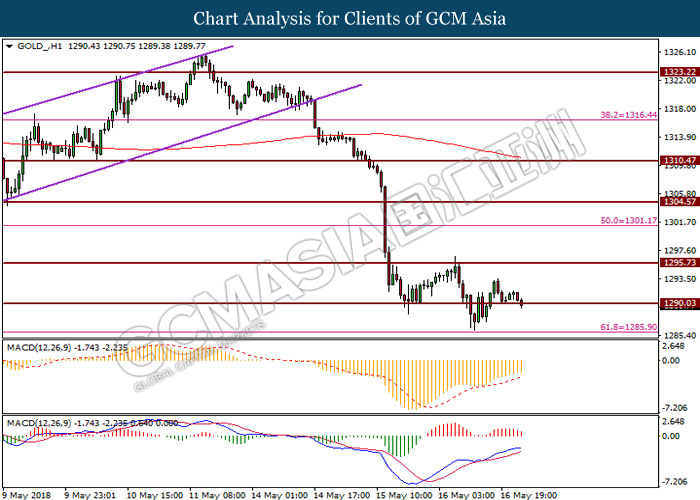
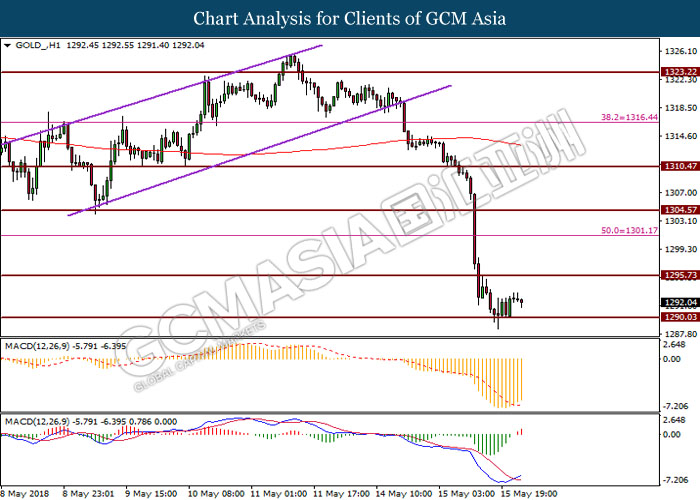
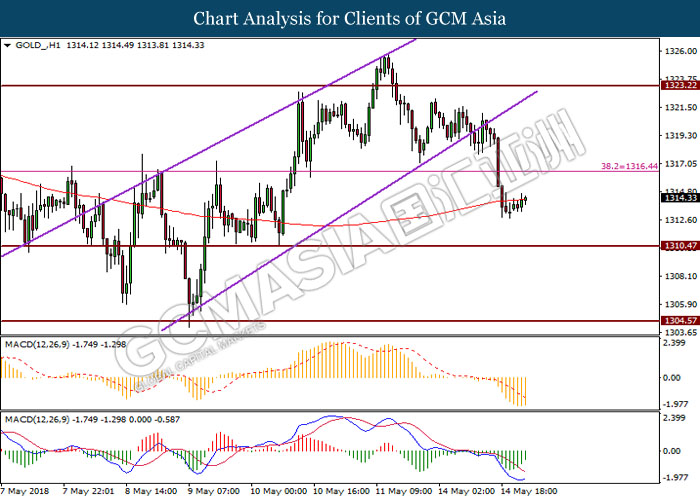
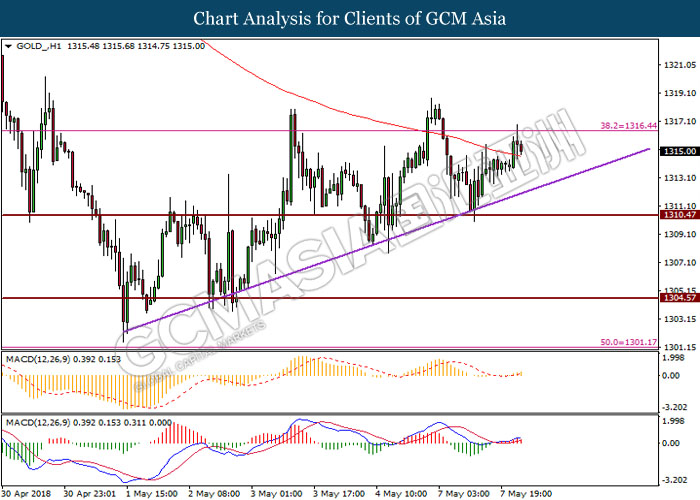
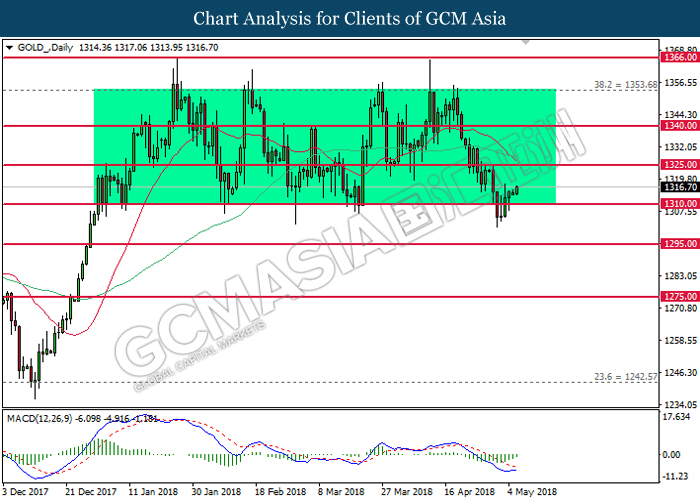
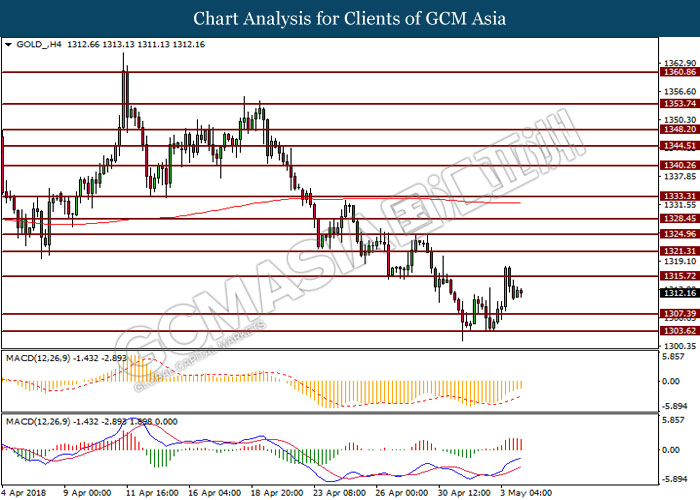
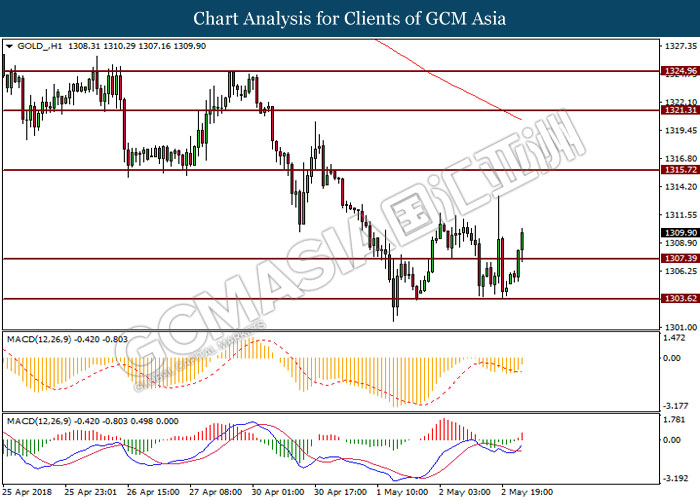
GOLD
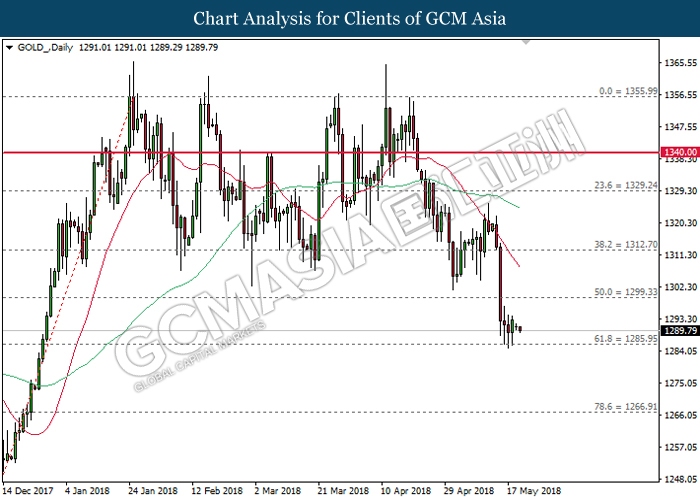
GOLD_, Daily: Gold price advanced further down following prior closure below the support level of 1300.00. Both MA line which continues to expand downwards suggests the commodity price to extend its losses after closing below the support level of 1285.95.
Resistance level: 1300.00, 1312.70
Support level: 1285.95, 1266.90
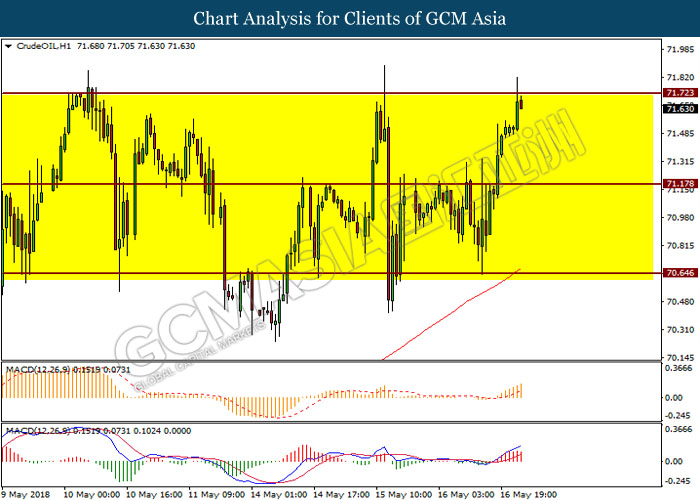
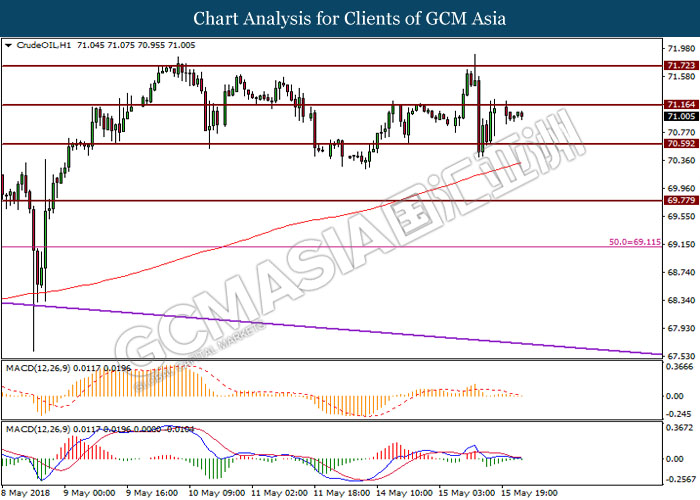
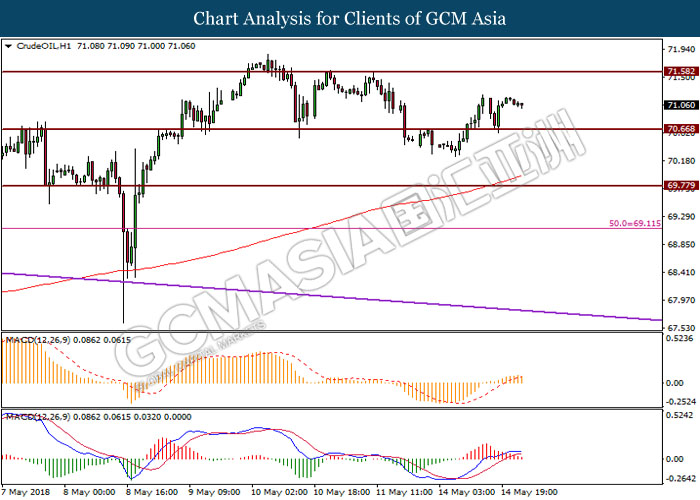
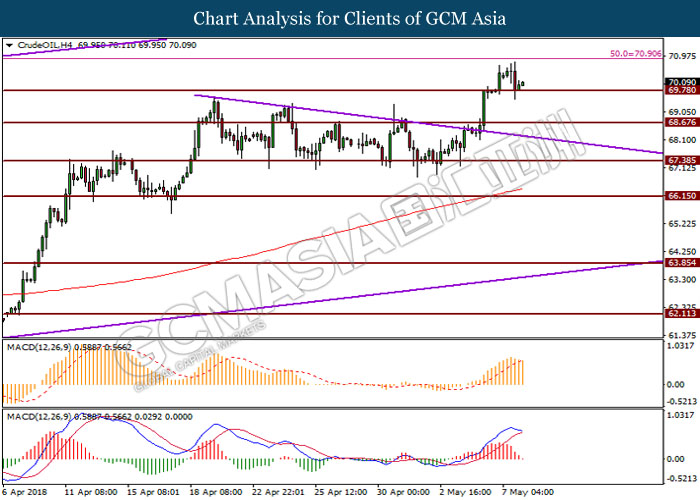
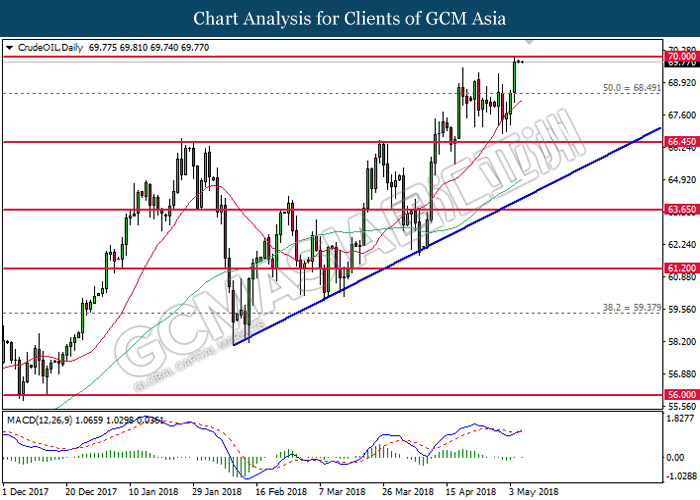
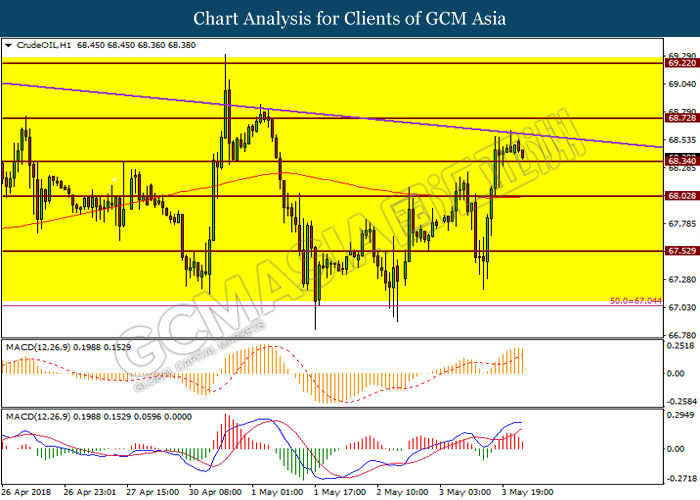
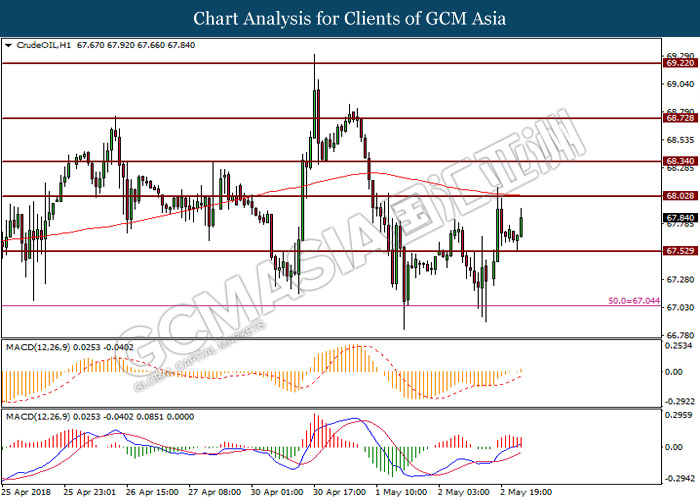
Crude Oil
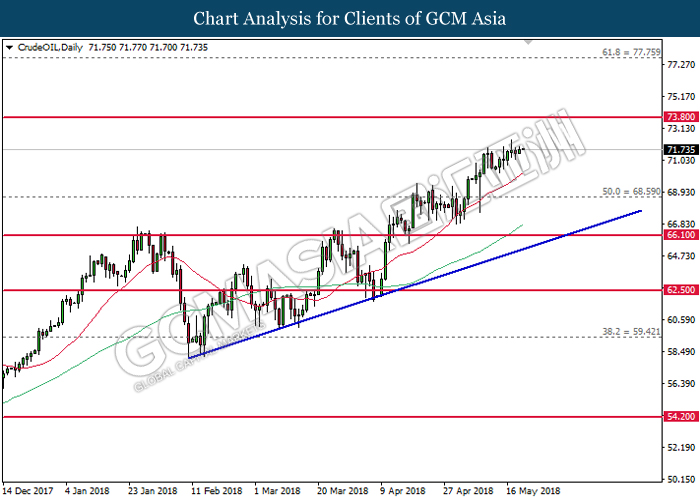
CrudeOIL, Daily: Crude oil price was traded higher following prior breakout from the resistance level of 68.60. Both MA lines which continues to expand upwards in tandem of current major trend suggests the commodity price to advance further upwards, towards the target of resistance level at 73.80.
Resistance level: 73.80, 77.75
Support level: 68.60, 66.10
180518 Daily Analysis
18 May 2018 Daily Analysis
Solid growth of U.S. bond yields supported Greenback.
Dollar index was traded flat against its major peers near its 5-month high, last stood at 93.43 following the release of mixed economic data in the region. Overnight, the U.S. Department of Labor reported an increase in initial jobless claims by 10,000 to a seasonally adjusted 222,000 last week, missing the forecast reading of 215,000. Nonetheless, losses of the Greenback was limited after Philadelphia Fed Manufacturing Index reflected an actual reading of 34.4 versus the expected reading of 21.0. All in all, Greenback remains supported above its 93.00 key level as U.S. bond yields rose to its highest level since 2011 at 3.122% yesterday. On the contrary, EUR/USD fell 0.01% to $1.1804 following ongoing concerns of market participants over the formation of a new governing coalition in Italy that could provoke political uncertainty in the region.
In the commodities market, crude oil price rose 0.14% to $71.70 per barrel following an optimistic market sentiment towards U.S. sanctions on Iran’s oil exports enough to suppress crude supplies in global market. Otherwise, gold price fell by 0.13% to $1288.51 a troy ounce following rising U.S. treasury yields continued to sap the appeal of the precious metal.
Today’s Holiday Market Close
Time Market Event
N/A
Today’s Highlight Events
Time Market Event
15:00 USD FOMC Member Mester Speaks
21:15 USD FOMC Member Brainard Speaks
21:15 USD FOMC Member Kaplan Speaks
Today’s Highlight Economy Data
| Time | Nation & Data | Previous | Forecast | Actual |
| 07:30 | JPY – National Core CPI (YoY) (Apr) | 0.9% | 0.8% | 0.7% |
| 14:00 | EUR – German PPI (MoM) (Apr) | 0.1% | 0.3% | – |
| 20:30 | CAD – Core CPI (MoM) (Apr) | 0.2% | – | – |
| 20:30 | CAD – Core Retail Sales (MoM) (Apr) | 0.0% | 0.5% | – |
| 01:00 | CrudeOIL – US Baker Hughes Oil Rig Count | 844 | – | – |
GBPUSD
GBPUSD, H4: GBPUSD was traded within consolidation with absence of obvious momentum from candlestick pattern formation and MACD. Thus it is suggested to wait for confirmation breakout to grasp the next direction of the pair in the near future.
Resistance level: 1.3550, 1.3610
Support level: 1.3450, 1.3330
EURUSD
EURUSD, H4: EURUSD was traded higher prior rebound from support level at 1.1780. Golden-cross as displayed by MACD signal line would suggest the pair to extend its gains towards the resistance level at 1.1830.
Resistance level: 1.1830, 1.1920
Support level: 1.1780, 1.1740
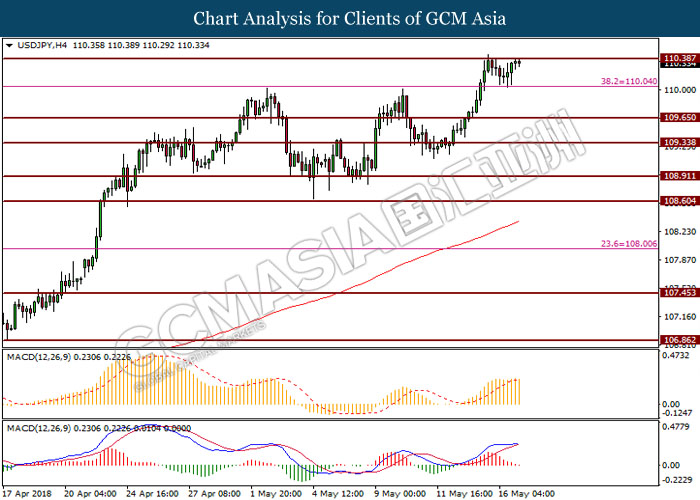
USDJPY
USDJPY, H4: USDJPY was traded higher prior breaking trend line of ascending wedge. MACD that displays ongoing bullish momentum would suggest the pair to extend its gains towards the resistance level at 111.00.
Resistance level: 111.00, 111.70
Support level: 110.40, 110.00
CrudeOIL

CrudeOIL, H4: Crude oil price was traded lower prior breaking support level at 71.70. Formation of engulfing candlestick pattern and death-cross as shown by MACD signal line would suggest the commodity price to extend its losses towards the trend line of ascending wedge.
Resistance level: 71.70, 72.20
Support level: 71.20, 70.60
GOLD

GOLD_, H1: Gold price was traded lower after breaking support level at 1290.00. Death-cross that is going to be formed by MACD signal line would suggest the safe-haven asset price to extend its losses towards the support level at 1285.90.
Resistance level: 1290.00, 1295.70
Support level: 1285.90, 1276.70
170518 Daily Analysis
17 May 2018 Daily Analysis
Dollar-bull takes a breather over mixed economic data.
Dollar index was traded lower against a trade-weighted basket of major currencies by 0.09% to 93.15 following a mixed bag of economic data in the region while recent recovery of Euro added selling pressure on the Greenback. Overnight, Greenback received its initial boast after building permits rose by 1.8% to 1.347 million units versus the expected reading for 2.3% decline, while U.S. industrial output recorded gains of 0.7% as compared to the economists’ forecast for 0.5% gains. However, gains on the Greenback was erased following a weaker-than-expected U.S. homebuilding data, last stood at 3.7% decline versus the forecast reading of 0.7% decline. The currency has failed to stand on its foot following recent rebound of Euro from its low level despite reports that Italy’s anti-establishment 5-Star Movement and anti-immigrant League may inquire the European Central Bank (ECB) to forgive $294.18 billion of debt. As of writing, EUR/USD pared its losses by 0.03% to $1.1810.
In the commodities market, crude oil price extended gains by 0.21% to 71.63 per barrel following a large draw in U.S. crude supplies by 1.404 million barrels last week versus the expected reading for a reduction of only 0.763 million barrels. Likewise, gold price recovered its losses by 0.17% to $1290.70 a troy ounce following recent retracement of the Greenback.
Today’s Holiday Market Close
Time Market Event
N/A
Today’s Highlight Events
Time Market Event
06:30 USD FOMC Member Bullard Speaks
22:45 USD FOMC Member Kashkari Speaks
01:30 (Fri) USD FOMC Member Kaplan Speaks
Today’s Highlight Economy Data
| Time | Nation & Data | Previous | Forecast | Actual |
| 09:30 | AUD – Employment Change (Apr) | 4.9K | 20.3K | 22.6K |
| 09:30 | AUD – Unemployment Rate (Apr) | 5.5% | 5.5% | 5.6% |
| 20:30 | USD – Initial Jobless Claims | 211K | 219K | – |
| 20:30 | USD – Philadelphia Fed Manufacturing Index (May) | 23.2 | 21.0 | – |
| 20:30 | USD – Philly Fed Employment (May) | 27.1 | – | – |
| 20:30 | CAD – Foreign Securities Purchases (Mar) | 3.96B | – | – |
GBPUSD
GBPUSD, H4: GBPUSD was traded higher prior rebound from support level at 1.3450. Golden-cross as displayed by MACD signal line would give indication for the pair to trade higher if candlestick successfully closes above the 61.8 Fibonacci level.
Resistance level: 1.3550, 1.3610
Support level: 1.3450, 1.3330
EURUSD
EURUSD, H4: EURUSD was traded higher prior its failure to break support level at 1.1780. MACD signal line that shows diminishing bearish momentum would suggest the pair to extend its gains towards the resistance level at 1.1840.
Resistance level: 1.1840, 1.1920
Support level: 1.1780, 1.1680
USDJPY
USDJPY, H4: USDJPY was traded higher prior rebound from support level at 110.00. However, death-cross as formed by MACD signal line would suggest the pair to undergo short-term technical correction before extending its bullish bias.
Resistance level: 110.40, 110.90
Support level: 110.00, 109.70
CrudeOIL
CrudeOIL, H1: Crude oil price was traded lower prior retracement from resistance level at 71.70. A lack of momentum from candlestick pattern formation would suggest the commodity price to undergo short-term technical correction to trade lower before continuing its bullish bias again.
Resistance level: 71.70, 73.60
Support level: 71.20, 70.60
GOLD
GOLD_, H1: Gold price was traded higher after breaking resistance level at 1290.00. However, MACD signal line that is about to form a death-cross would indicate the safe-haven asset price to extend its losses if breakout at the previous high is successful.
Resistance level: 1295.70, 1301.20
Support level: 1290.00, 1285.90
160518 Daily Analysis
16 May 2018 Daily Analysis
Greenback propelled on bullish track following a break of Treasury yields above 3%.
Dollar index was traded higher against its major peers by 0.58% to 93.15 as of writing on the back of rising U.S. bond yields above 3% despite the release of mixed economic data yesterday. Overnight, the Commerce Department reported a fall in retail sales to 0.3%, missing the forecast reading for an increase of 0.4%. However, the losses endured following an upward revision of prior data for retail sales from 0.6% to 0.8% for the month of April. These solid figure has boasted sentiment of market participants that weakness seen in first-quarter consumer spending was only temporary. On the contrary, EUR/USD endured losses by 0.57% to $1.1826 after German GDP missed the expected reading of 1.8%, last stood at 1.6% which indicates that economic growth in the European zone has slowed down slightly in the first quarter.
In the commodities market, crude oil price rose 35 cents to $71.04 per barrel following an optimistic investors’ sentiment towards reduced global supplies following U.S. sanctions on Iran. Otherwise, gold price fell 1.83% to $1292.39 a troy ounce after investors’ appetite to hold the yellow metal was believed to have reduced following recent surge in the Greenback and U.S. bond yields.
Today’s Holiday Market Close
Time Market Event
N/A
Today’s Highlight Events
Time Market Event
16:00 CrudeOIL IEA Monthly Report
20:00 EUR ECB President Draghi Speaks
20:30 USD FOMC Member Bostic Speaks
Today’s Highlight Economy Data
| Time | Nation & Data | Previous | Forecast | Actual |
| 07:50 | JPY – GDP (QoQ) (Q1) | 0.1% | 0.0% | -0.2% |
| 09:30 | AUD – Wage Price Index (QoQ) (Q1) | 0.6% | 0.6% | 0.5% |
| 12:30 | JPY – Industrial Production (MoM) (Mar) | 1.2% | 1.2% | – |
| 14:00 | EUR – German CPI (MoM) (Apr) | 0.0% | 0.0% | – |
| 17:00 | EUR – CPI (YoY) (Apr) | 1.2% | 1.2% | – |
| 20:30 | USD – Building Permits (Apr) | 1.379M | 1.350M | – |
| 20:30 | USD – Housing Starts (Apr) | 1.319M | 1.324M | – |
| 21:15 | USD – Industrial Production (MoM) (Apr) | 0.5% | 0.5% | – |
| 22:30 | CrudeOIL – Crude Oil Inventories | -2.197M | -0.719M | – |
| 22:30 | CrudeOIL – Gasoline Inventories | -2.714M | – | – |
GBPUSD
GBPUSD, H1: GBPUSD was traded higher prior rebound from support area around 1.3440. Successful breakout above current resistance level at 1.3500 would indicate the pair to undergo short-term technical correction to trade higher towards the next resistance level at 1.3540.
Resistance level: 1.3500, 1.3540
Support level: 1.3440, 1.3300
EURUSD
EURUSD, H1: EURUSD was traded lower after breaking support level at 1.1840. However, golden-cross as displayed by MACD signal line would suggest the pair to undergo short-term technical correction to trade higher before continuing its downside bias.
Resistance level: 1.1840, 1.1900
Support level: 1.1770, 1.1720
USDJPY
USDJPY, H4: USDJPY was traded higher following breaking resistance level at 110.00. MACD signal line that displays ongoing bullish momentum would suggest the pair to extend its gains if breakout at the next resistance level 110.40 is successful.
Resistance level: 110.40, 110.90
Support level: 110.00, 109.60
CrudeOIL
CrudeOIL, H1: Crude oil price was traded lower prior retracement from resistance level at 71.20. A lack of obvious signal from both candlestick pattern and MACD would suggest to wait for confirmation breakout to grasp the movement of the commodity price in the near future.
Resistance level: 71.20, 71.70
Support level: 70.60, 69.80
GOLD
GOLD_, H1: Gold price was traded higher after rebound from support level at 1290.00. Golden-cross as displayed by MACD signal line would suggest the commodity price to undergo short-term technical correction to trade higher before continuing its bearish bias.
Resistance level: 1295.70, 1301.20
Support level: 1290.00, 1286.00
150518 Daily Analysis
15 May 2018 Daily Analysis
Greenback rebounds following a rising U.S. bond yields.
Greenback was traded higher against a basket of major currencies by 0.1% to 92.45 following an uptick in U.S. bond yields as U.S. – China trade tensions eased. Overnight, the benchmark 10-year U.S. Treasury yield rose 2 basis points to 2.999% in the wake of U.S. President Donald Trump’s pledge to help Chinese telecommunications company namely ZTE Corp. The latter was being penalized for violating U.S. sanctions with Iran. The rise in U.S. Treasury yields highlighted wide interest rate gap between the U.S. and the other developed countries which has led to an overall optimistic market outlook towards a stronger dollar in near future. On the contrary, USD/CAD fell 0.20% to $1.2764 following recent surge in the oil prices attributed to a bullish outlook of the OPEC report released yesterday.
In the commodities market, crude oil price extended gains by 26 cents to $71.03 per barrel after OPEC monthly report has shown a fall of oil inventories in developed nations by 9 million barrels, implying its strong compliance with the output cut agreement. Otherwise, gold price fell by 0.30% to $1314.04 a troy ounce amid an uptick in U.S. bond yields.
Today’s Holiday Market Close
Time Market Event
N/A
Today’s Highlight Events
Time Market Event
09:30 AUD RBA Meeting Minutes
17:00 GBP Inflation Report Hearings
Today’s Highlight Economy Data
| Time | Nation & Data | Previous | Forecast | Actual |
| 10:00 | CNY – Industrial Production (YoY) (Apr) | 6.0% | 6.4% | – |
| 10:00 | CNY – Retail Sales (YoY) (Apr) | 10.1% | 10.0% | – |
| 14:00 | EUR – German GDP (QoQ) (Q1) | 0.6% | 0.4% | – |
| 16:30 | GBP – Average Earnings Index + Bonus (Mar) | 2.8% | 2.7% | – |
| 16:30 | GBP – Claimant Count Change (Apr) | 11.6K | 13.3K | – |
| 16:30 | GBP – Unemployment Rate (Mar) | 4.2% | 4.2% | – |
| 17:00 | EUR – German ZEW Economic Sentiment (May) | -8.2 | -8.0 | – |
| 17:00 | EUR – GDP (QoQ) (Q1) | 0.4% | 0.4% | – |
| 17:00 | EUR – ZEW Economic Sentiment | 1.9 | 2.0 | – |
| 20:30 | USD – Core Retail Sales (MoM) (Apr) | 0.2% | 0.5% | – |
| 20:30 | USD – Retail Sales (MoM) (Apr) | 0.6% | 0.4% | – |
| 22:00 | USD – Business Inventories (MoM) (Apr) | 0.6% | 0.2% | – |
| 04:30 | CrudeOIL – API Weekly Crude Oil Stock | -1.850M | – | – |
GBPUSD
GBPUSD, H1: GBPUSD was traded higher prior rebound from 200-MA line within an ascending wedge. MACD signal line that hovers above the neutral line would suggest bullish bias for the pair yet a golden-signal is required to verify the indication.
Resistance level: 1.3600, 1.3660
Support level: 1.3550, 1.3500
EURUSD
EURUSD, H1: EURUSD was traded higher prior rebound from 200-MA line. An upward twist of MACD signal line would suggest the pair on bullish bias yet a breakout above the resistance level at 1.1940 is required to verify the signal.
Resistance level: 1.1940, 1.1960
Support level: 1.1910, 1.1880
USDJPY
USDJPY, H4: USDJPY was traded higher prior breaking resistance level at 109.60. Golden-cross as displayed by MACD signal line would suggest the pair to extend its gains towards the next resistance level at 110.00 if current candlestick successfully closes above its previous high.
Resistance level: 110.00, 110.40
Support level: 109.60, 109.30
CrudeOIL
CrudeOIL, H1: Crude oil price was traded higher prior rebound from support level at 70.65. However, MACD signal line that is about to form a death-cross would suggest the pair to undergo short-term technical correction to trade lower to retest its previous high.
Resistance level: 71.60, 73.60
Support level: 70.65, 69.75
GOLD
GOLD_, H1: Gold price was traded lower after breaking 200-MA line. However, MACD signal line that hovers upward would suggest the safe-haven asset price to undergo short-term technical correction to trade higher if candlestick successfully closes above the MA line.
Resistance level: 1316.40, 1323.20
Support level: 1310.50, 1304.60
140518 Weekly Analysis
14 May 2018 Weekly Analysis
GCMAsia Weekly Report: May 14 – 18
Market Review (Forex): May 7 – 11
Greenback slid lower against other major currencies for the third day on last Friday while investors booked their profits after it rallied to the highest level of the year due to boosted expectation for a faster pace of interest rate hike by the Federal Reserve. The dollar index was down 0.14% while quoted at 92.44 during late trading after touching four-months high of 93.26 on Wednesday.
Prior rally in the greenback loses its momentum following weaker-than-expected inflation data from last Thursday which has tempered some expectation for a more aggressive rate hike by the Feds. According to the US Bureau of Labor Statistics, Core CPI for the month of April came in at only 2.1%, missing economist expectation of 2.2%.
Adding on further upon the current bearish pressure was a lower-than-expected Import Price Index which came in with only 0.3% for the month of April, slightly lower than economist consensus for a 0.5% reading. Both data which has portrayed some sluggishness in inflationary pressure has led some investors to scale down their bullish bets for the time being.
US Core Inflation Rate
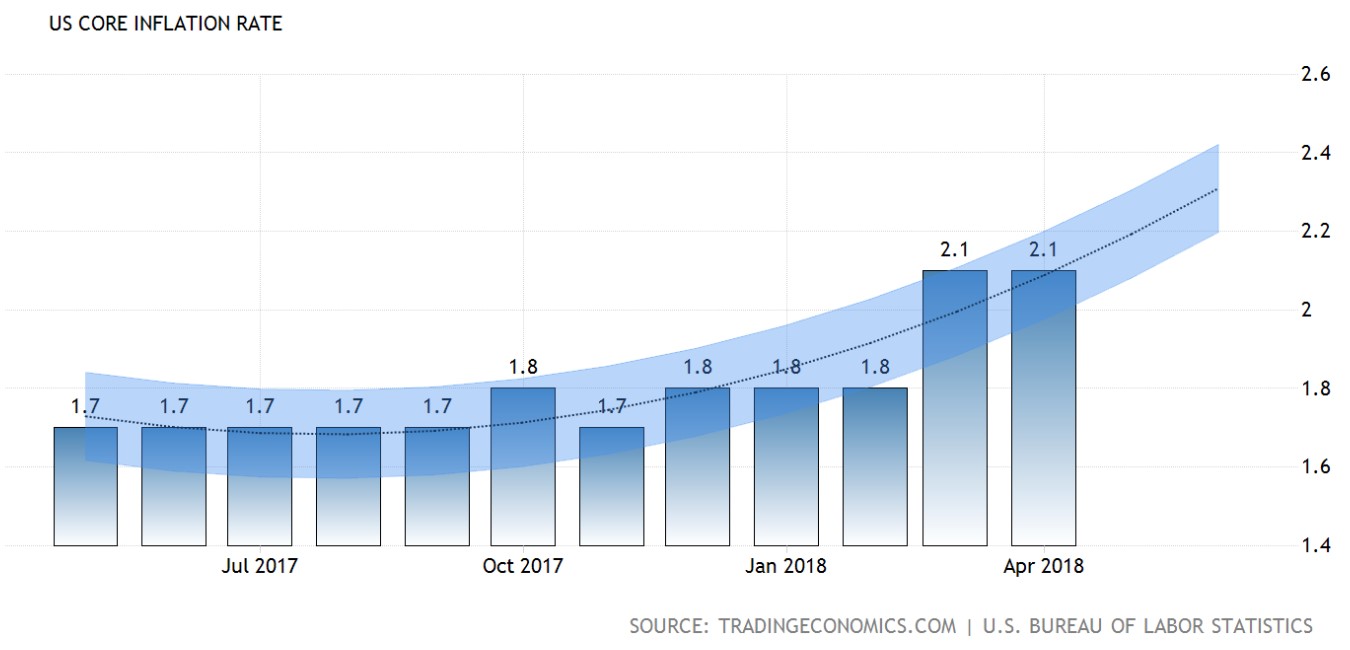
—– Forecast
US Core Inflation Rate came in with only 2.1%, missing economist forecast of 2.2% for the month of April.
US Import Price Index
US Import Price Index missed economist forecast with only 0.3% versus 0.5% seen.
USD/JPY
Pair of USD/JPY was little changed last Friday, last quoted at 109.39 while recording a weekly gain of 0.23%.
EUR/USD
Euro climbs further against the greenback, up 0.22% to $1.1941. However, gains remained capped following recessive economic momentum in the EU zone since the start of the year that may hinder ECB from making any changes to their stimulus program by September.
GBP/USD
Pairing of GBP/USD rose 0.17% to $1.3542 as investors book their profits on the greenback.
Market Review (Commodities): May 7 – 11
GOLD
Gold price ended lower last Friday as investors cheered over subsiding geopolitical risk from the Korean Peninsula over the announcement of summit details in between the US and North Korea during last week. Price of the yellow metal was down 0.24% while ended the week at $1,318.21 a troy ounce.
The announcement of summit between the United States and North Korea that are due to be held in Singapore next month has paved way for higher demand of riskier assets. Previously, heightened geopolitical risk between both nations has limit risk appetite in the market when US and North Korea threw war threats against each other, risking an imminent outbreak of nuclear war between both countries.
Crude Oil
Crude oil price settled lower last Friday while posting a weekly gain as market sentiment turned positive despite rising output from the United States. Price of the black commodity fell 1.25% to $70.52 albeit well supported above the $70 threshold.
According to the oilfield service provider, Baker Hughes reported that the number of active oil drilling rig in the US rose by 10 to 844. The uptick has raised expectation for a further ramp up in US output after data released on Wednesday showed that the domestic output has climbed by 84,000 barrels per day to 10.7 million barrels per day.
The level of output in US is now inching nearer to the world largest oil producer – Russia which currently clocks in at 11 million barrels per day. Yet, sentiment in the global oil market remained positive following United States decision to pull out from the Iranian Nuclear Deal last Tuesday which may prompt for fresh sanctions to be enacted on the oil producing country.
Fresh sanctions are expected to commerce on November 5th which may significantly limit Iranian’s oil export over the next six months with an estimated total of 250,000 barrels per day. Lower output in the market could ease the global supply glut which has been lingering for around three years while OPEC engage tirelessly to reduce its pressure by cutting daily oil output since early this year.
Weekly Outlook: May 14 – 18
For the week ahead, investors will be paying their attention on EU zone inflation report which may provide further indication of their economic momentum which may shed some light over ECB’s stimulus taper timing. Otherwise, major data releases from the Unites States which includes retail sales and Philly manufacturing index will also be sidelined in order to gauge Fed’s possibility to act more aggressively with regards to their rate hike pace.
As for oil traders, they will place their focus on monthly report from Organization of the Petroleum Exporting Countries (OPEC) and International Energy Agency to gauge global oil market demand and supply levels.
Highlighted economy data and events for the week: May 14 – 18
| Monday, May 14 |
Data N/A
Events USD – FOMC Member Mester Speaks CrudeOIL – OPEC Monthly Report USD – FOMC Member Bullard Speaks
|
| Tuesday, May 15 |
Data CNY – Industrial Production (YoY) (Apr) CNY – Retail Sales (YoY) (Apr) EUR – German GDP (QoQ) (Q1) GBP – Average Earnings Index +Bonus (Mar) GBP – Claimant Count Change (Apr) GBP – Unemployment Rate (Mar) EUR – German ZEW Economic Sentiment (May) EUR – GDP (QoQ) (Q1) EUR – ZEW Economic Sentiment USD – Core Retail Sales (MoM) (Apr) USD – Retail Sales (MoM) (Apr) USD – Business Inventories (MoM) (Apr)
Events AUD – RBA Meeting Minutes GBP – Inflation Report Hearings
|
| Wednesday, May 16 |
Data CrudeOIL – API Weekly Crude Oil Stock JPY – GDP (QoQ) (Q1) AUD – Wage Price Index (QoQ) (Q1) JPY – Industrial Production (MoM) (Mar) EUR – German CPI (MoM) (Apr) EUR – CPI (YoY) (Apr) USD – Building Permits (Apr) USD – Housing Starts (Apr) USD – Industrial Production (MoM) (Apr) CrudeOIL – Crude Oil Inventories CrudeOIL – Gasoline Inventories
Events CrudeOIL – IEA Monthly Report EUR – ECB President Draghi Speaks USD – FOMC Member Bostic Speaks
|
| Thursday, May 17 |
Data AUD – Employment Change (Apr) AUD – Unemployment Rate (Apr) USD – Initial Jobless Claims USD – Philadelphia Fed Manufacturing Index (May) USD – Philly Fed Employment (May) CAD – Foreign Securities Purchases (Mar)
Events USD – FOMC Member Bullard Speaks USD – FOMC Member Kashkari Speaks
|
|
Friday, May 18
|
Data JPY – National Core CPI (YoY) (Apr) EUR – German PPI (MoM) (Apr) CAD – Core CPI (MoM) (Apr) CAD – Core Retail Sales (MoM) (Apr) CrudeOIL – US Baker Hughes Oil Rig Count
Events USD – FOMC Member Kaplan Speaks USD – FOMC Member Mester Speaks USD – FOMC Member Brainard Speaks USD – FOMC Member Kaplan Speaks
|
Technical Weekly Outlook: May 14 – 18
Dollar Index
DOLLAR_INDX, Daily: Dollar index was traded lower following prior retracement and closure below the support level near 92.50. MACD histogram which illustrate diminishing upward momentum may suggest the pair to extend its losses in short-term as technical correction.
Resistance level: 92.50, 93.60
Support level: 91.70, 90.95
GBPUSD
GBPUSD, Daily: GBPUSD was traded higher following prior rebound near the support level at 1.3445. MACD histogram which illustrate the formation of golden cross signal may suggests the pair to be traded higher in short-term as technical correction before extending its bearish bias thereafter.
Resistance level: 1.3600, 1.3785
Support level: 1.3445, 1.3300
USDJPY
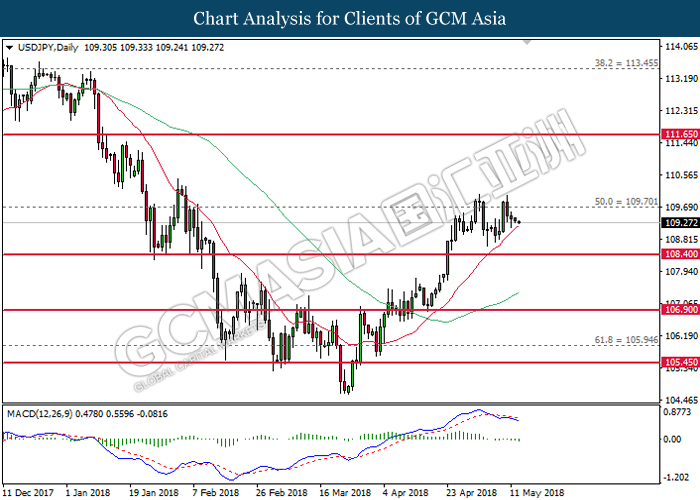
USDJPY, Daily: USDJPY was traded lower following prior retracement near the resistance level at 109.70. MACD histogram which has formed a death cross signal may suggests the pair to extend its losses in the event of a closure below the 20-MA line (red).
Resistance level: 109.70, 111.65
Support level: 108.40, 106.90
EURUSD
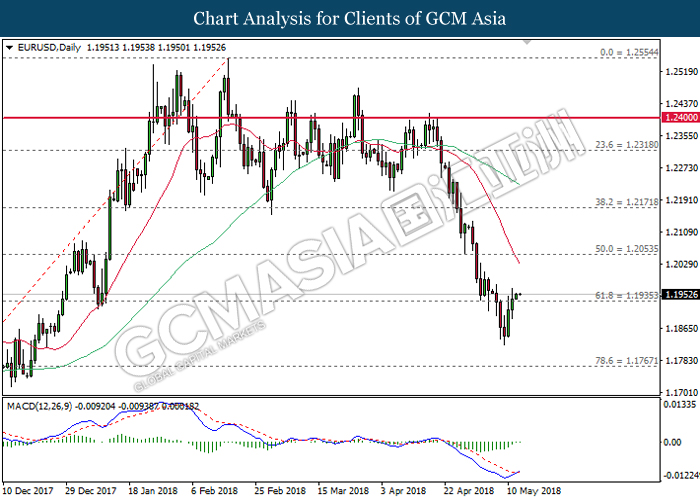
EURUSD, Daily: EURUSD pared its prior losses following a rebound and closure above the resistance level at 1.1935. MACD histogram which has formed a golden cross signal may suggest the pair to extend its gains in short-term, towards the 20-MA line (red).
Resistance level: 1.2055, 1.2170
Support level: 1.1935, 1.1770
GOLD
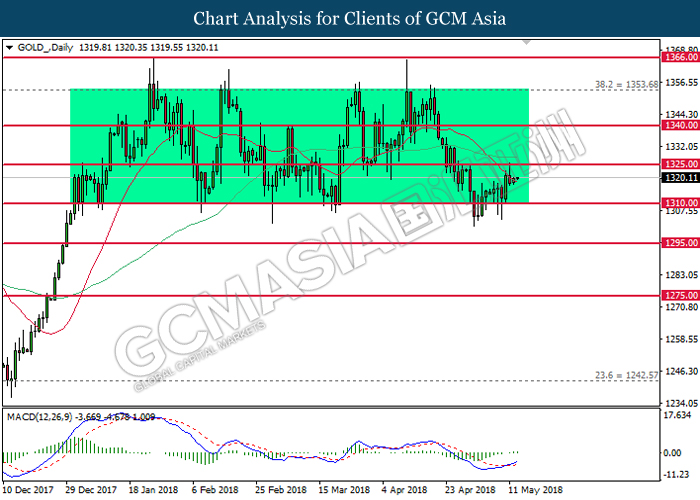
GOLD_, Daily: Gold price was traded higher following prior rebound and closure above the 20-MA line (red). MACD histogram which illustrate substantial upward signal may suggest the commodity price to extend its gains in short-term, towards the direction of resistance level near 1325.00.
Resistance level: 1325.00, 1340.00
Support level: 1310.00, 1295.00
Crude Oil
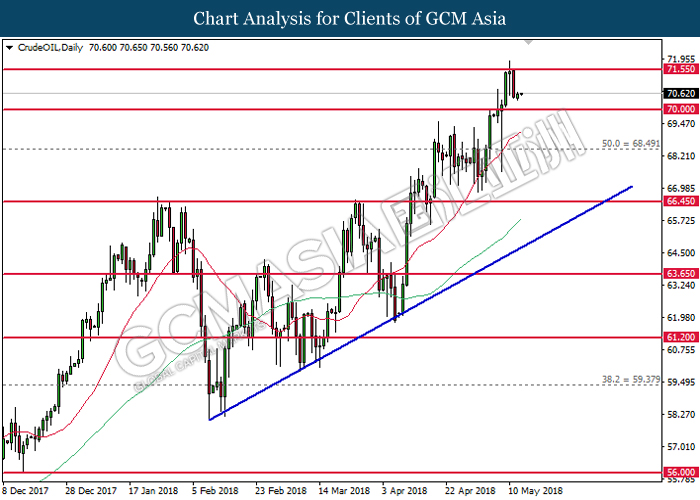
CrudeOIL, Daily: Crude oil price was traded higher following prior rebound before the support level of 70.00. Both MA lines which continues to expand upwards suggests further bullish bias. Thus, overall major trend still suggests the commodity price to extend its gains towards the direction of resistance level near 71.55.
Resistance level: 70.00, 71.55
Support level: 66.45, 63.65
080518 Daily Analysis
08 May 2018 Daily Analysis
Dollar remains supported over Euro weakness and Bostic’s speech.
Dollar index was traded higher against a trade-weighted basket of major currencies by 0.16% to 92.50 as of writing following weakness in the Euro and hawkish statement by the Fed President Raphael Bostic. Overnight, Bostic reiterated his support for two further rate hikes this year after stating his comfort with “some overshoot” of inflation in U.S, thus leading to an increase in market optimism towards the Federal Reserve to increase its interest rates at a more aggressive pace this year. On the contrary, Greenback received extended bullish momentum following a softer German factory orders that gave an actual reading of -0.9% versus the expected reading for 0.5% increase. The weaker-than-expected data has trimmed traders’ bets on the European Central Bank to unwind their monetary policy stimulus within a short timeframe, leading to EUR/USD to fall 0.29% to $1.1930.
In the commodities market, crude oil price fell 0.9% to $70.00 per barrel while investors sell off their position on the commodity amid Trump’s announcement on his decision whether sanctions on Iran will be reimposed. Likewise, gold price fell 0.05% to $1313.00 a troy ounce after it is being weighed on by increased market prospect towards further rate hike by Fed this year.
Today’s Holiday Market Close
Time Market Event
N/A
Today’s Highlight Events
Time Market Event
15:15 USD Fed Chair Powell Speaks
Today’s Highlight Economy Data
| Time | Nation & Data | Previous | Forecast | Actual |
| 09:30 | AUD – Retail Sales (MoM) (Mar) | 0.6% | 0.2% | 0.2% |
| Tentative | CNY – Trade Balance (USD) (Apr) | -4.98B | 27.50B | – |
| 14:00 | EUR – German Industrial Production (MoM) (Mar) | -1.6% | 0.8% | – |
| 14:00 | EUR – German Trade Balance (Mar) | 19.2B | 19.9B | – |
| 15:30 | GBP – Halifax House Price Index (YoY) (Apr) | 2.7% | 3.3% | – |
| 22:00 | USD – JOLTs Job Openings (Mar) | 6.052M | 6.020M | – |
| 04:30 | CrudeOIL – API Weekly Crude Oil Stock | 3.427M | – | – |
GBPUSD
GBPUSD, H4: GBPUSD was traded lower after breaking support level at 1.3600. However, MACD that shows increasing bullish momentum would suggest the pair to trade higher towards the resistance level at 1.3600.
Resistance level: 1.3600, 1.3780
Support level: 1.3440, 1.3270
EURUSD
EURUSD, H4: EURUSD was traded lower after breaking support level at 1.1940. However, positive divergence as displayed by MACD signal line would suggest the pair to extend its gains if breakout at the previous low is successful.
Resistance level: 1.1940, 1.2010
Support level: 1.1870, 1.1770
USDJPY
USDJPY, H4: USDJPY was traded lower after breaking support level at 109.20. MACD signal line that shows a death-cross would suggest the pair to extend its losses if candlestick successfully closes below the support level at 109.00
Resistance level: 109.00, 109.20
Support level: 108.60, 108.00
CrudeOIL
CrudeOIL, H4: Crude oil price was traded lower prior retracement from resistance level at 70.90. MACD that displays a death-cross would suggest the commodity price to undergo short-term losses before continuing its bullish bias.
Resistance level: 70.90, 73.70
Supprort level: 69.80, 68.70
GOLD
GOLD_, H1: Gold price was traded lower prior retracement from resistance level at 1316.40. A lack of significant indication from both MACD and candlestick pattern would suggest to wait for confirmation breakout to grasp the next movement of the safe-haven asset price in short-term.
Resistance level: 1316.40, 1323.20
Support level: 1310.50, 1304.60
070518 Weekly Analysis
7 May 2018 Weekly Analysis
GCMAsia Weekly Report: May 7 – 11
Market Review (Forex): April 30 – May 4
Greenback hovers near its highest level for the year 2018 as market participants mulled mixed signals from the highly anticipated US jobs market report. The dollar index rose 0.17% while closing off the week at around 92.57 against a basket of six major currencies.
According to the Bureau of Labor Statistics, US economy has generated lesser-than-expected jobs in the month of April, coming in at only 164,000 versus 189,000 seen. US jobs report has been underperformed since the recent two releases after attaining a reading as high as 313,000 jobs generated for the month of January.
However, what remains as a puzzle to investors is the lower-than-expected wage growth which came in at a minute reading of 0.1% versus economist forecast of 0.2%. Evidently, despite the recent ticked down in unemployment rate by 0.1% to 3.9%, it has failed to spur competitiveness in wages over the backdrop of robust and active hiring. The tepid wage growth may hinder inflationary progression and substantially reduce the chances for a more aggressive rate hike stance from the US Federal Reserve.
Likewise, overall gains on the US dollar remained capped as market participants digests the latest development in US-China trade talks. Overall, uncertainty continues to surround the high-level talks after China’s Vice Premier Liu He and US Treasury Secretary Steven Mnuchin met in Beijing since last Thursday. According to China’s statement, indifferences continues to linger although both parties has reached agreement in some aspects.
The risk for a trade war outburst continues to arise as they approach the US 60-day window for public comment on the proposed tariffs to be enacted upon Chinese imports. China warned that they may retaliate once US tariffs enter effect, substantial escalating trade tensions to the next level while jeopardizing global trade patterns.
US Nonfarm Payrolls
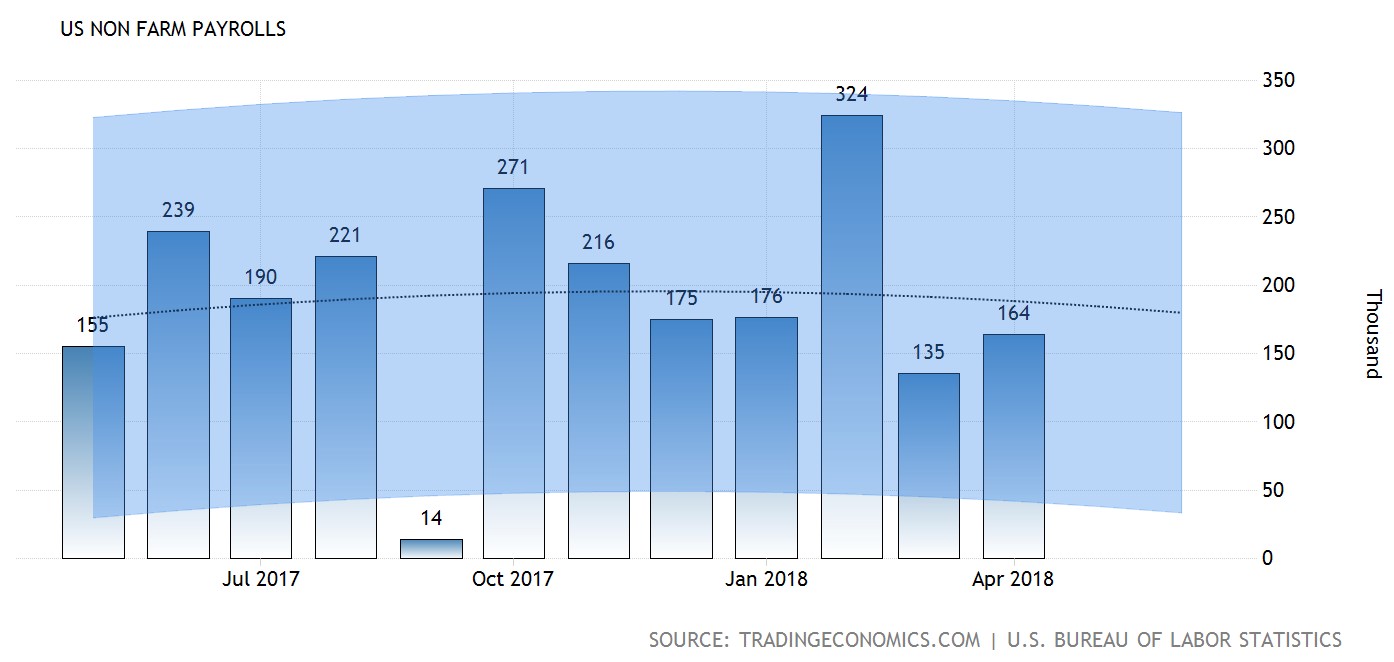
—– Forecast
US Nonfarm Payrolls came in at only 164,000 jobs for the month of April.
US Average Hourly Earnings
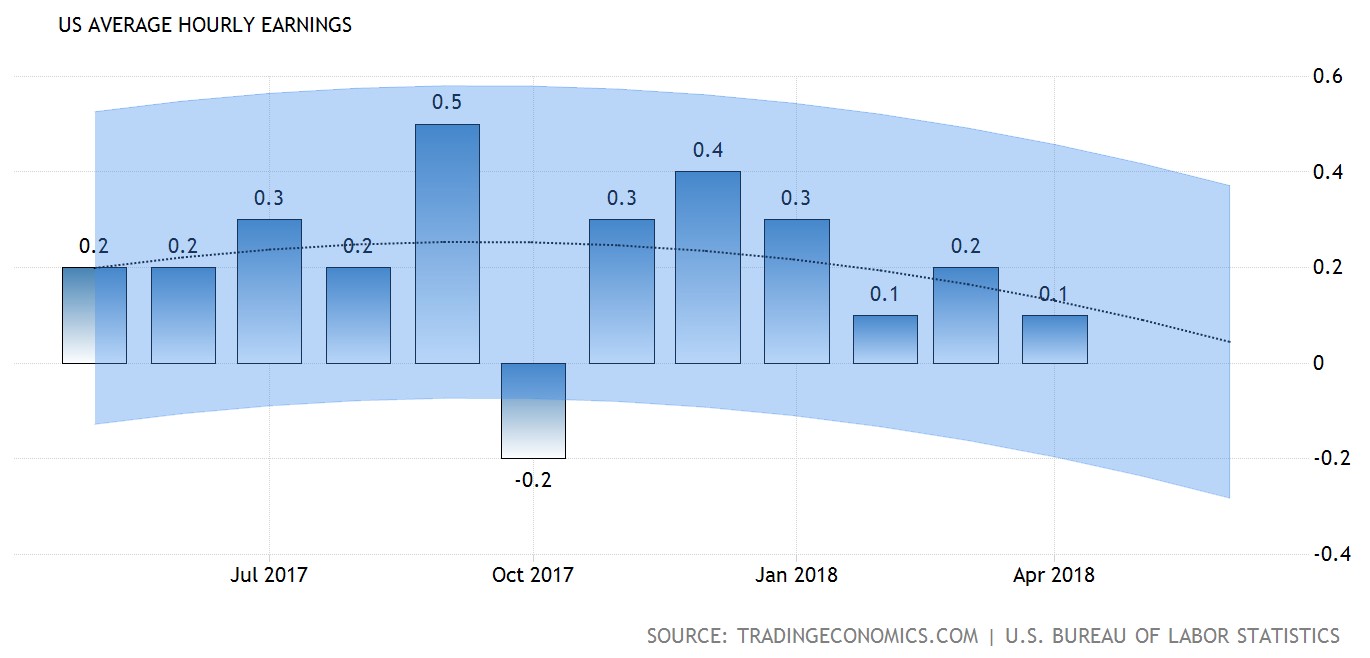
—– Forecast
US Average Hourly Earnings misses economist forecast with only 0.1% versus 0.2% for the month of April.
US Unemployment Rate
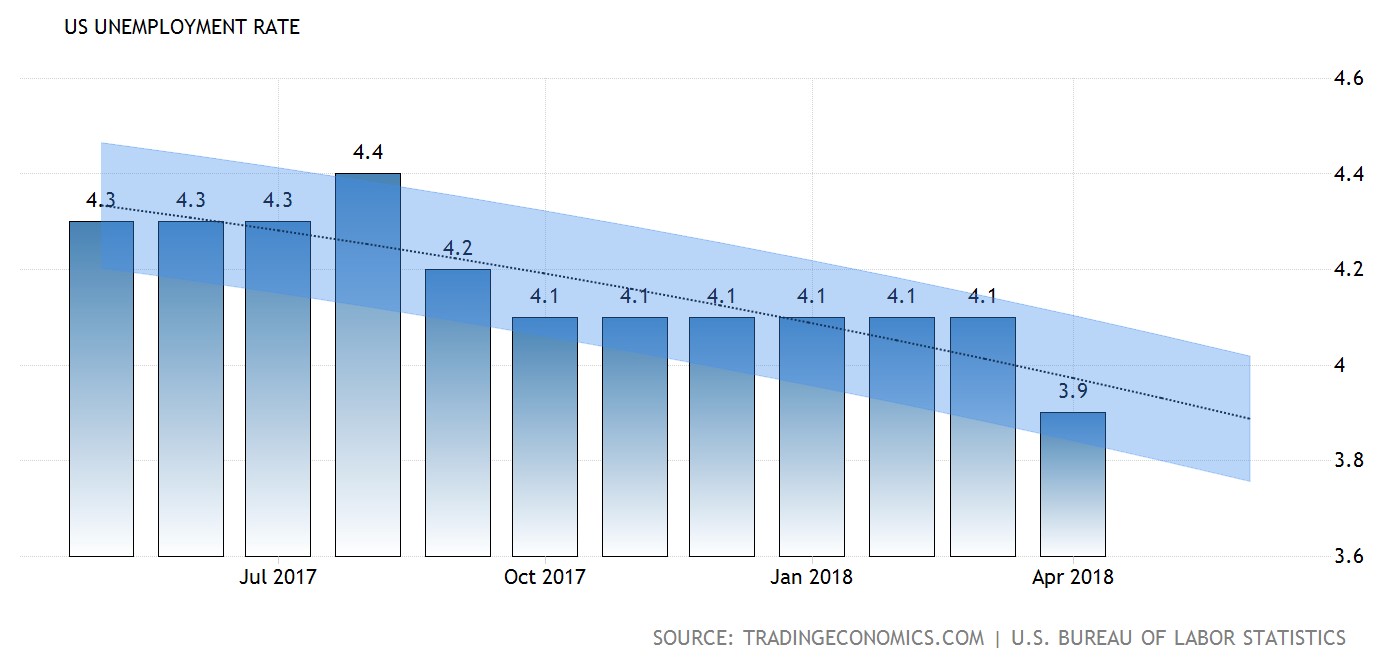
—– Forecast
US Unemployment rate extended its downward trending, last seen at 3.9% for the month of April.
USD/JPY
Pair of USD/JPY ticked down 0.06% while ending the week at 109.12.
EUR/USD
Pair of EUR/USD extended losses by 0.23% to $1.1961 during late Friday trading. The single common currency remained under pressure following recent weaker-than-expected economic data which has dialed down market’s prospect for European Central Bank to taper their QE anytime soon.
GBP/USD
Pound sterling recorded a loss of 0.33% to $1.3531 against the greenback last Friday. Sterling remains on the back foot for the whole week following a string of weak economic data and political issues within the UK which has spook off market bulls.
Market Review (Commodities): April 30 – May 4
GOLD
Gold price tacked higher during late Friday trading as market participants gear up for higher uncertainty ahead due to lingering geopolitical and trade tensions within the market. Price of the safe-haven asset was up by 0.22% or $2.86, ending the week around $1,315.12 a troy ounce.
Although the yellow metal has averted some of its weekly losses, overall bullish momentum remained capped as prospects for yet another rate hike in the United States remained intact, supporting the recent rally of US dollar. Gold is highly sensitive to interest rates movements in the United States as rising interest may lift the opportunity cost for holding non-yielding assets.
Crude Oil
Crude oil price is a shy away from the psychological threshold of $70 per barrel as market participants increased their bets on the United States to pull out from Iran’s nuclear deal next week. Price of the black commodity rose 1.88% while closing the week at $69.78 per barrel.
Ahead of US President Donald Trump’s decision to stay or withdraw from the Iran nuclear deal, traders appeared to have bet and priced in Trump’s decision for the latter that may reimpose fresh sanctions on the oil producing country. Sanctions may limit their ability to export crude oils and may significantly reduce the bearish pressure over global oversupply glut and oil prices.
However, gains on the oil prices were limited by the rising crude production in the United States. According to oilfield service firm, Baker Hughes reported that the number of active drilling rig rose by 9 to a total of 834. The relentless pace of US oil expansion has achieved its new record high of 10.6 million barrels per day, not far from the world’s biggest oil exporter – Russia which currently hovers around 11 million barrels per day.
Weekly Outlook: May 7 – 11
For the week ahead, investors will be anticipating the results from Bank of England’s policy meeting on Thursdays for further clues with regards to their stance towards interest rate hike. Otherwise, market participants will closely monitor the developments of US-China trade talks to gauge the overall trade war risk and tension that may escalate to a higher market momentum.
As for oil traders, they will be eyeing on US inventories level reported by API and EIA to gauge the strength of crude demand for world’s largest oil consumer.
Highlighted economy data and events for the week: May 7 – 11
| Monday, May 7 |
Data EUR – German Factory Orders (MoM) (Mar) CHF – CPI (MoM) (Apr)
Events USD – FOMC Member Bostic Speaks
|
| Tuesday, May 8 |
Data AUD – Retail Sales (MoM) (Mar) CNY – Trade Balance (USD) (Apr) EUR – German Industrial Production (MoM) (Mar) EUR – German Trade Balance (Mar) GBP – Halifax House Price Index (YoY) (Apr) USD – JOLTs Job Openings (Mar)
Events USD – FOMC Member Kaplan Speaks USD – Fed Chair Powell Speaks
|
| Wednesday, May 9 |
Data CrudeOIL – API Weekly Crude Oil Stock GBP – BRC Retail Sales Monitor (YoY) (Apr) AUD – Westpac Consumer Sentiment (May) USD – PPI (MoM) (Mar) CAD – Building Permits (MoM) (Mar) CrudeOIL – Crude Oil Inventories CrudeOIL – Gasoline Inventories
Events N/A
|
| Thursday, May 10 |
Data NZD – RBNZ Interest Rate Decision CNY – CPI (YoY) (Apr) CNY – PPI (YoY) (Apr) GBP – Manufacturing Production (MoM) (Mar) GBP – Trade Balance (Mar) GBP – BoE Interest Rate Decision (May) USD – Core CPI (MoM) (Apr) USD – Initial Jobless Claims CAD – New Housing Price Index (MoM) (Mar)
Events NZD – RBNZ Rate Statement NZD – RBNZ Press Conference NZD – RBNZ Gov Orr Speaks GBP – BoE Inflation Report
|
|
Friday, May 11
|
Data USD – Import Price Index (MoM) (Apr) CAD – Employment Change (Apr) CAD – Unemployment Rate (Apr) USD – Michigan Consumer Sentiment (May) CrudeOIL – US Baker Hughes Oil Rig Count
Events USD – FOMC Member Bullard Speaks EUR – ECB President Draghi Speaks
|
Technical Weekly Outlook: May 7 – 11
Dollar Index
DOLLAR_INDX, Daily: Dollar index was traded lower following prior retracement from the resistance level near 92.50. MACD histogram which illustrate some diminishing upward momentum may suggests the index to be traded lower in short-term as technical correction before extending its bullish bias.
Resistance level: 92.50, 93.60
Support level: 91.70, 90.95
GBPUSD
GBPUSD, Daily: GBPUSD extended losses following prior breakout near the support level of 1.3600. MACD histogram which illustrate some diminished downward momentum may suggest the pair to be traded higher in short-term as technical correction before advancing further down in conjunction with current bearish major trend.
Resistance level: 1.3600, 1.3785
Support level: 1.3445, 1.3300
USDJPY
USDJPY, Daily: USDJPY was traded lower following prior retrace from the threshold of 109.70. MACD histogram which begins to form a death cross signal suggests the pair to extend its losses in short-term, towards the direction of 20-MA line (red) near 108.40.
Resistance level: 109.70, 111.65
Support level: 108.40, 106.90
EURUSD
EURUSD, Daily: EURUSD was traded higher following prior rebound while currently testing near the strong support level of 1.1935. MACD histogram which illustrate diminishing downward momentum may suggests the pair to be traded higher in short-term as technical correction. Otherwise, long-term trend direction is skewed towards bearish.
Resistance level: 1.2055, 1.2170
Support level: 1.1935, 1.1770
GOLD
GOLD_, Daily: Gold price re-enters into the sideways channel following prior rebound and closure above the support level at 1310.00. MACD histogram which illustrate diminishing downward momentum may suggest the commodity price to extend its gains after closing above the 20-MA line (red) near 1325.00.
Resistance level: 1325.00, 1340.00
Support level: 1310.00, 1295.00
Crude Oil
CrudeOIL, Daily: Crude oil price was traded higher following a bullish close above the resistance level at 68.50. MACD histogram which forms a golden cross signal suggests further bullish bias. However, a break above the threshold of 70.00 is required to attain further confirmation.
Resistance level: 70.00, 74.15
Support level: 66.45, 63.65
040518 Daily Analysis
04 May 2018 Daily Analysis
Greenback on key support level ahead of NFP.
Dollar was traded lower against its major peers by 0.16% to 92.20 as of writing following mostly pessimistic economic data in the region while market participants sold off their Greenback position ahead of the release of Nonfarm Payrolls (NFP) report. Overnight, initial jobless claims was reported by the U.S. Department of Labor to achieve an actual reading of 211K, much better than the economists’ forecast for an increase of 225K. However, gains of the Greenback was pared after unit labor costs for the first quarter and ISM Non-Manufacturing PMI missed the expected reading of 3.1% and 60.0, last stood at 2.7% and 59.1 respectively. Although the Federal Reserve has expressed their confidence towards the labor market in U.S., market participants will shift their focus to NFP report tonight to garner further indication on the economic growth in the region. On the other hand, GBP/USD pared gains by 0.15% to $1.3579 following the release of services PMI that missed the expected reading of 53.5, last stood at 52.8.
In the commodities market, crude oil price was settled higher by 0.74% to $68.39 per barrel following increased prospect of US sanctions on Iran after the latter stated that it would not renegotiate the Iran nuclear deal. Likewise, gold price rose 0.65% to $1312.70 a troy ounce attributed to renewed geopolitical uncertainty between the U.S. and Iran.
Today’s Holiday Market Close
Time Market Event
N/A
Today’s Highlight Events
Time Market Event
00:00 (Sat) USD FOMC Member Dudley Speaks
03:00 (Sat) USD FOMC Member Williams Speaks
Today’s Highlight Economy Data
| Time | Nation & Data | Previous | Forecast | Actual |
| 09:45 | CNY – Caixin Services PMI (Apr) | 52.3 | 52.4 | 52.9 |
| 15:55 | EUR – German Services PMI (Apr) | 54.1 | 54.1 | – |
| 16:00 | EUR – Markit Composite PMI (Apr) | 55.2 | 55.2 | – |
| 16:00 | EUR – Services PMI (Apr) | 55.0 | 55.0 | – |
| 17:00 | EUR – Retail Sales (MoM) (Mar) | 0.1% | 0.5% | – |
| 20:30 | USD – Average Hourly Earnings (MoM) (Apr) | 0.3% | 0.2% | – |
| 20:30 | USD – Nonfarm Payrolls (Apr) | 103K | 185K | – |
| 20:30 | USD – Unemployment Rate (Apr) | 4.1% | 4.0% | – |
| 22:00 | CAD – Ivey PMI (Apr) | 59.8 | 60.2 | – |
| 01:00 | CrudeOIL – US Baker Hughes Oil Rig Count | 825 | – | – |
GBPUSD
GBPUSD, H4: GBPUSD was traded higher prior rebound from support level at 1.3550. MACD that portrays a golden-cross would suggest the pair to undergo short-term technical correction to trade higher towards the resistance level at 1.3610.
Resistance level: 1.3610, 1.3670
Support level: 1.3550, 1.3490
EURUSD
EURUSD, H4: EURUSD was traded higher prior rebound from support level at 1.1940. MACD that portrays a golden-cross would suggest the pair to extend its gains if candlestick successfully closes above the trend line of descending channel.
Resistance level: 1.2010, 1.2050
Support level: 1.1940, 1.1870
USDJPY
USDJPY, H4: USDJPY was traded lower prior breaking support level at 109.20 and the pair is currently retesting its previous low. MACD that portrays ongoing downward momentum would suggest the pair to extend its losses if candlestick closes below the 50.0 Fibonacci level.
Resistance level: 109.20, 109.40
Support level: 108.50, 108.00
CrudeOIL
CrudeOIL, H1: Crude oil price was traded lower prior retracement from descending trend line. MACD that shows downward signal would indicate the commodity price to extend its losses if breakout at support level 68.30 is successful.
Resistance level: 68.70, 69.20
Support level: 68.30, 68.00
GOLD
GOLD_, H4: Gold price was traded lower following its failure to break resistance level at 1315.70. MACD that shows ongoing bullish momentum would suggest the safe-haven asset price to extend its gains to retest the said resistance level.
Resistance level: 1315.70, 1321.30
Support level: 1307.40, 1303.60
030518 Daily Analysis
03 May 2018 Daily Analysis
Greenback fails to extend its gains following careful FOMC statement.
Dollar index was traded higher against a basket of major currencies post-FOMC yet the bullish momentum was short-lived following a lack of hawkish tone by the Federal Reserve. The Greenback pared its gains by 0.19% to 92.34 during the Asian trading hours. Overnight, the Federal Reserve left its interest rates unchanged at 1.75% to 2% as widely anticipated by market participants. However, they also signaled that inflation was close to its 2% target over the medium term which has further cemented investors’ expectation for further rate hike at its next meeting in June. All in all, the Greenback has failed to extend its bullish momentum following statements by the policymakers that a rise in inflation above the target should not necessarily lead to aggressive monetary policy tightening. On the contrary, GBP/USD fell 0.05% to $1.3588 despite the release of optimistic UK construction data following dampening investors’ expectation towards the Bank of England (BoE) to increase its interest rates later this month.
In the commodities market, crude oil price rose 1.01% to $67.81 per barrel despite rising U.S. crude inventories by 6.218 million barrels versus the forecast reading for an increase of 0.739 million barrels. The rise in the commodity price was due to market participants that expressed greater optimism towards the OPEC and Non-OPEC to extend their crude supply cut. Likewise, gold price rose 0.54% to $1309.66 a troy ounce following recent recession of the Greenback.
Today’s Holiday Market Close
Time Market Event
N/A
Today’s Highlight Events
Time Market Event
N/A
Today’s Highlight Economy Data
| Time | Nation & Data | Previous | Forecast | Actual |
| 09:30 | AUD – Building Approvals (MoM) (Mar) | -6.2% | 1.0% | 2.6% |
| 09:30 | AUD – Trade Balance (Mar) | 1.349B | 0.650B | 1.527B |
| 16:30 | GBP – Services PMI (Apr) | 51.7 | 53.3 | – |
| 17:00 | EUR – CPI (YoY) (Apr) | 1.3% | 1.3% | – |
| 20:30 | USD – Initial Jobless Claims | 209K | 216K | – |
| 20:30 | USD – Trade Balance (Mar) | -57.60B | -55.60B | – |
| 20:30 | USD – Unit Labor Costs (QoQ) (Q1) | 2.5% | 3.1% | – |
| 22:00 | USD – ISM Non-Manufacturing Employment (Apr) | 56.6 | – | – |
| 22:00 | USD – ISM Non-Manufacturing PMI (Apr) | 58.8 | 58.1 | – |
GBPUSD
GBPUSD, H1: GBPUSD was traded higher prior rebound from support level at 1.3550. MACD that displays a golden-cross would suggest the pair to extend its gains towards the resistance level at 1.3610.
Resistance level: 1.3610, 1.3670
Support level: 1.3550, 1.3490
EURUSD
EURUSD, H1: EURUSD was traded higher prior rebound from support level at 1.1940. MACD that displays a golden-cross would suggest the pair to extend its gains towards the resistance level at 1.2010.
Resistance level: 1.2010, 1.2050
Support level: 1.1940, 1.1870
USDJPY
USDJPY, H4: USDJPY was traded lower prior retracement from resistance level at 109.90. MACD that shows a death-cross would suggest the pair to extend its losses towards the support level at 109.40.
Resistance level: 109.90, 110.20
Support level: 109.40, 109.10
CrudeOIL
CrudeOIL, H1: Crude oil price was traded higher prior rebound from support level at 67.50. MACD that portrays increasing bullish momentum would suggest the commodity price to extend its gains towards the resistance level at 68.00.
Resistance level: 68.00, 68.40
Support level: 67.50, 67.00
GOLD
GOLD_, H1: Gold price was traded higher prior breaking resistance level at 1307.40. MACD that portrays a golden-cross would suggest the safe-haven asset price to extend its gains towards the resistance level at 1315.70.
Resistance level: 1315.70, 1321.30
Support level: 1307.40, 1303.60
020518 Daily Analysis
02 May 2018 Daily Analysis
Dollar hits 2018 highs ahead FOMC meeting minutes.
Dollar index was traded higher against a trade-weighted basket of major currencies by 0.67% to 92.22 as of writing following weakness of its peers. Overnight, investors shrugged off the weaker ISM manufacturing index in U.S. that fell to a reading of 57.3 in April which has missed the economists’ forecast for a reading of 58.6 following optimistic sentiment towards tax reform which correlates to accelerated depreciation of machinery and equipment that could boast factory activity this year. In addition, Greenback was able to stand on its ground following a slump in Pound Sterling attributed to a fall of UK manufacturing activity in April to its 17-month lows, last recorded at $1.3615. Meanwhile, investors will be eyed-on FOMC meeting minutes due 2a.m. (GMT +8) on this Thursday to grasp further indication on its monetary policy.
In the commodities market, crude oil price pared its gains by 0.3% to $67.35 per barrel following concerns over United States that may re-impose sanctions on the major oil exporter Iran. Likewise, gold price recovered its losses by 0.33% yet remained at its low level around $1307.40 a troy ounce while market participants await further signals from FOMC meeting.
Today’s Holiday Market Close
Time Market Event
N/A
Today’s Highlight Events
Time Market Event
02:00 (Thu) USD FOMC Statement
Today’s Highlight Economy Data
| Time | Nation & Data | Previous | Forecast | Actual |
| 06:45 | NZD – Employment Change (QoQ) (Q1) | 0.5% | 0.4% | 0.6% |
| 06:45 | NZD – Unemployment Rate (Q1) | 4.5% | 4.5% | 4.4% |
| 09:45 | CNY – Caixin Manufacturing PMI (Apr) | 51.0 | 50.9 | 51.1 |
| 15:55 | EUR – German Manufacturing PMI (Apr) | 58.1 | 58.1 | – |
| 16:30 | GBP – Construction PMI (Apr) | 47.0 | 50.9 | – |
| 17:00 | EUR – GDP (QoQ) | 2.7% | 2.5% | – |
| 20:15 | USD – ADP Nonfarm Employment Change (Apr) | 241K | 194K | – |
| 22:30 | CrudeOIL – Crude Oil Inventories | 2.170M | – | – |
| 22:30 | CrudeOIL – Gasoline Inventories | 0.840M | -0.625M | – |
| 02:00 | USD – Fed Interest Rate Decision | 1.75% | 1.75% | – |
GBPUSD

GBPUSD, H1: GBPUSD was traded lower prior breaking support level at 1.3610. However, MACD that displays a golden-cross would suggest the pair to trade higher if breakout at the previous low is successful.
Resistance level: 1.3610, 1.3790
Support level: 1.3450, 1.3300
EURUSD

EURUSD, H1: EURUSD was traded lower after breaking support level at 1.2050. MACD that displays a golden-cross would suggest the pair to undergo short-term technical correction to trade higher before continuing its bearish bias.
Resistance level: 1.2050, 1.2100
Support level: 1.1940, 1.1870
USDJPY

USDJPY, H1: USDJPY was traded lower prior retracement from the ascending trend line. MACD that displays a death-cross would suggest the pair to trade lower towards the support level at 109.70.
Resistance level: 110.20, 110.90
Support level: 109.70, 109.40
CrudeOIL

CrudeOIL, H1: Crude oil price was traded higher after rebound from support level at 67.00. MACD that shows a golden-cross would suggest the commodity price to extend higher towards the resistance level at 67.50.
Resistance level: 67.50, 68.30
Support level: 67.00, 66.10
GOLD

GOLD_, H1: Gold price was traded lower after breaking support level at 1307.40 and the safe-haven asset price is currently retesting the previous low level. MACD that displays a golden-cross would suggest the commodity price to trade higher if breakout is successful.
Resistance level: 1307.40, 1315.70
Support level: 1297.70, 1288.20
300418 Weekly Analysis
30 April 2018 Weekly Analysis
GCMAsia Weekly Report: April 30 – May 4
Market Review (Forex): April 23 – 27
US dollar retraced slightly during late Friday trading hours albeit remained support due to better-than-expected economic data from the region. The dollar index dipped 0.03% while closing the week round 91.53 against a basket of six major currencies.
Although some investors began to cash in their profits, the downside on the currency remains limited as dollar-bull continues to lend their support on the currency. The US 10-year Treasury yield which has pushed above 3% for the first-time last week is a sign of increasing market confidence towards the outlook of US economy in the future.
From the economic front, US Gross Domestic Product came in higher-than-expected with 2.3% for the first quarter of 2018. Although the reading has marked a slowdown from prior quarter of 2.9%, it has attained the best start for the year since 2015 while exceeding economist forecast for an even slower expansion with only 2.0%.
As of now, investors will be paying close attention on US monetary policy meeting due next week although Federal Reserve is unlikely to raise interest rates at the conclusion of two-day meeting. Thus, the central bank statement will be closely scrutinized amid speculation for a more frequent rate hike due to optimistic economic performance from the region.
US GDP Growth Rate

—– Forecast
US GDP Growth rate came in with 2.3% for the first quarter of 2018.
USD/JPY
Pair of USD/JPY tumbled 0.23% to 109.04 during late Friday trading after hitting its highest level since February 8th at 109.54 earlier.
EUR/USD
Euro pushed higher against the greenback, up 0.22% to $1.2131 albeit ending the week with a loss of 1.28%.
GBP/USD
Pair of GBP/USD ended the week at two-months low after falling 0.98% to $1.3779.
Market Review (Commodities): April 23 – 27
GOLD
Gold price clawed higher during late Friday trading hours while gains remained limited due to higher prospect for a more frequent rate hike from the US Federal Reserve. Price of the yellow metal rose $6.50 or 0.49% to $1,324.40 a troy ounce. However, it has recorded a second consecutive weekly loss with 0.92% for last week.
Generally, a higher prospect for an interest rate hike in the region could catalyze higher bullish bets on the greenback which in return, making the safe-haven commodity more expensive for investors from other countries. Likewise, a higher treasury yield tends to make gold less attractive for yield-seeking investors as it does not pay any interest.
Crude Oil
Crude oil price settles lower last Friday as US rig counts jumps for the third consecutive week, spurring higher concerns among investors upon the ongoing global supply glut. Price of the commodity dipped 0.28% or $0.19 to $67.98 per barrel.
According to US oilfield services provider, Baker Hughes reported that the number of active oil rigs operating in the US rose by 5 to a total of 825, a third straight weekly increase. On top of that, EIA reported last Wednesday that the US oil production rose to a new record high of 10.59 million barrels per day. Both report point towards a rising trend of output from the United States which could worsen the current supply glut overhang which has linger for more than 3 years.
However, the downside momentum in oil prices were limited due to renewed investors expectation towards the United States in pulling out of the Iranian nuclear deal. In the event of a cancelation from the Trump administration, secondary sanctions will be re-imposed upon the country and it could limit global purchases of Iranian crude and in return, denting global supplies.
Weekly Outlook: April 30 – May 4
For the week ahead, investors will be paying close attention on US Federal Reserve two-day monetary policy meeting and highly anticipated jobs report to attain further signals with regards to the US economy outlook and rate hike prospects.
As for oil traders, they will be eyeing on US inventories level reported by API and EIA to gauge the strength of crude demand for world’s largest oil consumer.
Highlighted economy data and events for the week: April 30 – May 4
| Monday, April 30 |
Data CNY – Manufacturing PMI (Apr) CNY – Non-Manufacturing PMI (Apr) EUR – German Retail Sales (MoM) (Mar) EUR – German CPI (MoM) (Apr) USD – Core PCE Price Index (YoY) (Mar) USD – Core PCE Price Index (MoM) (Mar) USD – Personal Income (MoM) (Mar) USD – Personal Spending (MoM) (Mar) CAD – RMPI (MoM) (Mar) USD – Pending Home Sales (MoM) (Mar)
Events N/A
|
| Tuesday, May 1 |
Data AUD – RBA Interest Rate Decision (May) GBP – Manufacturing PMI (Apr) CAD – GDP (MoM) (Feb) USD – Manufacturing PMI (Apr_ USD – ISM Manufacturing Employment (Apr) USD – ISM Manufacturing PMI (Apr)
Events AUD – RBA Rate Statement
|
| Wednesday, May 2 |
Data CrudeOIL – API Weekly Crude Oil Stock NZD – Employment Change (QoQ) (Q1) NZD – Unemployment Rate (Q1) CNY – Caixin Manufacturing PMI (Apr) EUR – German Manufacturing PMI (Apr) GBP – Construction PMI (Apr) EUR – GDP (QoQ) USD – ADP Nonfarm Employment Change (Apr) CrudeOIL – Crude Oil Inventories CrudeOIL – Gasoline Inventories
Events CAD – BoC Gov Poloz Speaks
|
| Thursday, May 3 |
Data USD – FOMC Interest Rate Decision AUD – Building Approvals (MoM) (Mar) AUD – Trade Balance (Mar) GBP – Services PMI (Apr) EUR – CPI (YoY) (Apr) USD – Initial Jobless Claims USD – Trade Balance (Mar) USD – Unit Labor Costs (QoQ) (Q1) USD – ISM Non-Manufacturing Employment (Apr) USD – ISM Non-Manufacturing PMI (Apr)
Events USD – FOMC Statement
|
|
Friday, May 4
|
Data CNY – Caixin Services PMI (Apr) EUR – German Services PMI (Apr) EUR – Markit Composite PMI (Apr) EUR – Services PMI (Apr) EUR – Retail Sales (MoM) (Mar) USD – Average Hourly Earnings (MoM) (Apr) USD – Nonfarm Payrolls (Apr) USD – Unemployment Rate (Apr) CAD – Ivey PMI (Apr) CrudeOIL – US Baker Hughes Oil Rig Count
Events USD – FOMC Member Dudley Speaks USD – FOMC Member Williams Speaks
|
Technical Weekly Outlook: April 30 – May 4
Dollar Index

DOLLAR_INDX, Daily: Dollar index was traded lower following prior retracement from the resistance level at 91.70. MACD histogram which illustrate substantially diminished upward momentum suggests the index to be traded lower in short-term as technical correction before extending its bullish bias thereafter.
Resistance level: 91.70, 92.50
Support level: 90.90, 90.65
GBPUSD

GBPUSD, Daily: GBPUSD extended its losses following prior breakout from the support level at 1.3785. MACD histogram which illustrate substantial downward signal suggests the pair to extend its losses, towards the direction of 1.3600.
Resistance level: 1.3785, 1.4000
Support level: 1.3600, 1.3445
USDJPY

USDJPY, Daily: USDJPY was traded lower following prior retracement from the resistance level near 109.70. MACD histogram which illustrate diminished upward momentum suggests the pair to be traded lower in short-term as technical correction.
Resistance level: 109.70, 111.65
Support level: 108.40, 106.90
EURUSD

EURUSD, Daily: EURUSD was traded higher following prior rebound from the support level near 1.2055. Recent pin bar formation while coupled with diminished downward signal from MACD histogram may suggest the pair to be traded higher in short-term, towards the direction of resistance level near 1.2170.
Resistance level: 1.2170, 1.2320
Support level: 1.2055, 1.1935
GOLD

GOLD_, Daily: Gold price remains traded within a sideways channel following prior rebound from the lower level. MACD histogram which illustrate diminishing downward momentum may suggests the pair to extend its gains after breaking the resistance level at 1325.00.
Resistance level: 1325.00, 1340.00
Support level: 1310.00, 1295.00
Crude Oil

CrudeOIL, Daily: Crude oil price remains under pressure following prior failure to push above the target at 69.10. MACD histogram which has formed a death cross signal may suggests the commodity price to extend its losses after closing below the 20-MA line (red).
Resistance level: 69.10, 71.50
Support level: 66.30, 63.75
270418 Daily Analysis
27 April 2018 Daily Analysis
Euro plunged over Draghi’s mixed statement.
Dollar index was traded relatively higher against a trade-weighted basket of major currencies above its 90.0 key level, last stood at 91.35 following a mixed press conference delivered by the European Central Bank (ECB) president Mario Draghi. Overnight, the Greenback slipped a little before ECB press conference following retracement of the U.S. 10-year treasury yield below 3% as a plunge in the 10-year treasury price over recent sessions attracted a wave of buying. Overall, losses endured by the Greenback was limited after the ECB decided to leave its interest rate unchanged as widely expected at 0.00% while reiterated its plan to continue buying bonds until at least the end of September or until inflation has reached to its 2% target in respective towards “solid and broad based” economic growth in the European zone. However, gains of the Euro was short-lived after President Draghi warned over rising global risks such as protectionism and there has been no plan discussed yet for its June meeting. His statement has disappointed market participants when they expected the officials to set a detailed roadmap for its future monetary policy plans. Following his comments, EUR/USD plunged 0.44% to $1.2100 seen.
In the commodities market, crude oil price was down 0.2% to $67.90 per barrel while market participants mulled over potential supply disruption in Iran. As such, investors will keep their eyes on the release of U.S. Baker Hughes Oil Rig Count to grasp the direction of the commodity price in short-term. Likewise, gold price plunged 0.37% to $1316.50 a troy ounce following the Dollar that remained firm on a higher level.
Today’s Holiday Market Close
Time Market Event
N/A
Today’s Highlight Events
Time Market Event
Tentative JPY BoJ Monetary Policy Statement
Tentative JPY BoJ Outlook Report (YoY)
Tentative JPY BoJ Press Conference
22:00 GBP BoE Govenor Carney Speaks
Today’s Highlight Economy Data
| Time | Nation & Data | Previous | Forecast | Actual |
| 06:45 | NZD – Trade Balance (MoM) (Mar) | 217M | 200M | -86M |
| 07:30 | JPY – Tokyo Core CPI (YoY) (Apr) | 0.8% | 0.8% | 0.6% |
| Tentative | JPY – BoJ Interest Rate Decision | -0.10% | -0.10% | – |
| 14:00 | GBP – Nationwide HPI (MoM) (Apr) | -0.2% | – | – |
| 15:55 | EUR – German Unemployment Change (Apr) | -19K | -15K | – |
| 16:30 | GBP – GDP (QoQ) (Q1) | 1.4% | 1.4% | – |
| 20:30 | USD – GDP (QoQ) (Q1) | 2.9% | 2.0% | – |
| 20:30 | USD – Employment Cost Index (QoQ) (Q1) | 0.6% | 0.7% | – |
| 20:30 | USD – GDP Price Index (QoQ) (Q1) | 2.3% | 2.2% | – |
| 22:00 | USD – Michigan Consumer Sentiment (Apr) | 97.8 | 98.0 | – |
| 01:00 | CrudeOIL – US Baker Hughes Oil Rig Count | 820 | – | – |
GBPUSD

GBPUSD, H4: GBPUSD was traded lower prior breaking support level at 1.3970 and the pair is currently testing the next support level at 1.3900. It is suggested to wait for confirmation breakout of candlestick before entering the next trade.
Resistance level: 1.3970, 1.4000
Support level: 1.3900, 1.3860
EURUSD

EURUSD, H4: EURUSD was traded lower prior breaking support level at 1.2160. MACD that portrays ongoing downside momentum would suggest the pair to extend its losses towards the support level at 1.2050.
Resistance level: 1.2160, 1.2240
Support level: 1.2050, 1.1940
USDJPY

USDJPY, H4: USDJPY was traded higher prior gaining its support at 109.20. However, death-cross as shown by MACD signal line would suggest the pair to trade lower if breakout at its previous high is successful.
Resistance level: 109.70, 110.20
Support level: 109.20, 108.50
CrudeOIL

CrudeOIL, H1: Crude oil price was traded lower prior breaking support level at 68.10. MACD that shows increasing downward momentum would suggest the commodity price to extend its losses towards the support at 200-MA line.
Resistance level: 68.10, 68.40
Support level: 67.70, 67.20
GOLD

GOLD_, H1: Gold price was traded lower after breaking support level at 1321.30. However, golden-cross as formed by MACD signal line would suggest the safe-haven asset price to undergo short-term technical correction to trade higher towards its previous low.
Resistance level: 1321.30, 1328.40
Support level: 1313.90, 1307.40
260418 Daily Analysis
26 April 2018 Daily Analysis
Dollar rises above 90.0 key level following steeper yield curve.
Dollar index was traded higher against a trade-weighted basket of major currencies by 0.45% to 90.95 as of writing following a rise in U.S. bond yields above 3%. Overnight, the Greenback poised higher after the 10-year US treasury yield edged higher towards its 4-year highs. According to one of the largest bank by market capitalization – Wells Fargo, a robust economic growth coupled with core inflation reaching its 2% target could serve as a catalyst for the Federal Reserve to increase its interest rates at a more aggressive pace. On the contrary, EUR/USD was down 0.39% to $1.2170 as market participants remain cautious towards the European Central Bank (ECB)’s monetary policy meeting due tonight to gauge signals from the officials on the economic outlook in the European zone.
In the commodities market, crude oil price rose 0.5% to $68.34 per barrel following worries over supply disruptions in Venezuela with its output reduced from 2.5 million bpd to around 1.5 million bpd attributed to political and economic turmoil in the South American country. Otherwise, gold price slumped 0.74% to $1322.85 a troy ounce following solid growth in the U.S. treasury yields which supported the dollar.
Today’s Holiday Market Close
Time Market Event
N/A
Today’s Highlight Events
Time Market Event
20:30 EUR ECB Press Conference
Today’s Highlight Economy Data
| Time | Nation & Data | Previous | Forecast | Actual |
| 14:00 | EUR – Gfk German Consumer Climate (May) | 10.9 | 10.9 | – |
| 16:30 | GBP – Gross Mortgage Approvals | 38.1K | 37.1K | – |
| 19:45 | EUR – ECB Marginal Lending Facility | 0.25% | 0.25% | – |
| 19:45 | EUR – ECB Interest Rate Decision (Apr) | 0.00% | 0.00% | – |
| 20:30 | USD – Core Durable Goods Orders (MoM) (Mar) | 1.0% | 0.5% | – |
| 20:30 | USD – Goods Trade Balance (Mar) | -75.88B | -74.80B | – |
| 20:30 | USD – Initial Jobless Claims | 232K | 235K | – |
GBPUSD

GBPUSD, H1: GBPUSD was traded higher prior rebound from support level at 1.3910. Golden-cross as displayed by MACD signal line would suggest the pair to extend its gains towards the resistance level at 1.3960.
Resistance level: 1.3960, 1.4020
Support level: 1.3910, 1.3860
EURUSD

EURUSD, H1: EURUSD was traded higher prior gaining its support at 38.2 Fibonacci level. Golden-cross as shown by MACD signal line would suggest the pair to undergo short-term technical correction to trade higher before continuing its bearish bias.
Resistance level: 1.2240, 1.2290
Support level: 1.2160, 1.2050
USDJPY

USDJPY, D1: USDJPY was traded higher after breaking resistance level at 109.20. MACD that shows increasing bullish momentum would suggest the pair to extend its gains towards the next resistance level at 109.70.
Resistance level: 109.70, 110.20
Support level: 109.20, 108.50
CrudeOIL

CrudeOIL, H1: Crude oil price was traded higher after breaking resistance level at 67.70. MACD that shows increasing bullish momentum would suggest the commodity price to continue its gains if breakout at the next resistance level 68.40 is successful.
Resistance level: 68.40, 69.00
Support level: 67.70, 67.20
GOLD

GOLD_, H1: Gold price was traded lower prior retracement from resistance level at 1329.70. MACD that shows diminishing bullish momentum would suggest the safe-haven asset price to extend its losses if breakout at the support level 1321.30 is successful.
Resistance level: 1329.70, 1340.30
Support level: 1321.30, 1313.90
250418 Daily Analysis
25 April 2018 Daily Analysis
Dollar faded over recession of U.S. treasury yields.
Dollar index retreated from two-month highs against its major peers by 0.13% to 90.52 as of writing over the backdrop of fading U.S. treasury yields and the release of mixed economic data in the region. Overnight, new home sales was reported to achieve gains of 4% to a seasonally adjusted annual rate of 694,000 units which was better than the economists’ forecast for 1.9% gains to 625,000 units. In addition, Conference Board Consumer Confidence data has recorded an increase of 1.7 to 128.7 versus the expected reading of 126. However, gains of the Greenback was pared following Richmond Fed manufacturing index that missed the expected reading of 16, last stood at 15. In addition, a retreat of the 10-year U.S. treasury yield from its key psychological level below 3% added bearish pressure on the Greenback.
In the commodities market, crude oil price fell 1.4% to $67.65 per barrel following market participants abandoning their bets on US Sanctions against Iran after the U.S. and France were reported to reach an agreement to preserve the Iran nuclear deal through 2025. Otherwise, gold recovered its losses by 0.66% to $1328.39 a troy ounce following retracement of the Greenback. However, gains of the safe-haven asset price was expected to be limited amid optimistic market sentiment towards the Federal Reserve to increase its rates in a more aggressive pace this year.
Today’s Holiday Market Close
Time Market Event
All Day AUD/NZD ANZAC Day
Today’s Highlight Events
Time Market Event
04:15 (Thu) CAD BoC Gov Poloz Speaks
Today’s Highlight Economy Data
| Time | Nation & Data | Previous | Forecast | Actual |
| 22:30 | CrudeOIL – Crude Oil Inventories | -1.071M | -1.429M | – |
| 22:30 | CrudeOIL – Gasoline Inventories | -2.968M | -0.227M | – |
GBPUSD

GBPUSD, H1: GBPUSD was traded higher after breaking resistance level at 1.3960. However, MACD that portrays diminishing bullish momentum would suggest the pair to undergo short-term technical correction to trade lower to retest its previous high.
Resistance level: 1.4020, 1.4090
Support level: 1.3960, 1.3910
EURUSD

EURUSD, H1: EURUSD was traded lower prior retracement from resistance level at 1.2240. Diminishing bullish momentum as shown by MACD would suggest the pair to extend its losses towards the support zone around 38.2 Fibonacci level.
Resistance level: 1.2240, 1.2290
Support level: 1.2160, 1.2050
USDJPY

USDJPY, H1: USDJPY was traded higher prior rebound from trend line of ascending channel. MACD that portrays diminishing bearish momentum would suggest the pair to extend its gains towards the resistance level at 109.10.
Resistance level: 109.10, 109.70
Support level: 108.50, 108.10
CrudeOIL

CrudeOIL, H4: Crude oil price was traded lower after breaking support level at 68.40. MACD that shows increasing bearish momentum would suggest the commodity price to extend its losses if breakout at the support level 67.70 is successful.
Resistance level: 68.40, 69.00
Support level: 67.70, 67.20
GOLD

GOLD_, H1: Gold price was traded higher after breaking resistance level at 1327.50. However, diminishing bullish momentum as shown by MACD would suggest the safe-haven asset price to extend its losses towards the support level at 1327.50.
Resistance level: 1334.30, 1338.80
Support level: 1327.50, 1321.60