301017 Weekly Analysis
30 October 2017 Weekly Analysis
GCMAsia Weekly Report: October 30 – November 3
Market Review (Forex): October 23 – 27
U.S. Dollar
Greenback pared some gains against other major peers on Friday after touching three months high over the backdrop of better-than-expected economic report for the third quarter. The index which measured greenback’s strength against a basket of six major currencies rose only 0.18% while closing the week at 94.72. For the week, US dollar has recorded its largest weekly gains with 1.33%.
Referring to the report released by the US Commerce Department, Gross Domestic Product (GDP) grew at an annual rate of 3% in the third quarter, beating economist consensus for only 2.6%. The strong-than-expected data has further cemented the course for the Fed to raise their interest rate at a faster pace due to onset higher inflationary pressure and robust labor market.
However, the greenback was unable to sustain its bullish momentum following a report on US President Donald Trump whom favors to nominate Federal Reserve Governor Jerome Powell as the next Fed Chair. His move was seen to be bearish as Powell is deemed less hawkish than Stanford University economist John Taylor over respective views on the current economic prospect and sentiment.
US Gross Domestic Product
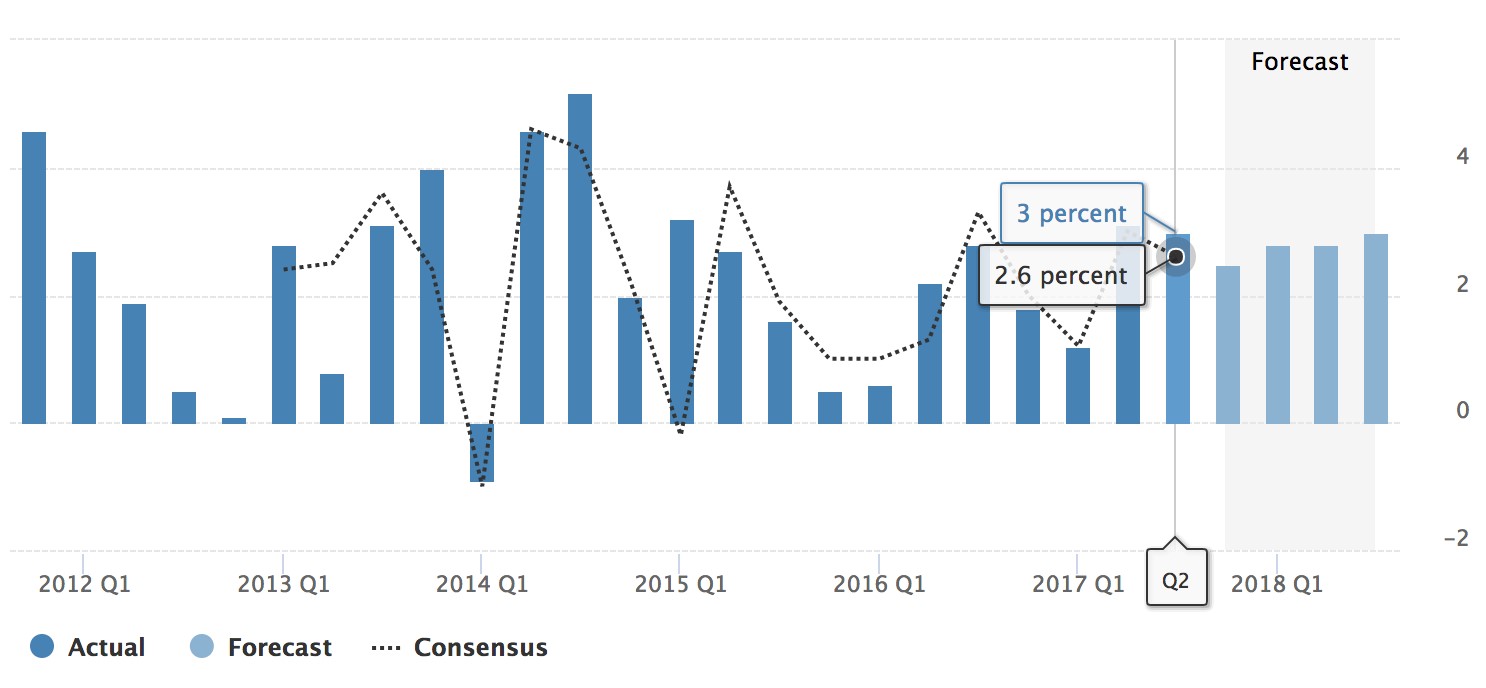
US Gross Domestic Product for third quarter grew at a faster pace with 3.0% vs 2.6%.
USD/JPY
Pair of USD/JPY was down by 0.25% to 113.62, off from prior three-months high at 114.43.
EUR/USD
Euro edged lower against the US dollar, down 1.48% for the week while closing in at $1.1608 following Catalonia’s parliament announcement for independence from Madrid, raising overall political risk in the economic bloc.
GBP/USD
Pound sterling was down by 0.21% to $1.3133, pressured by the prospect of a dovish rate hike which will not be followed by subsequent rate rise in for the time being.
Market Review (Commodities): October 23 – 27
GOLD
Gold price pared some losses on Friday following higher political risk in the EU zone due to ongoing geopolitical escalation arising from Spain. Its prices settled up 0.51% to $1,276.06 albeit recording a weekly loss of 0.68%. Catalonia parliament on Friday declared their independence from Madrid, adding more fears over instability in the EU.
The move has prompted Spain prime minister to sack the Catalan government and call for elections next month. The bullion is often used as safe haven asset in times of higher economic and political uncertainty while risk assets are generally being sold off.
Crude Oil
Crude oil price rallied on Friday, lifting the US benchmark WTI to its highest close in eight months while sending global crude benchmark above $60 a barrel for the first time in more than two years following higher expectation that major global producers will extend its production cut plan beyond its expiry date next year.
Its prices rose more than $1.26 or 2.4% while ended the week at $53.90 a barrel after touching its best level since March 1st at $54.20. For the week, its prices have recorded third consecutive weekly gains with up to $2.06 for last week.
Overall uncertainty which shrouds the oil market ahead of OPEC’s next policy meeting was lifted after Saudi Arabia and Russia declared their support to extend a global deal to cut oil supplies for another nine months, as announced by OPEC’s secretary general last Friday.
Under the original terms, OPEC and 10 other non-OPEC members led by Russia has agreed to cut daily production up to 1.8 million barrels for six months, while it has also been extended to March 2018 next year in a bid to further stabilized global oil prices.
Weekly Outlook: October 30 – November 3
For the week ahead, investors will be focusing on Wednesday’s Fed meeting for further clues regarding next rate hike and their prospect for future monetary policy path. Likewise, Friday’s US jobs report for October will be widely anticipated in order to gauge the timing of next rate hike which is highly speculated to be done by year end.
In the Europe region, investors will be looking forward for Bank of England’s policy meeting as well as EU zone growth and inflation data due this Tuesday.
As for oil traders, they will be eyeing on US inventories level reported by API and EIA to gauge the strength of crude demand for world’s largest oil consumer.
Highlighted economy data and events for the week: October 30 – November 3
| Monday, October 30 |
Data JPY – Retail Sales (YoY) (Sep) EUR – German Retail Sales (MoM) (Sep) GBP – Net Lending to Individuals USD – Core PCE Price Index (MoM) (Sep) USD – Personal Income (MoM) (Sep) USD – Personal Spending (MoM) (Sep)
Events N/A
|
| Tuesday, October 31 |
Data NZD – ANZ Business Confidence (Oct) CNY – Manufacturing PMI (Oct) JPY – BoJ Interest Rate Decision EUR – CPI (YoY) (Oct) EUR – GDP (QoQ) (Q3) EUR – Unemployment Rate (Sep) USD – Employment Cost Index (QoQ) (Q3) CAD – GDP (MoM) (Sep) USD – CB Consumer Confidence (Oct)
Events JPY – BoJ Monetary Policy Statement JPY – BoJ Outlook Report (YoY) JPY – BoJ Press Conference CAD – BoC Gov Poloz Speaks
|
| Wednesday, November 1 |
Data CrudeOIL – API Weekly Crude Oil Stock NZD – Employment Change (QoQ) (Q3) CNY – Caixin Manufacturing PMI (Oct) GBP – Manufacturing PMI (Oct) USD – ADP Nonfarm Employment Change (Oct) USD – ISM Manufacturing Employment (Oct) USD – ISM Manufacturing PMI (Oct) CrudeOIL – Crude Oil Inventories USD – Fed Interest Rate Decision
Events USD – FOMC Statement CAD – BoC Gov Poloz Speaks
|
| Thursday, November 2 |
Data AUD – Building Approvals (MoM) (Sep) AUD – Trade Balance (Sep) EUR – German Manufacturing PMI (Oct) EUR – German Unemployment Change (Oct) GBP – Construction PMI (Oct) GBP – BoE Interest Rate Decision (Oct) USD – Initial Jobless Claims USD – Unit Labor Costs (QoQ) (Q3)
Events GBP – BoE Inflation Report GBP – BoE MPC Meeting Minutes GBP – BoE Gov Carney Speaks USD – FOMC Member Powell Speaks USD – FOMC Member Dudley Speaks USD – FOMC Member Bostic Speaks
|
|
Friday, November 3
|
Data AUD – Retail Sales (MoM) (Sep) CNY – Caixin Services PMI (Oct) GBP – Services PMI (Oct) USD – Average Hourly Earnings (MoM) (Oct) USD – Nonfarm Payrolls (Oct) USD – Unemployment Rate (Oct) CAD – Employment Change (Oct) CAD – Unemployment Rate (Oct) USD – Factory Orders (MoM) (Sep) USD – ISM Non-Manufacturing Employment (Oct) USD – ISM Non-Manufacturing PMI (Oct) CrudeOIL – US Baker Hughes Oil Rig Count
Events USD – FOMC Member Kashkari Speaks |
Technical weekly outlook: October 30 – November 3
Dollar Index
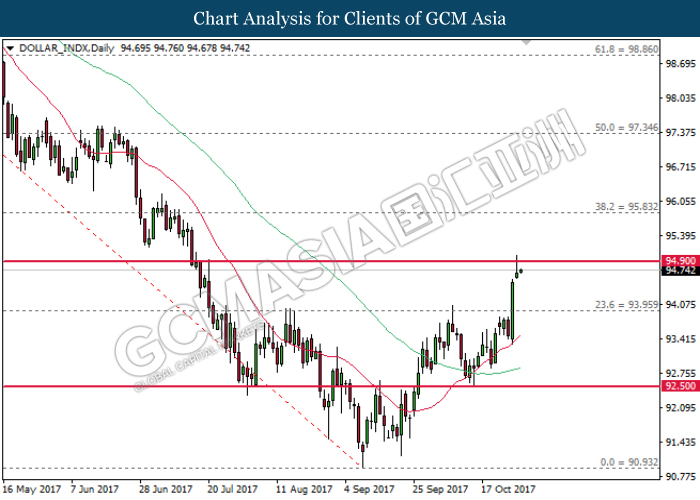
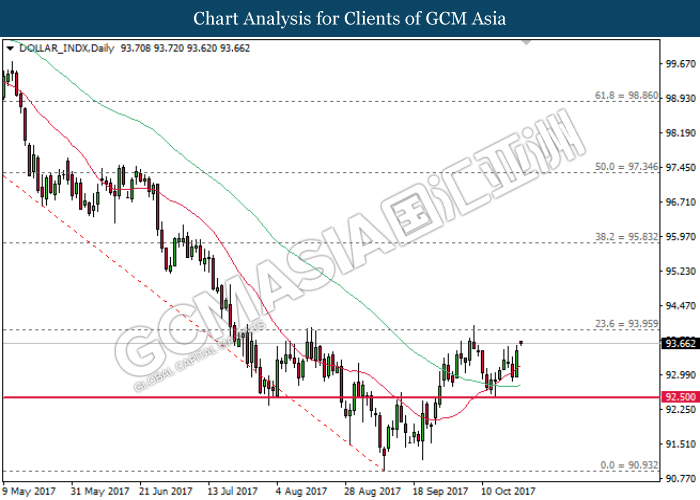
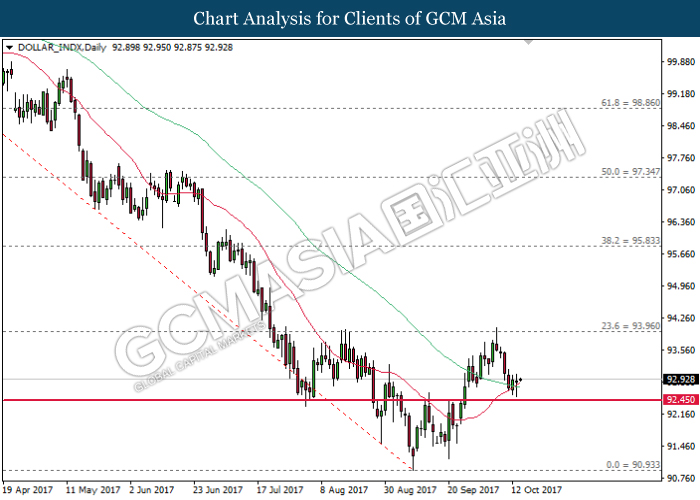
DOLLAR_INDX, Daily: Dollar index extended its gains while currently testing at one of the minor resistance of 94.90. Both MA line which continues to expand upwards suggest ongoing upside bias, whereby the index is expected to extend its upward momentum after breaking the target of 94.90.
Resistance level: 94.90, 95.85
Support level: 93.95, 92.50
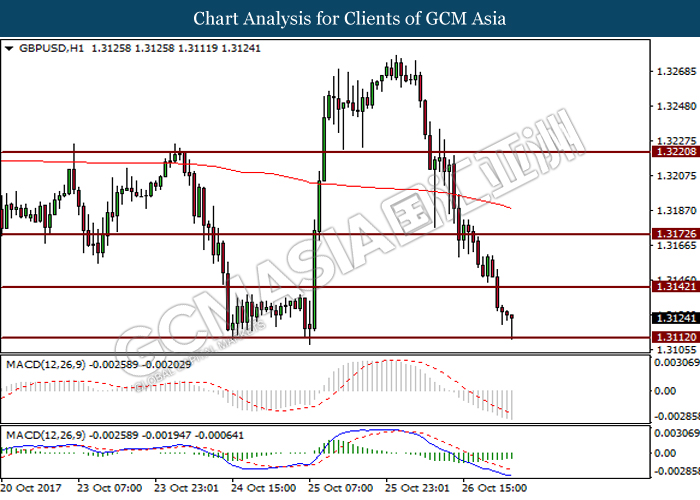
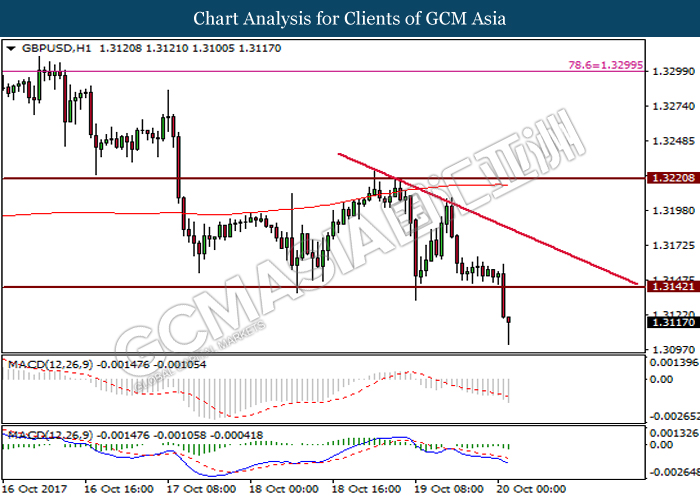
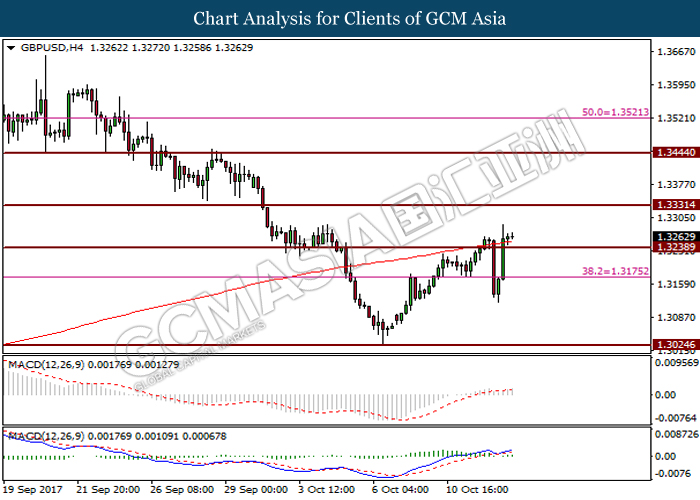
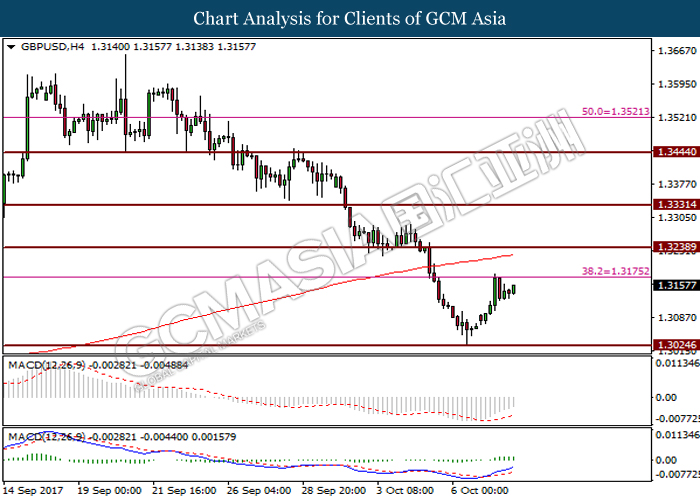
GBPUSD
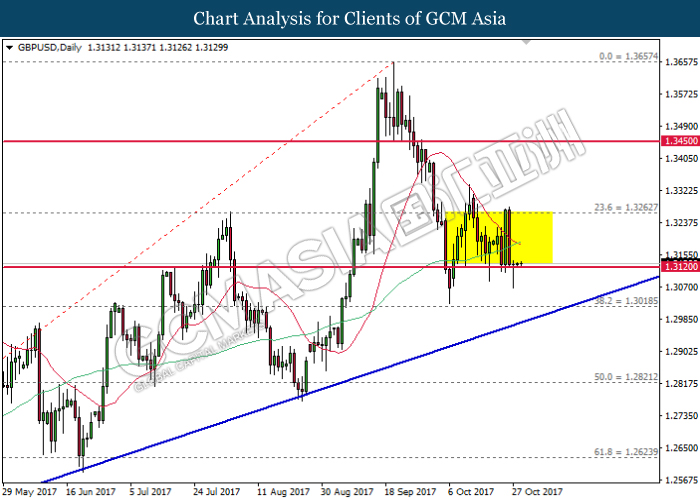
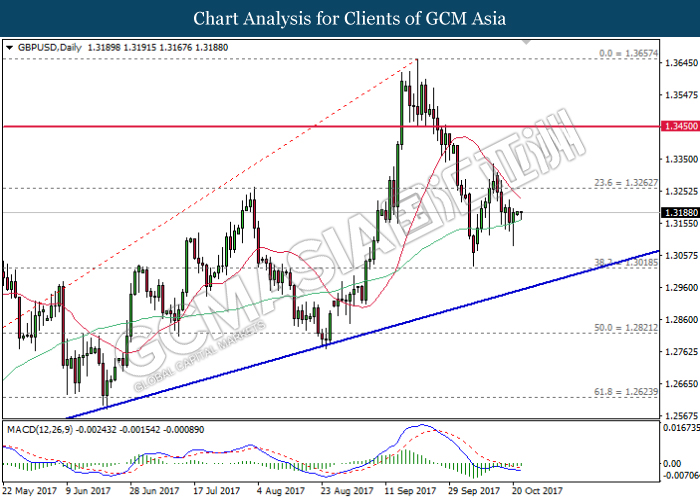
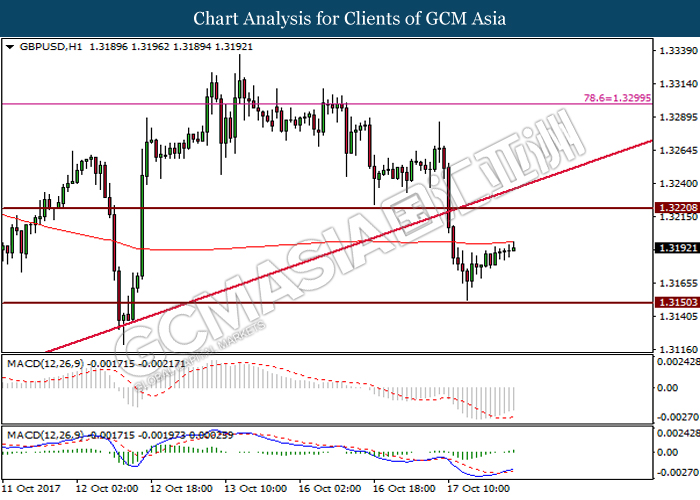
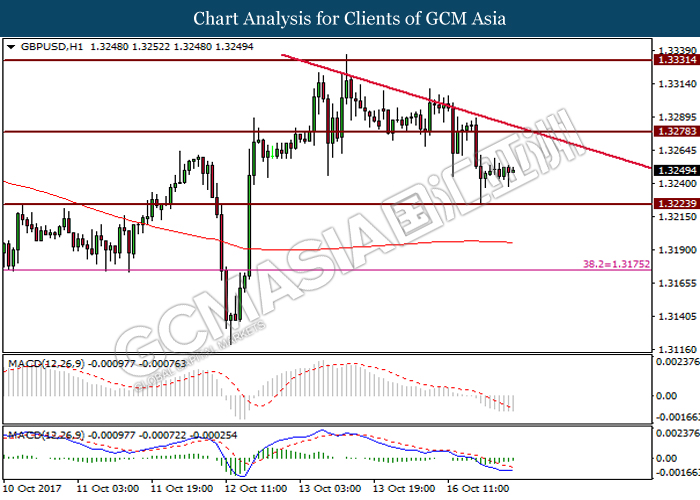
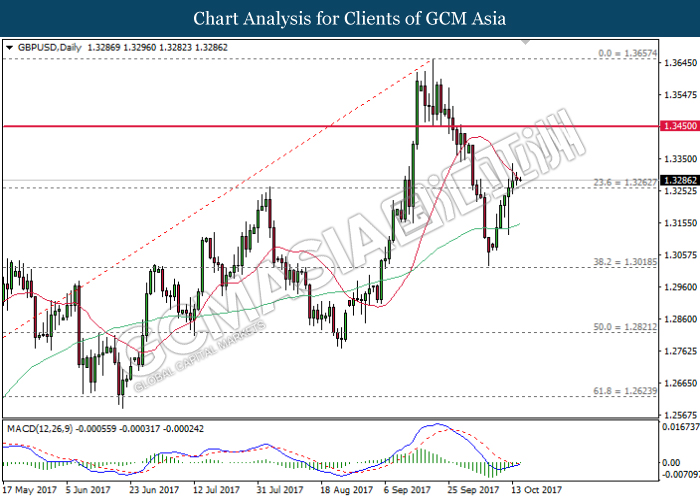
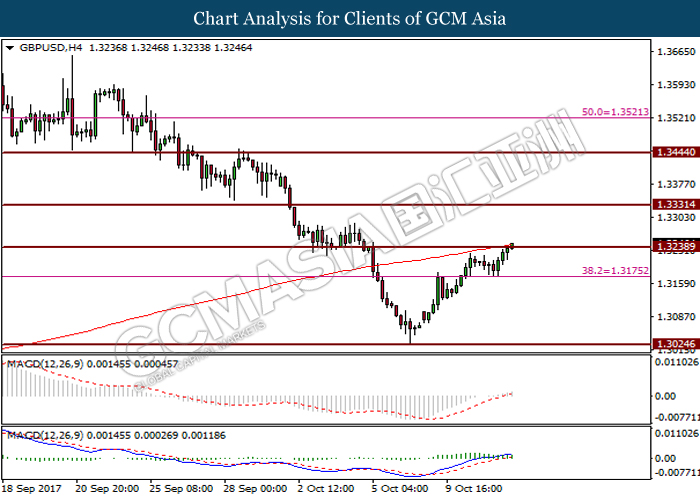
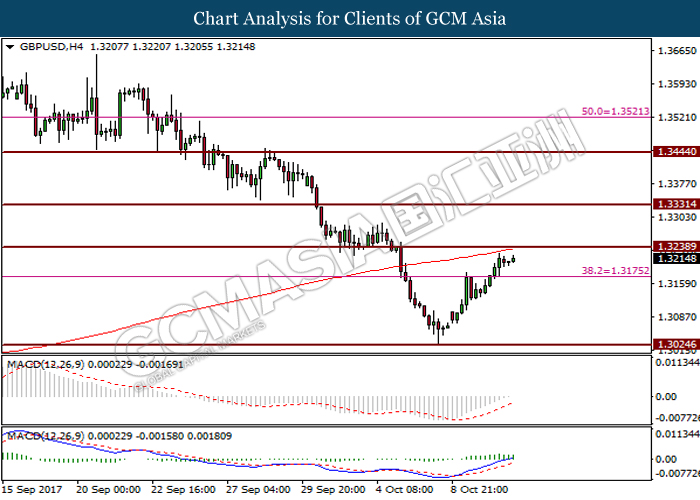
GBPUSD, Daily: GBPUSD remains traded within a tight range while currently testing at the strong support level near 1.3120. Both MA line has recently formed a death cross, suggesting further downside bias for the pair. Thus, a successful closure below the target of 1.3120 would open further bearish bias thereafter.
Resistance level: 1.3260, 1.3450
Support level: 1.3120, 1.3020
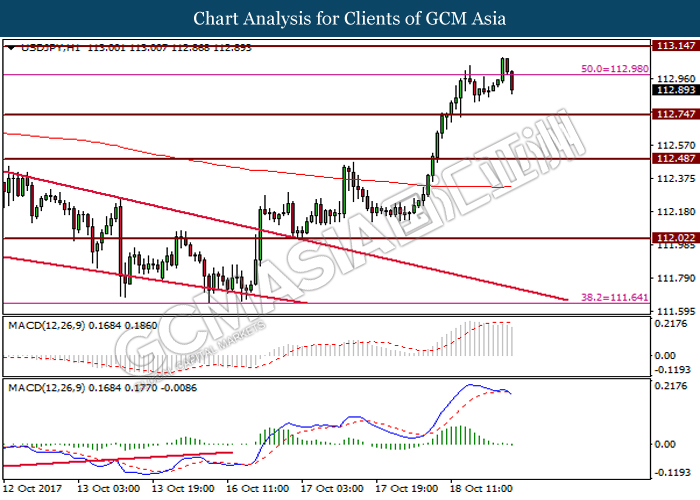
USDJPY
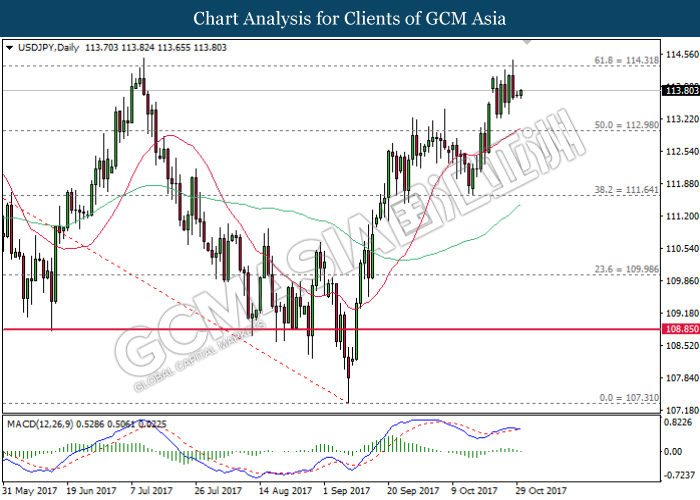
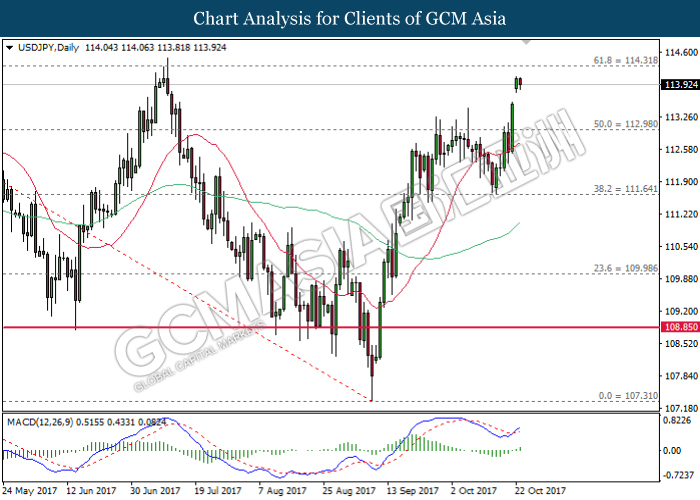
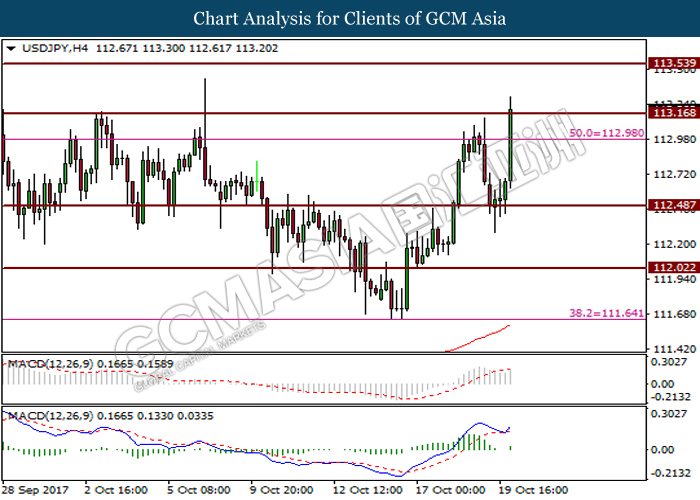
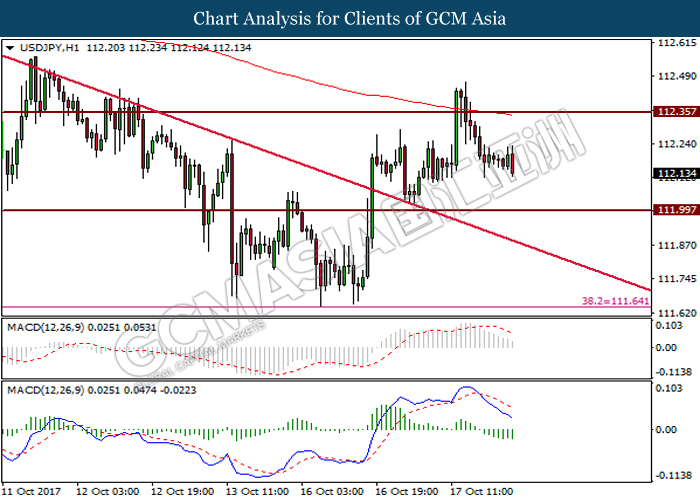
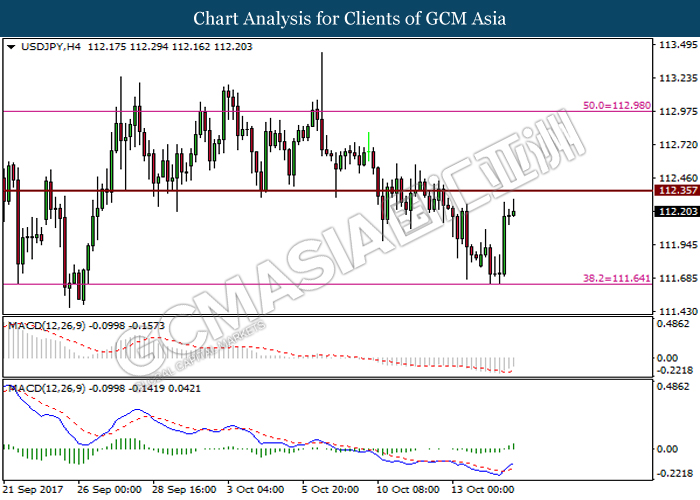
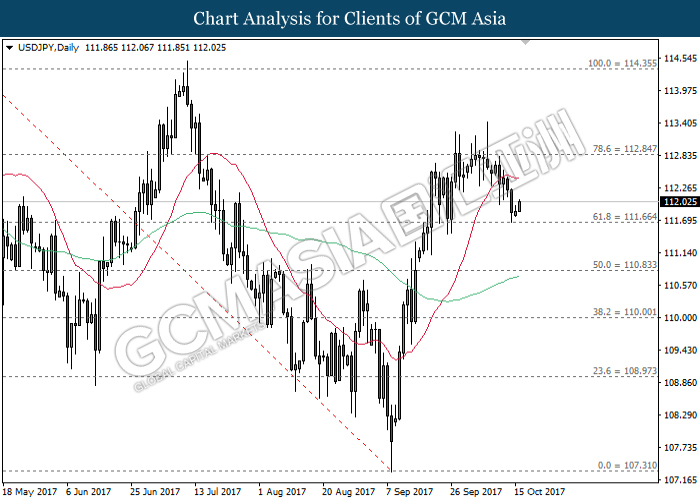
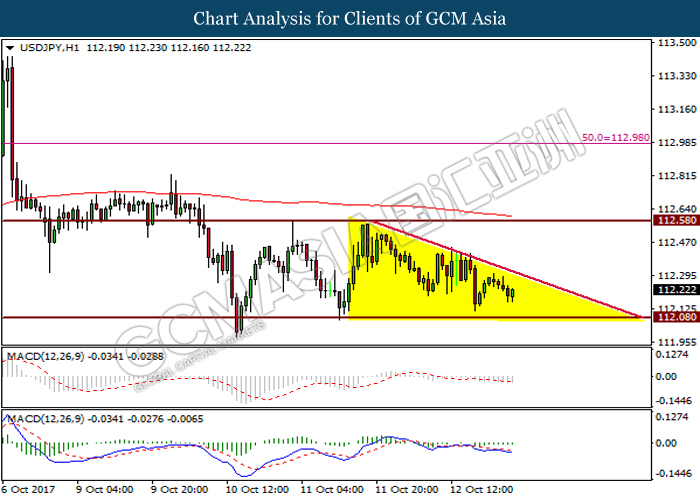
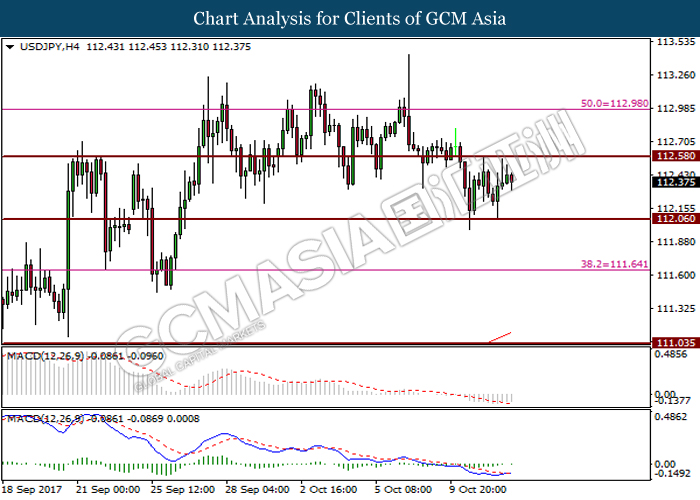
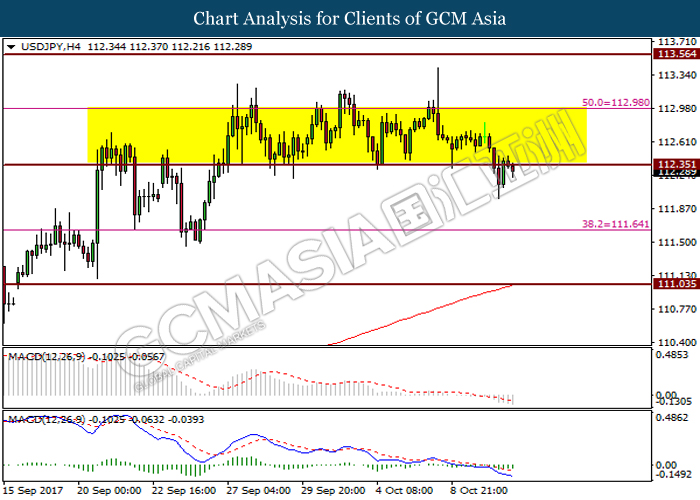
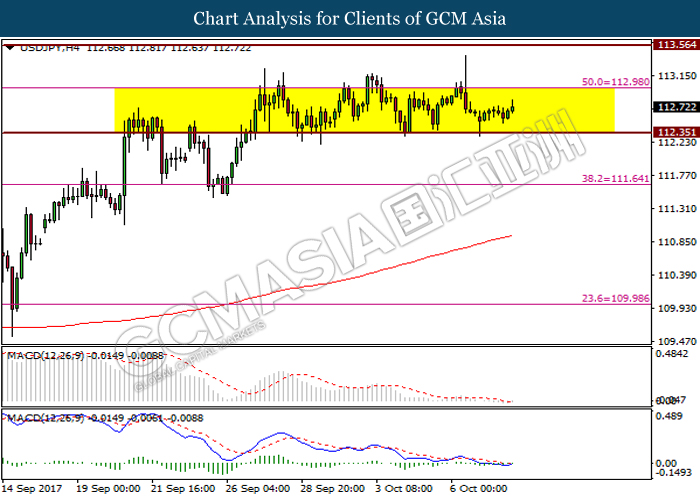
USDJPY, Daily: USDJPY was traded lower following prior retrace from the strong resistance level near 114.30. MACD histogram which begins to illustrate diminishing upward signal suggest USDJPY to experience technical correction and to be traded lower in short-term. First target will be near the 20-MA line (red) of 113.00.
Resistance level: 114.30, 115.15
Support level: 113.00, 111.65
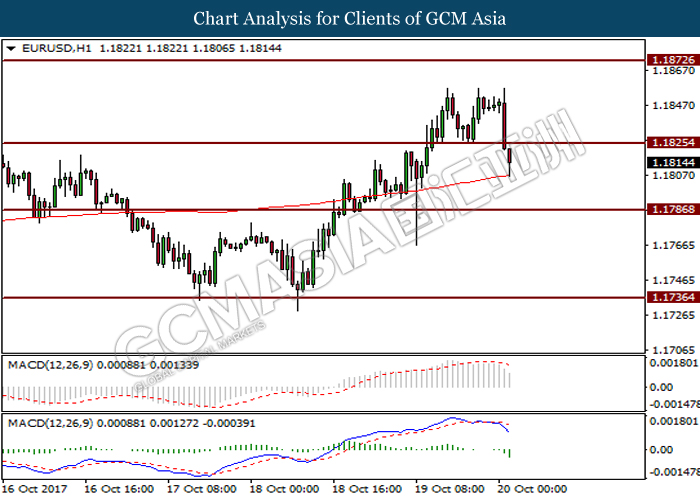
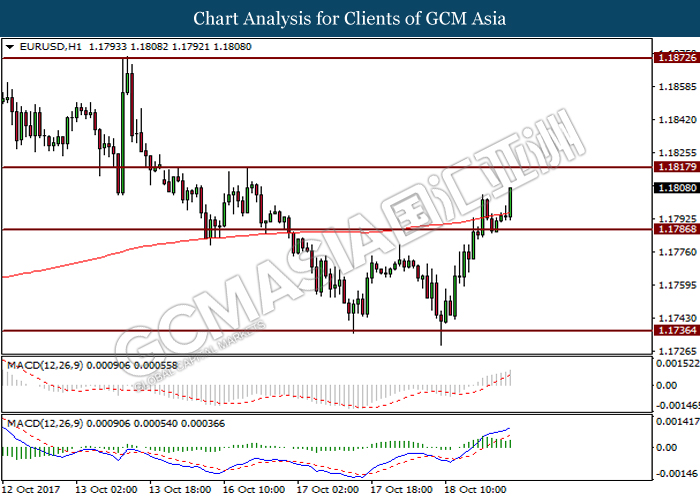
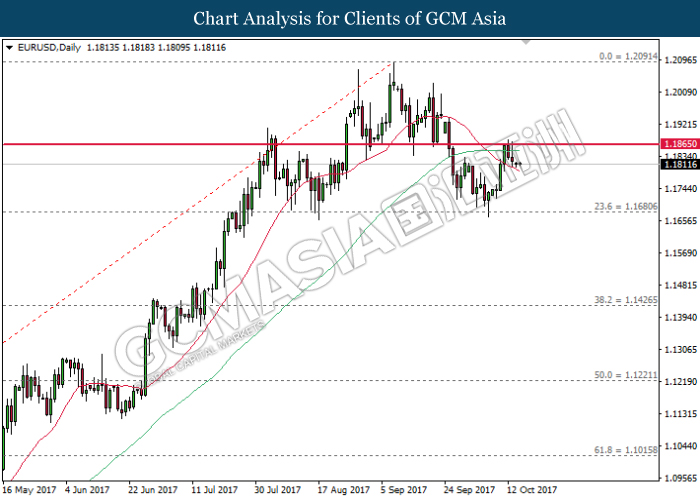
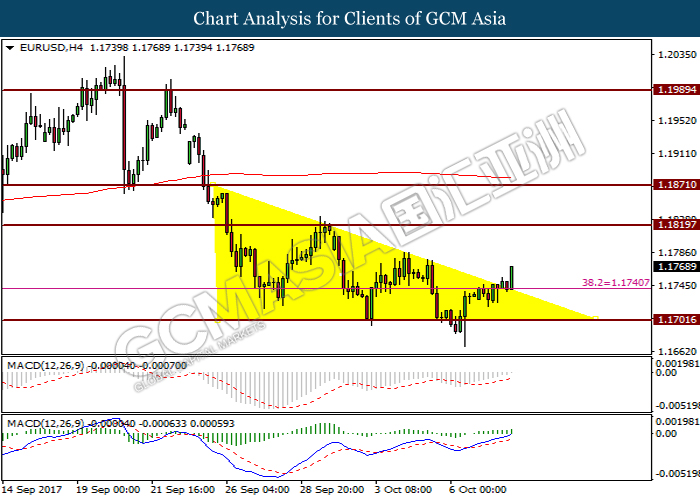
EURUSD
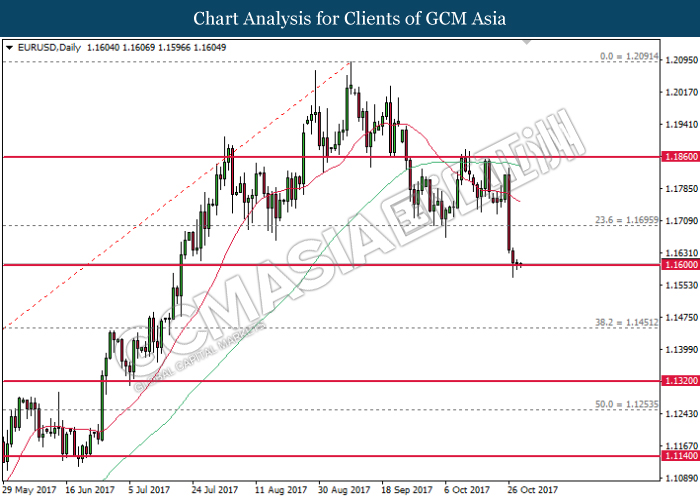
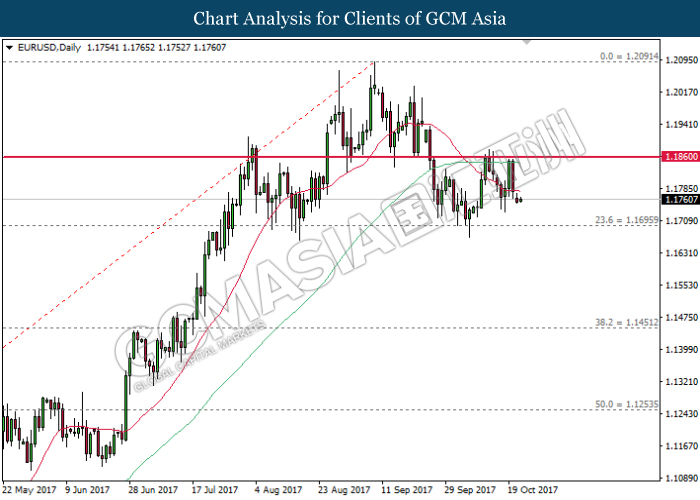
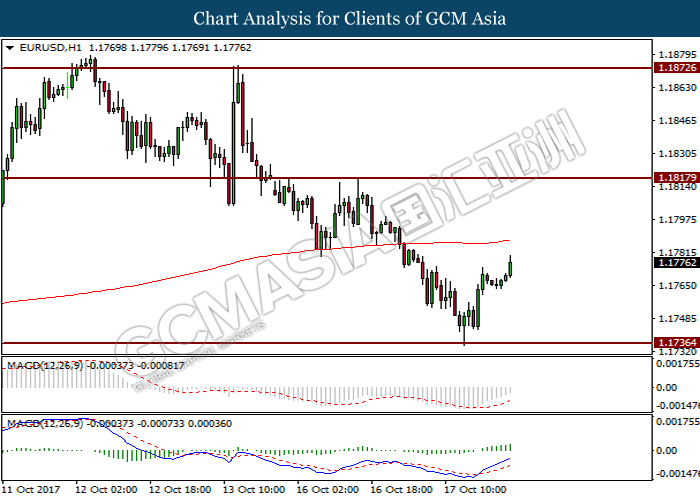
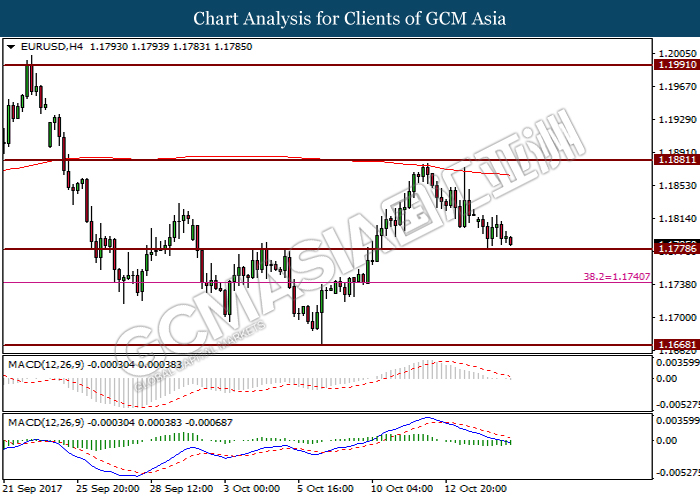
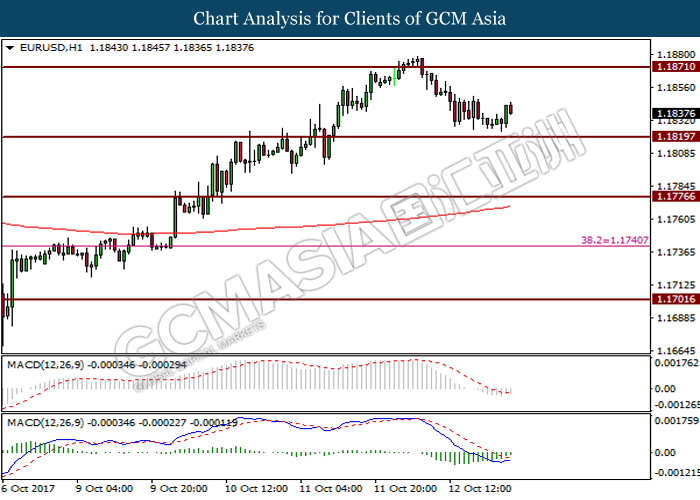
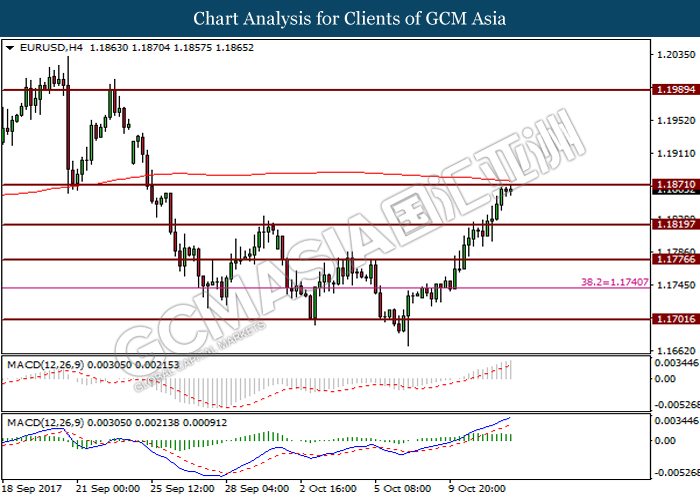
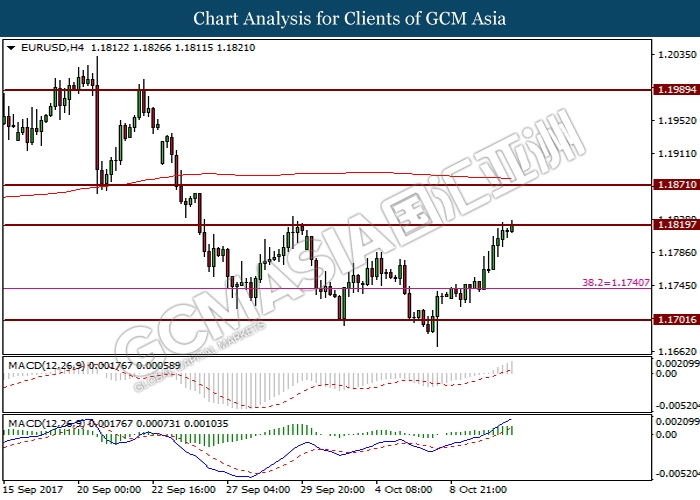
EURUSD, Daily: EURUSD extended its losses following prior breakout from the head and shoulders neckline at 1.1700. Both MA line which continues to expand downwards suggest the pair to move further down after closing below the psychological level of 1.1600.
Resistance level: 1.1700, 1.1860
Support level: 1.1600, 1.1450
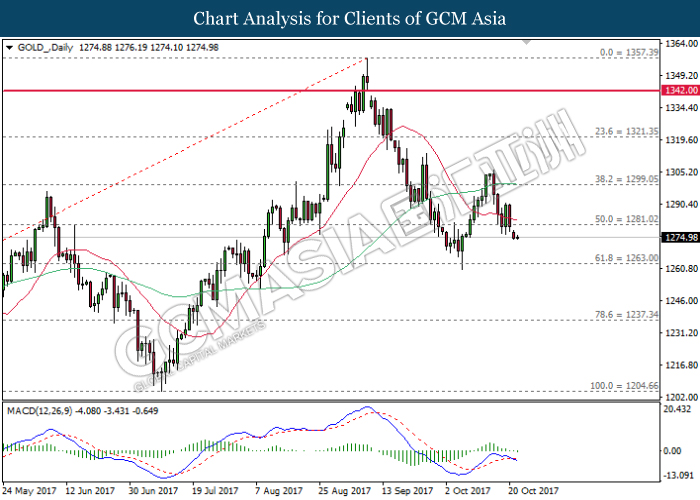
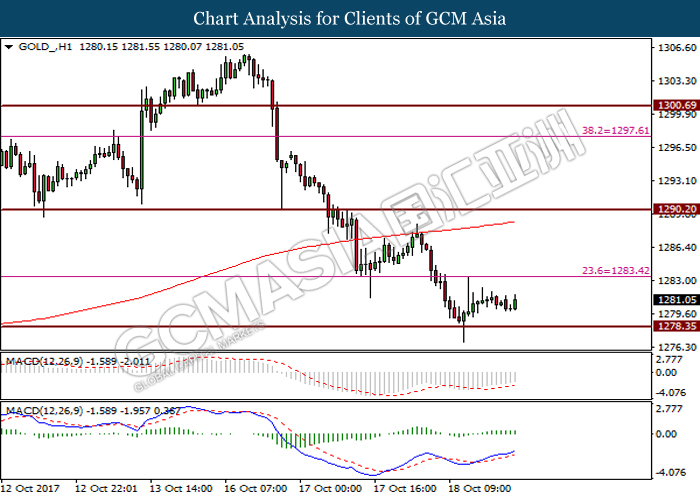
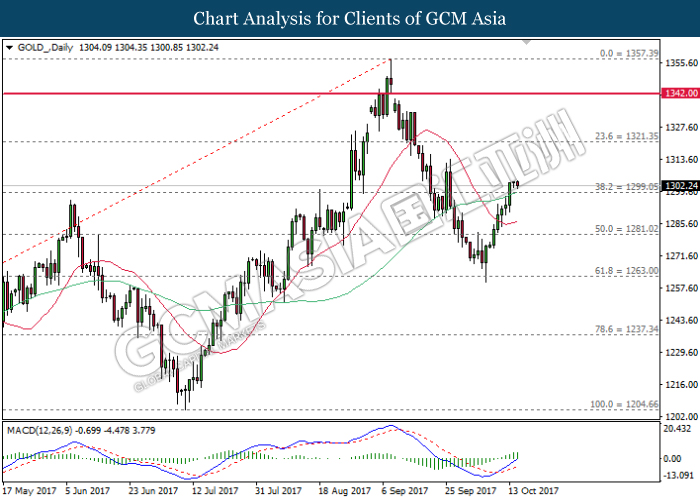
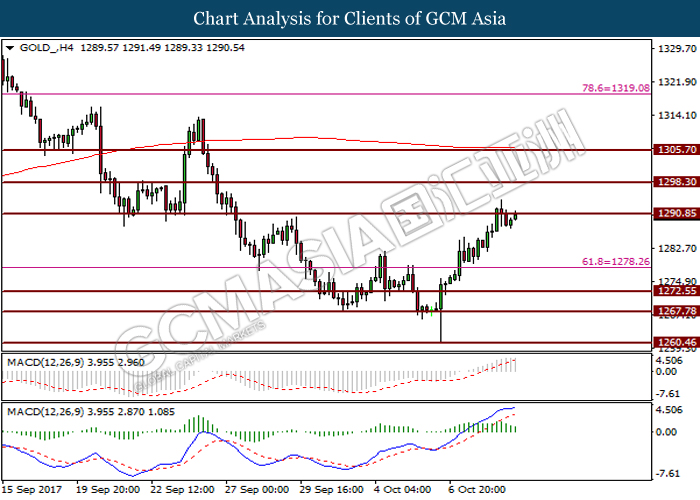
GOLD
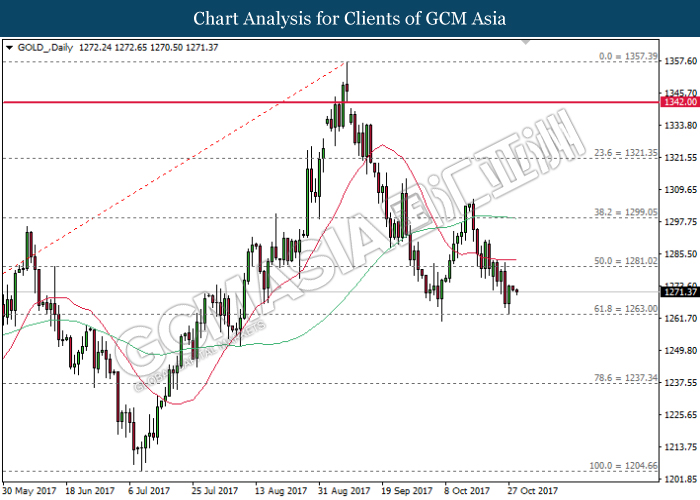
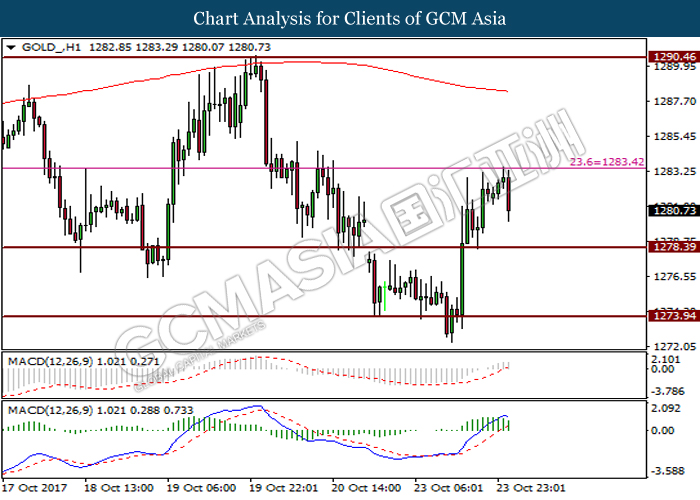
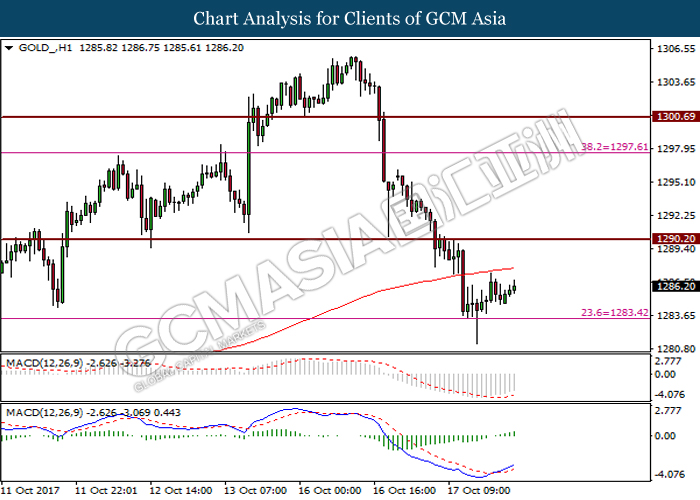
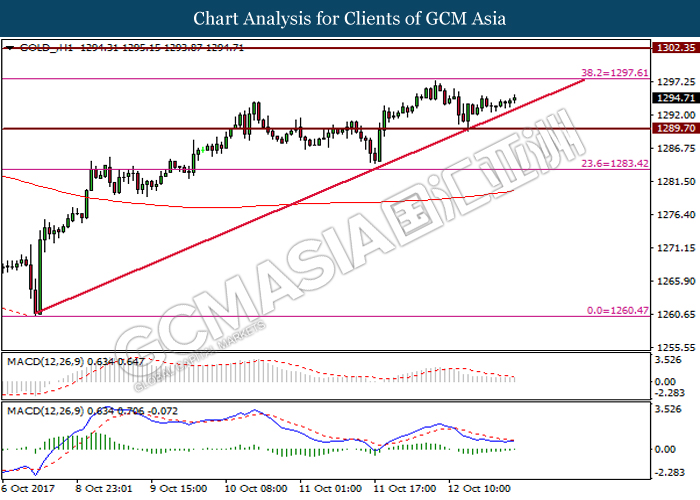
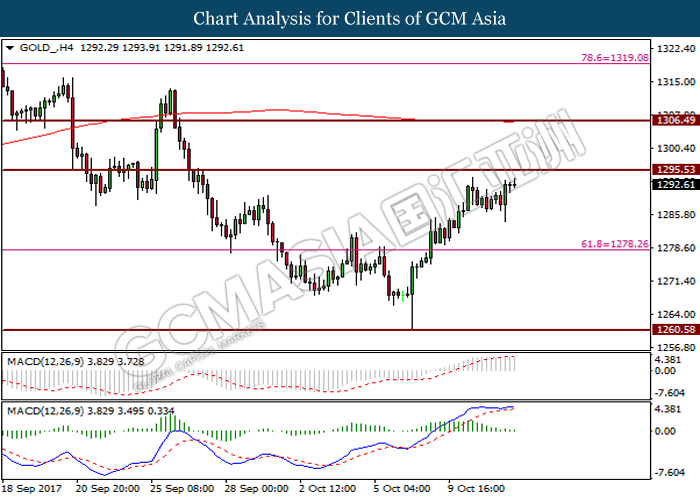
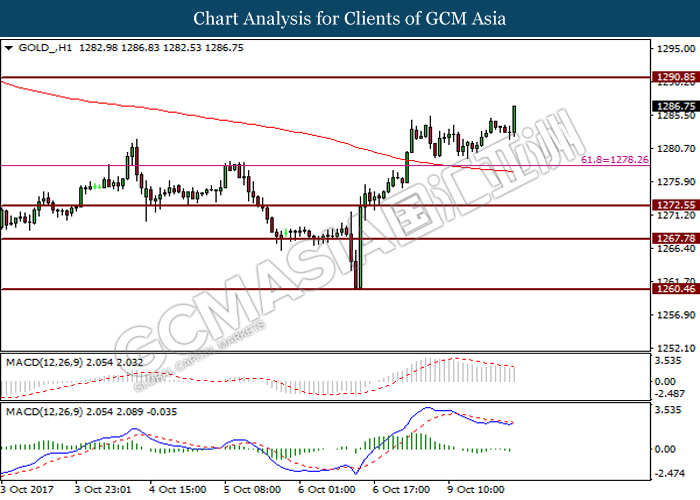
GOLD_, Daily: Gold price was traded higher following prior rebound from the strong support level at 1263.00. The rebound has formed a double bottom formation while such price action suggests the commodity to be traded higher in short-term as technical correction with first target at 1281.00.
Resistance level: 1281.00, 1299.05
Support level: 1263.00, 1237.35
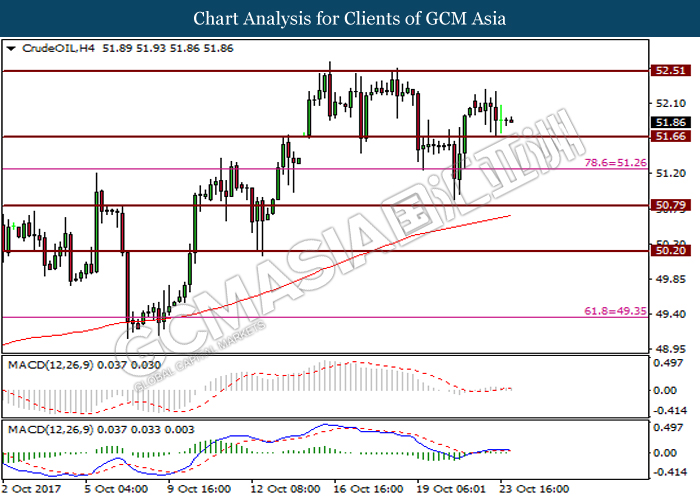
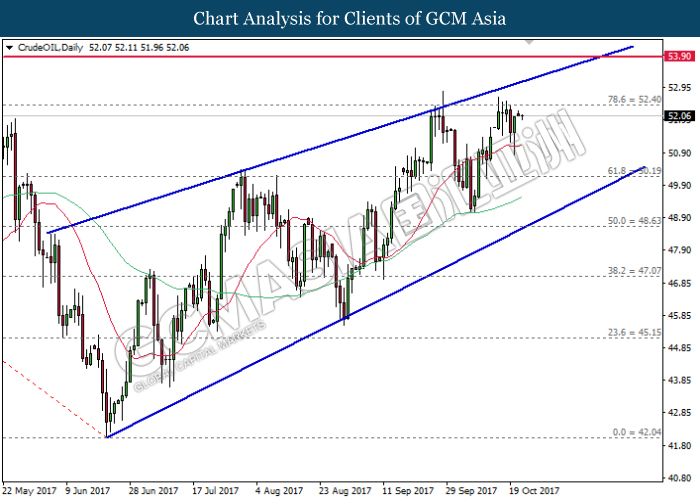
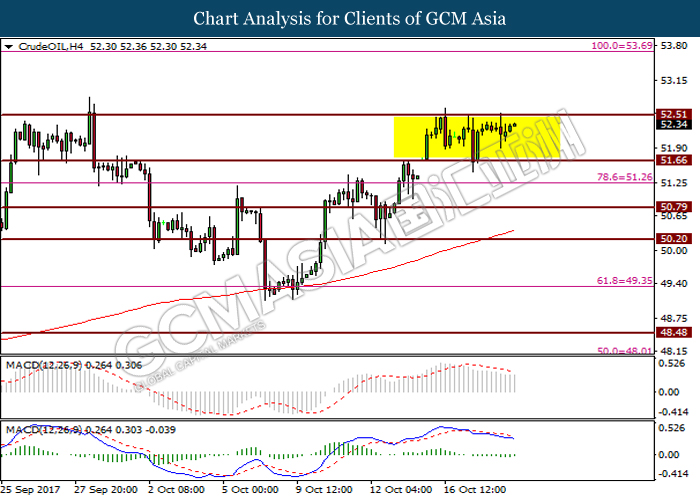
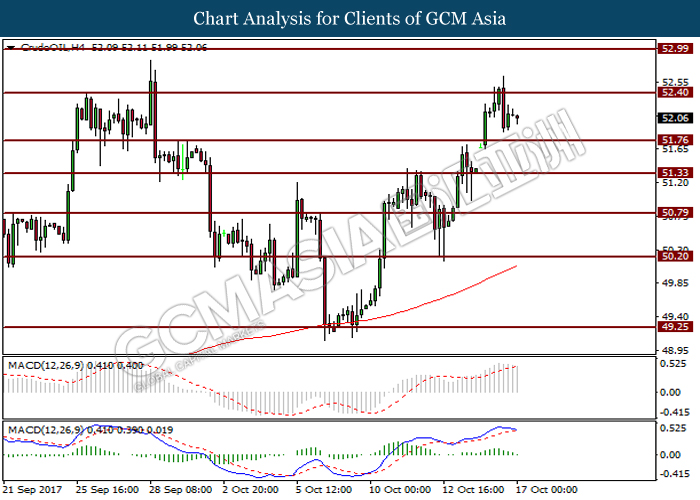
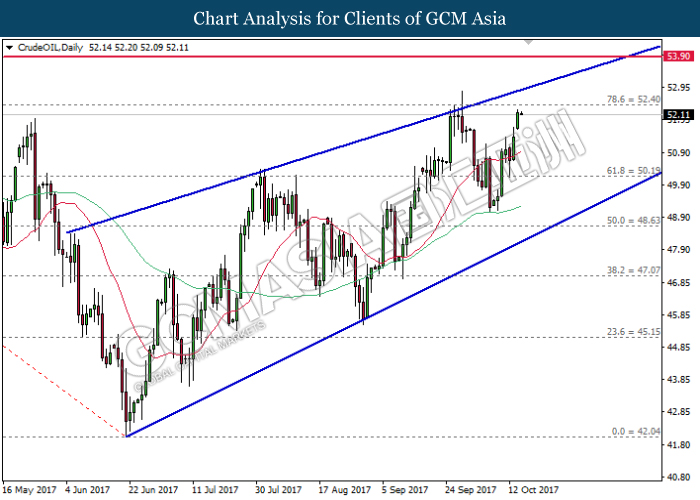
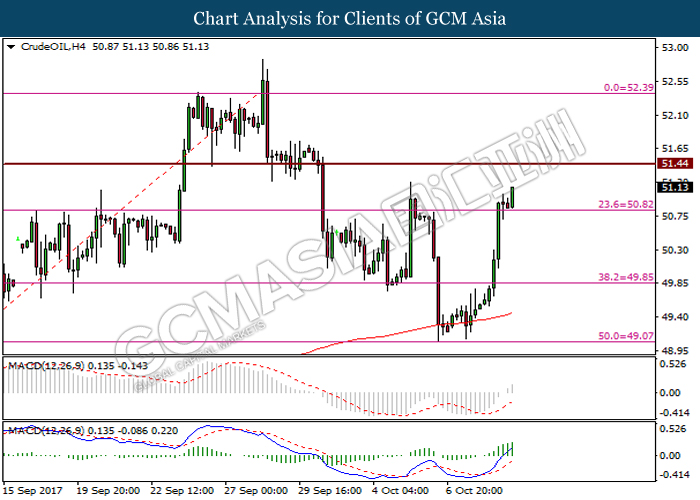
Crude Oil
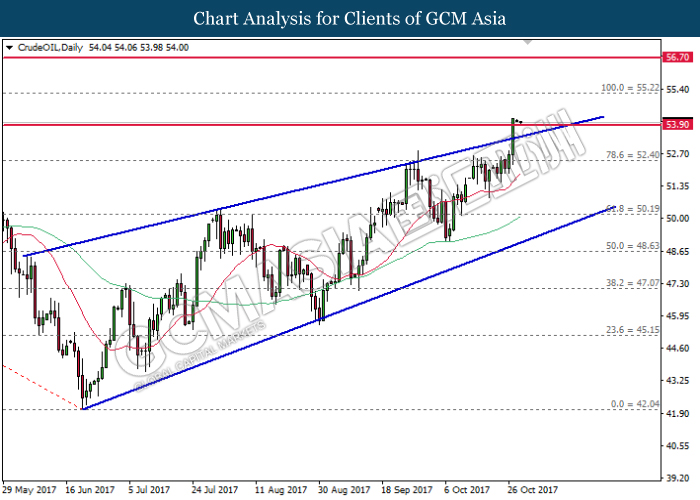
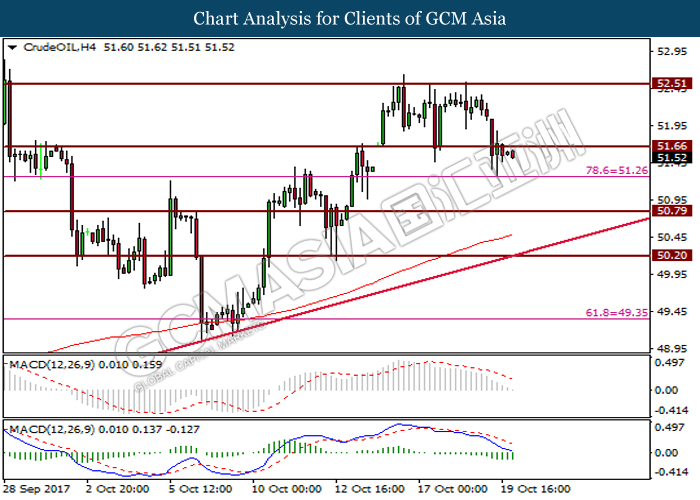
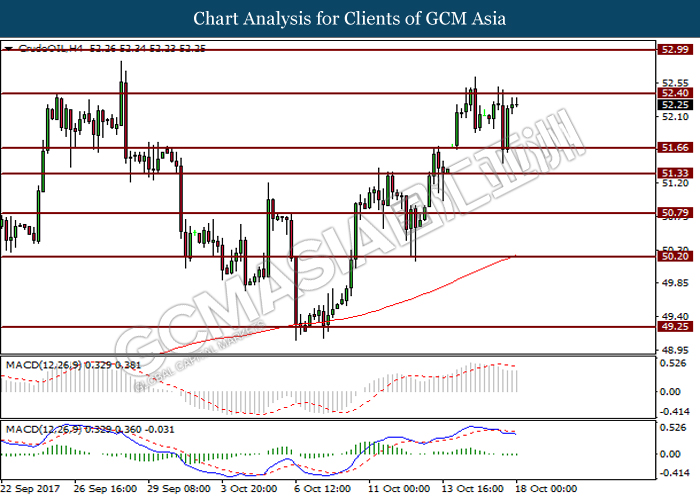
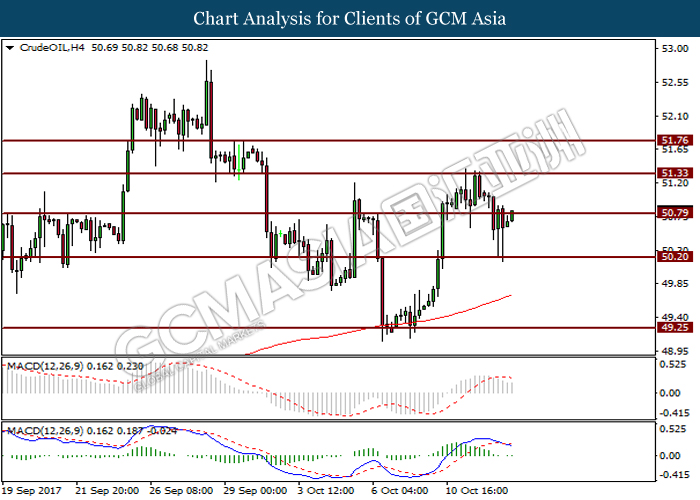
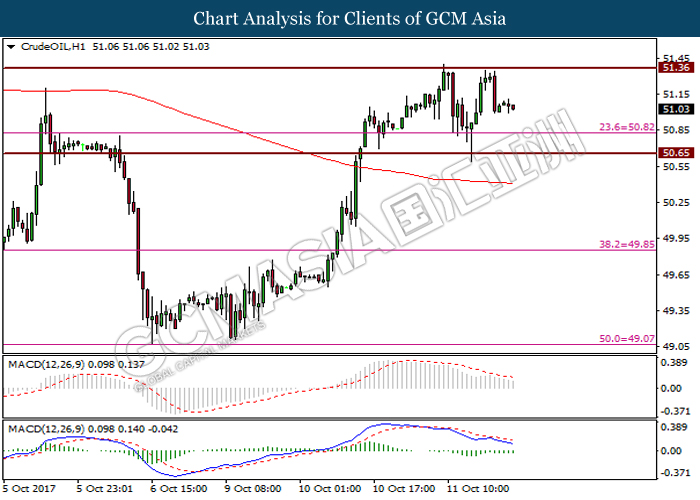
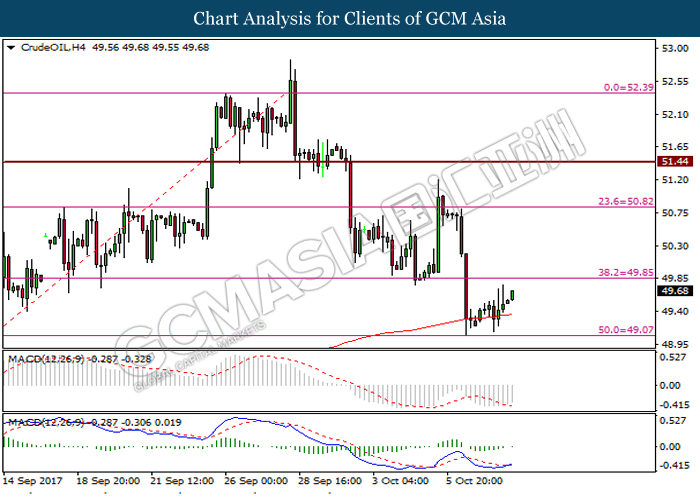
CrudeOIL, Daily: Crude oil price extended its gains following prior breakout from the top level of rising wedge, signaling a change in trend direction to move further upwards. A successful rebound from the support level of 53.90 would suggest the commodity price to advance further up, towards the strong resistance level at 55.20.
Resistance level: 55.20, 56.70
Support level: 53.90, 52.40
271017 Daily Analysis
27 October 2017 Daily Analysis
Euro plunged as Draghi releases its doves.
Euro extended its losses on Friday during Asian trading hours by 0.15% to $1.1635 against the Greenback amid dovish remark from European Central Bank (ECB) President Mario Draghi. As widely expected by most investors, ECB has announced to taper its major quantitative easing program, in accordance with the current economic performance. The asset purchase program was reduced from a monthly volume of EUR 60bn to EUR 30bn while the duration of bond purchasing program was extended for another nine months until September 2018. However, Draghi also issued a dovish statement which stated that while the economic outlook has improved considerably and the ECB is increasingly optimistic on developments in the areas of investment and in particular job creation, there is still no commitment to an end date for net-asset purchases. Depending on ongoing stimulus, the QE program may be extended in size or duration if necessary. The ECB’s stock of purchases and accommodation policy rate will also be maintained until after September 2018. On the other hand, US dollar rose 0.19% to 94.65, its highest level in three months following bearish pressure on the single common currency – Euro.
In the commodity market, crude oil prices remained mixed and traded at $52.63/barrel prior to the imminent release of U.S. oil rig count data while investors remained cautious as OPEC member and major producer Venezuela reportedly faces problems with making payments of $985 million on bonds issued to the state oil company Petroleos de Venezuela SA (PDVSA). On the other hand, gold price extended its losses by 0.05% to $1266.91 a troy ounce following a surge in the Greenback.
Today’s Holiday Market Close
Time Market Event
N/A
Today’s Highlight Events
Time Market Event
N/A
Today’s Highlight Economy Data
| Time | Nation & Data | Previous | Forecast | Actual |
| 07:30 | JPY – National Core CPI (YoY) (Sep) | 0.7% | 0.8% | 0.7% |
| 07:30 | JPY – Tokyo Core CPI (YoY) (Oct) | 0.5% | 0.5% | 0.6% |
| 20:30 | USD – GDP (QoQ) (Q3) | 3.1% | 2.6% | – |
| 20:30 | USD – Real Consumer Spending (Q3) | 3.3% | 2.2% | – |
| 22:00 | USD – Michigan Consumer Sentiment (Oct) | 101.1 | 100.8 | – |
| 01:00 | CrudeOIL – US Baker Hughes Oil Rig Count | 736 | – | – |
GBPUSD
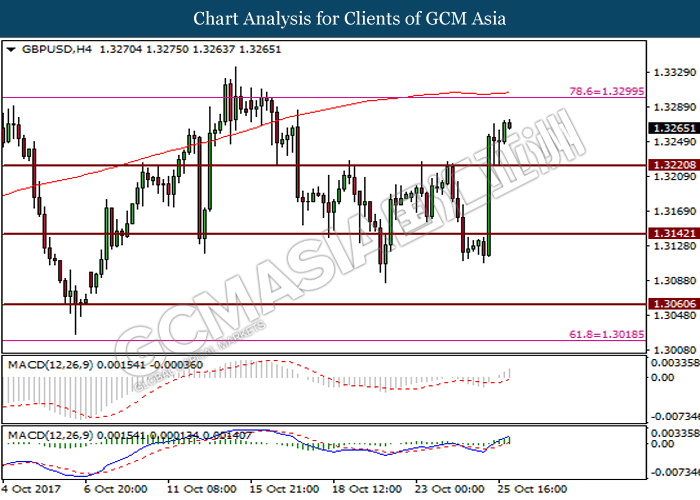
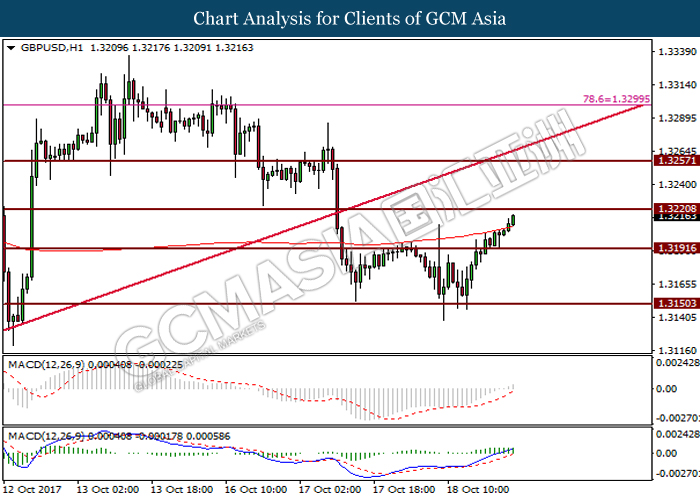
GBPUSD, H1: GBPUSD was traded higher prior rebound from support level at 1.3115. Formation of pin bar candlestick and upward slope of MACD histogram suggest the pair to undergo short-term technical correction to trade higher toward the resistance level at 1.3140.
Resistance level: 1.3140, 1.3170
Support level: 1.3115, 1.3060
EURUSD
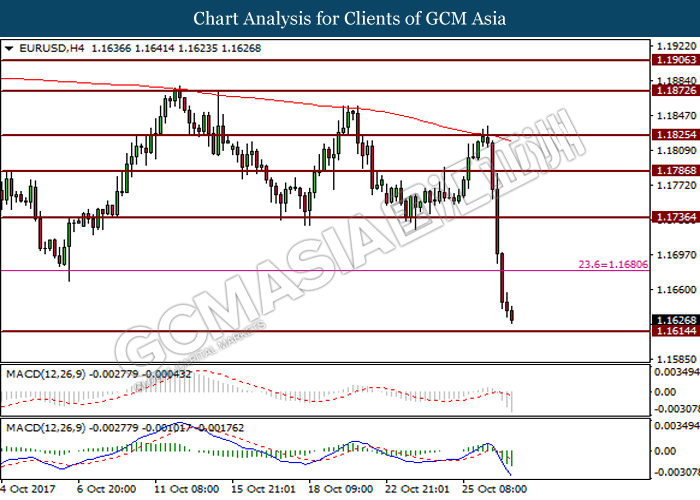
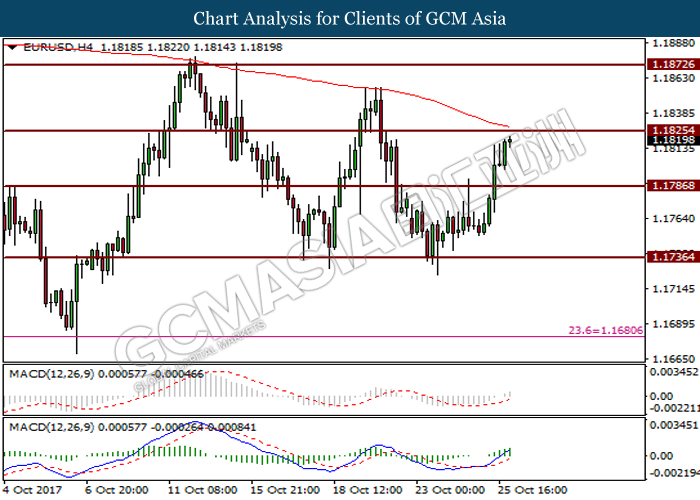
EURUSD, H4: EURUSD was traded lower after breaking support level at 1.1680. Bearish arrangement of candlesticks and MACD histogram that shows increasing downward momentum suggest the pair to extend losses toward the next support level at 1.1615.
Resistance level: 1.1680, 1.1735
Support level: 1.1615, 1.1475
USDJPY
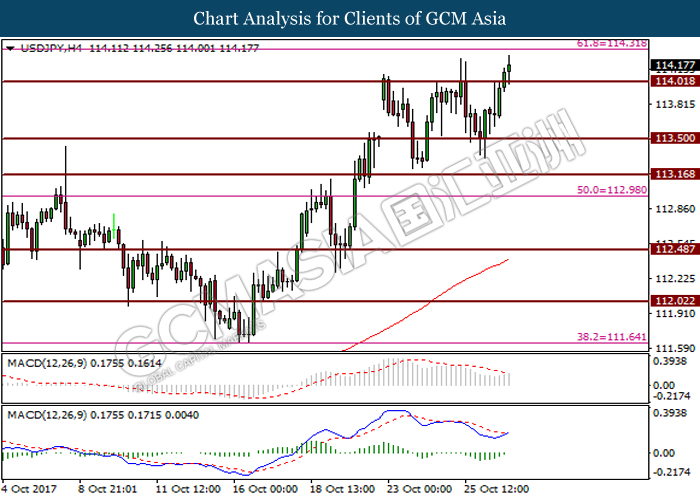
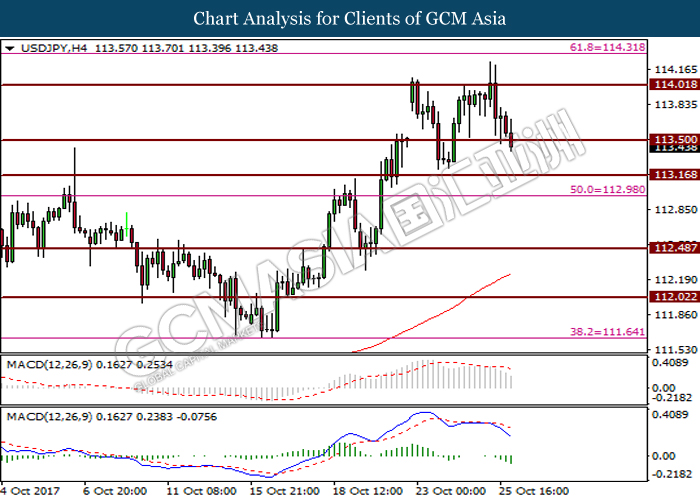
USDJPY, H4: USDJPY was trade higher prior breaking resistance level at 114.00. Golden-cross as formed by MACD signal line suggest the pair to extend its gains toward the next resistance level at 114.30.
Resistance level: 114.30, 114.95
Support level: 114.00, 113.50
CrudeOIL
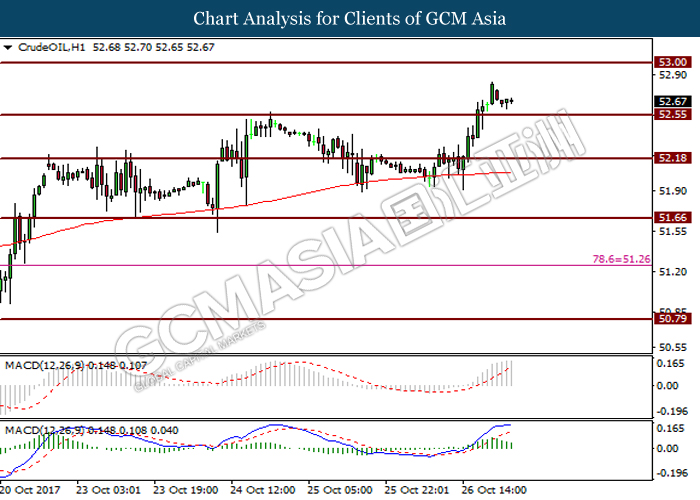
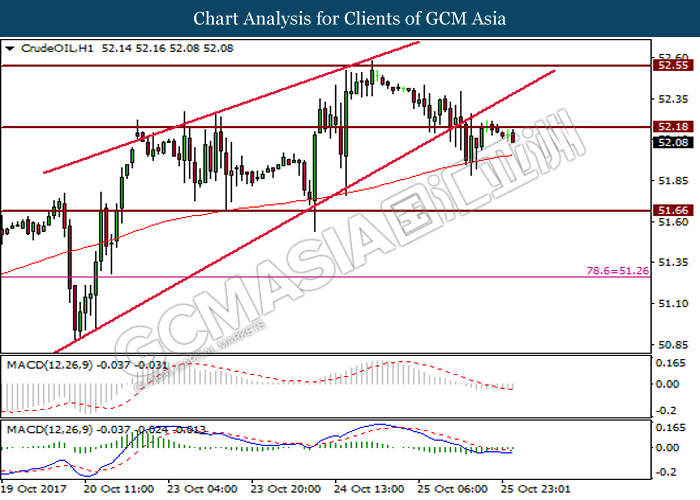
CrudeOIL, H1: Crude oil price was traded higher after breaking resistance level at 52.55. However, formation of pin bar candlesticks and downward slope of MACD histogram suggest crude oil price to undergo short-term technical correction to trade lower toward the support level at 52.55 before extending its gain.
Resistance level: 53.00, 53.70
Support level: 52.55, 52.20
GOLD
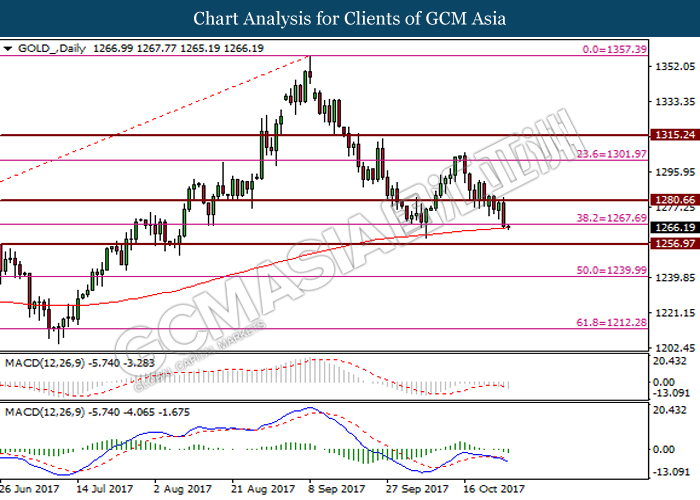
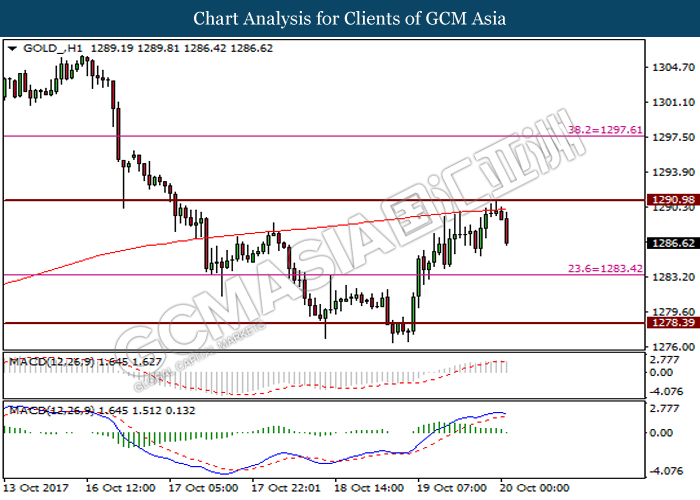
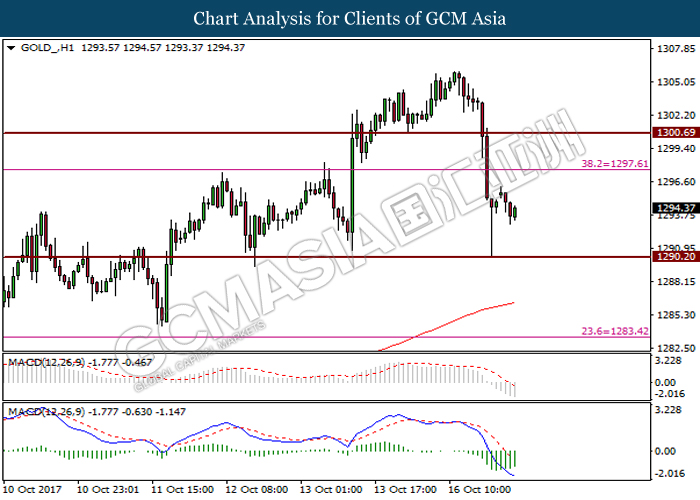
GOLD_, Daily: Gold price was traded lower prior retracement from resistance level at 1280.65. The commodity is currently testing the support level at 1267.70 and support by 200-MA line. Successful closure below the said support level would indicate the commodity to extend its losses toward the next support level at 1256.95.
Resistance level: 1280.65, 1302.00
Support level: 1267.70, 1256.95
261017 Daily Analysis
26 October 2017 Daily Analysis
Pound Sterling leading the race amid positive GDP data.
Dollar index was traded lower against a trade-weighted basket of major currencies, last quoted down 0.32% to 93.35 as of writing despite positive new home sales data which hit nearly 10-year high as the gains were being offset by a surge in Pound Sterling amid bullish economic growth in United Kingdom. According to the US Commerce Department, non-defense capital goods orders rose 1.3% in September versus the expected 1% increase, while existing home sales increased 18.9% in September to a seasonally adjusted rate of 667,000 units versus the expected 0.9% decline to 555,000 units. Previously, sentiment toward the Greenback was positive amid growing expectations that Stanford University economist, John Taylor to be appointed as the next Fed chair after his interview that impressed U.S. President Donald Trump. John Taylor favors a hawkish stance toward monetary policy which he implied earlier that Fed should increase interest rates given the current level of both inflation and economic growth in the country. On the other hand, GBP/USD rose by 1% to an 8-day high of $1.3270 following stronger-than-expected U.K. growth data, with Gross Domestic Product (GDP) showing an increase of 1.5% yearly and 0.4% quarterly, catalyzing market sentiment for the Bank of England (BoE) to raise interest rates next week.
In the commodity market, crude oil price extended its losses, down 2 cents at $52.07 a barrel following data released by U.S. Energy Information Administration (EIA) that shown an increase of 856,000 barrels in U.S. crude inventories last week. Otherwise, gold price recouped its losses by 0.39% to $1280.42 a troy ounce following weakness in the Greenback despite bullish economic reports in United States.
Today’s Holiday Market Close
Time Market Event
N/A
Today’s Highlight Events
Time Market Event
20:30 EUR ECB Press Conference
22:30 USD FOMC Member Kashkari Speaks
Today’s Highlight Economy Data
| Time | Nation & Data | Previous | Forecast | Actual |
| 05:45 | NZD – Trade Balance (MoM) (Sep) | -1235M | -900M | -1.143M |
| 19:45 | EUR – Deposit Facility Rate | -0.40% | -0.40% | – |
| 19:45 | EUR – ECB Interest Rate Decision (Oct) | 0.00% | 0.00% | – |
| 20:30 | USD – Initial Jobless Claims | 222K | 235K | – |
| 22:00 | USD – Pending Home Sales (MoM) (Sep) | -2.6% | 0.2% | – |
GBPUSD
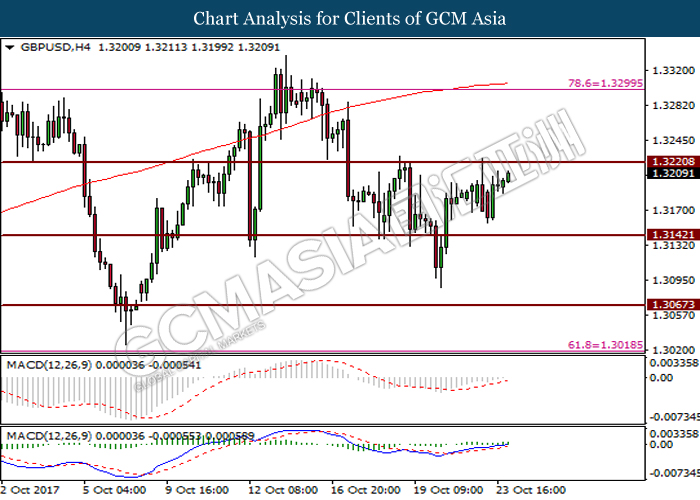
GBPUSD, H4: GBPUSD was traded higher prior breaking resistance level at 1.3220. Arrangement of bullish candlesticks and golden-cross as formed by MACD histogram suggest the pair to extend its gains toward the next resistance level at 1.3300.
Resistance level: 1.3300, 1.3440
Support level: 1.3220, 1.3140
EURUSD
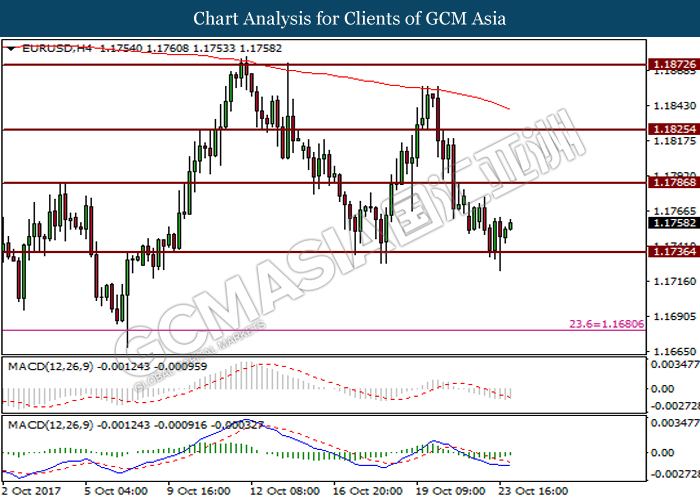
EURUSD, H4: EURUSD was traded higher after breaking resistance level at 1.1785. Arrangement of bullish candlesticks and golden-cross as formed by MACD histogram suggest EURUSD to continue trading higher toward the next resistance level at 1.1825.
Resistance level: 1.1825, 1.1870
Support level: 1.1785, 1.1735
USDJPY
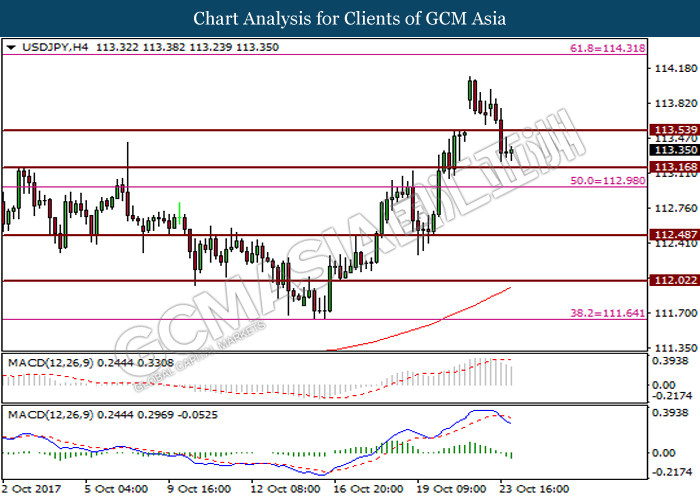
USDJPY, H4: USDJPY was traded lower prior its failure to break resistance level at 114.00. The pair is currently testing the support level at 113.50. Successful closure of candlesticks below the said support level would indicate the pair to extend losses toward the next support level at 113.15.
Resistance level: 114.00, 114.30
Support level: 113.50, 113.15
CrudeOIL
CrudeOIL, H1: Crude oil price was traded lower prior retracement from resistance level at 52.20. Upward slope of MACD histogram suggests crude oil price to trade higher but a breakout of the said resistance level is necessary for the commodity to gain further momentum to extend its gains.
Resistance level: 52.20, 52.55
Support level: 51.65, 51.25
GOLD
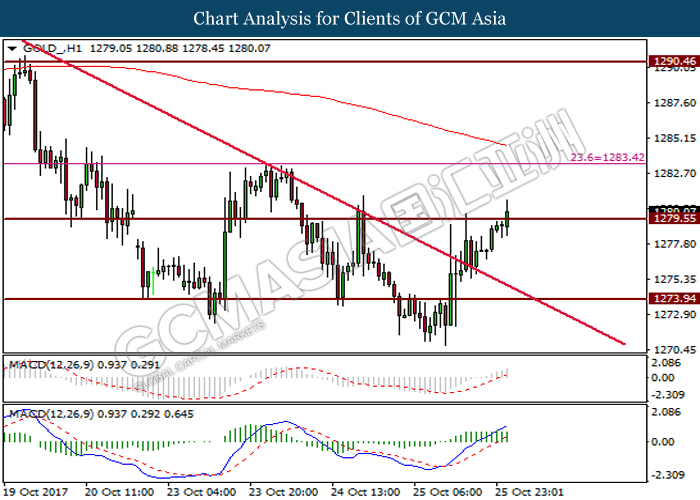
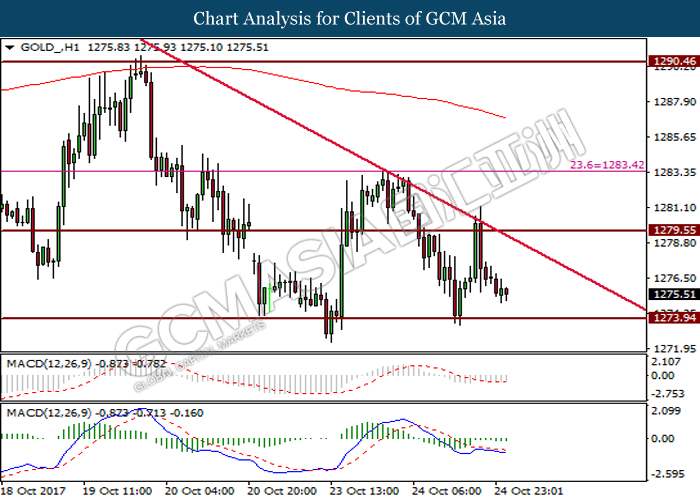
GOLD_, H1: Gold price was traded higher after breaking resistance level at 1273.95. The commodity is currently testing the next resistance level at 1279.55. Successful closure of candlestick above the said resistance level coupled with upward slope of MACD signal line suggest gold price to extend its gains toward resistance level at 1283.40.
Resistance level: 1279.55, 1283.40
Support level: 1273.95, 1268.55
251017 Daily Analysis
25 October 2017 Daily Analysis
Greenback remained steady, Pound Sterling wobbled over future BOE rate hike.
Dollar index was traded higher against a basket of major currencies with a gain of 0.09% to 93.80 as of writing following a duo of better-than-expected economic reports. U.S. Manufacturing Purchasing Managers Index (PMI) rose to 54.5 versus the expected reading of 53.1 whereas U.S. Services Business Activity Index rose to 55.9 versus the expected reading of 55.6 in the month of October. The duo positive economic data boasted investors’ sentiment toward the Greenback, thus offset its earlier wobble amid speculation concerning the appointment of the next head of the Federal Reserve. Beforehand, a rumor was released that Taylor and Powell to be the front-runner for the chance to lead the Federal Reserve when Yellen’s term ends in February 2018. On the other hand, Pound Sterling slumped 0.48% to $1.3130 amid after Bank of England deputy Governor Jon Cunliffe mentioned that the first rate hike is still an “open question” which directly lowering investors’ expectation for BoE to raise interest rate next month.
In the commodity market, crude oil price shed 0.10% to $52.42 per barrel following a report by American Petroleum Institute (API) that shown crude oil inventories in the U.S. rose by 519,000 barrels last week. Likewise, gold price reduced by 0.08% to $1275.40 a troy ounce following Greenback’s recovery from its previous low.
Today’s Holiday Market Close
Time Market Event
N/A
Today’s Highlight Events
Time Market Event
22:00 CAD BoC Monetary Policy Report
22:00 CAD BoC Rate Statement
23:15 CAD BoC Gov Poloz Speaks
Today’s Highlight Economy Data
| Time | Nation & Data | Previous | Forecast | Actual |
| 08:30 | AUD – CPI (QoQ) (Q3) | 0.2% | 0.8% | 0.6% |
| 16:00 | EUR – German Ifo Business Climate Index (Oct) | 115.2 | 115.2 | – |
| 16:30 | GBP – GDP (QoQ) (Q3) | 0.3% | 0.3% | – |
| 20:30 | USD – Core Durable Goods Orders (MoM) (Sep) | 0.5% | 0.5% | – |
| 22:00 | USD – New Home Sales (Sep) | -3.4% | -0.9% | – |
| 22:00 | CAD – BoC Interest Rate Decision | 1.00% | 1.00% | – |
| 22:30 | CrudeOIL – Crude Oil Inventories | -5.731M | – | – |
GBPUSD
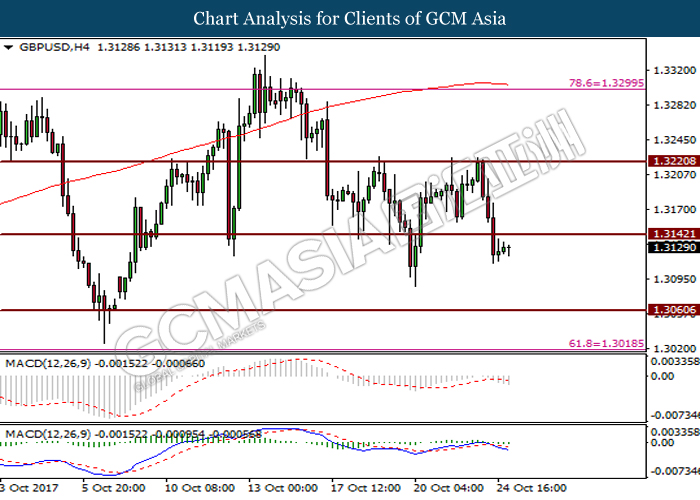
GBPUSD, H4: GBPUSD was traded lower after breaking support level at 1.3140. Successful closure of candlestick suggest the pair to continue its momentum to extend losses toward the next support level at 1.3060.
Resistance level: 1.3140, 1.3220
Support level: 1.3060, 1.3020
EURUSD

EURUSD, H1: EURUSD was traded lower prior retracement from resistance level at 1.1785. Formation of dark cloud cover candlestick pattern suggests the pair to trade lower in short-term but with lesser momentum due to absence of obvious signal from MACD histogram.
Resistance level: 1.1785, 1.1825
Support level: 1.1735, 1.1680
USDJPY
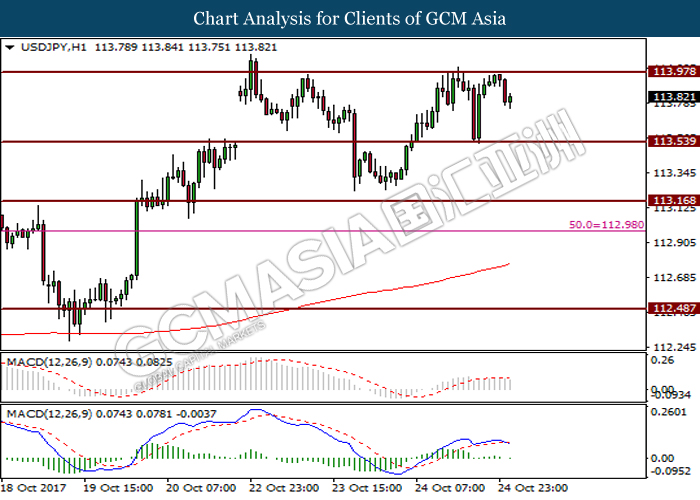
USDJPY, H1: USDJPY was traded lower prior retracement from resistance level at 113.95. Formation of pin bar candlestick and death-cross by MACD signal line suggests the pair to trade lower in short term toward support level at 113.55.
Resistance level: 113.95, 114.30
Support level: 113.55, 113.15
CrudeOIL
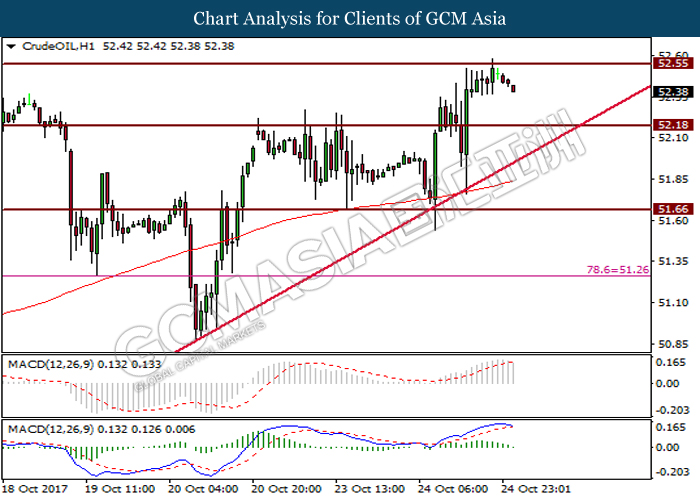
CrudeOIL, H1: Crude oil price was traded lower prior retracement from resistance level at 52.55. Downward slope of MACD histogram suggests crude oil price to extend losses in short-term toward the support level at 52.20.
Resistance level: 52.55, 53.70
Support level: 52.20, 51.65
GOLD
GOLD_, H1: Gold price was traded lower prior retracement from resistance level at 1279.55. Formation of dark cloud cover candlestick pattern and bearish candlestick arrangement suggest gold price on bias to extend losses toward the support level at 1273.95.
Resistance level: 1279.55, 1283.40
Support level: 1273.95, 1268.55
241017 Daily Analysis
24 October 2017 Daily Analysis
Powell as the next Fed? Greenback spooked by the dovish outlook.
Dollar index was traded lower against a trade-weighted basket of six major currencies, quoted down 0.19% to 93.59 amid ongoing market speculation toward the appointment of the next head of the Federal Reserve in which President Donald Trump mentioned that he would make his final decision “very shortly”. The front runners for the position lie among current Fed Chair Janet Yellen, Federal Reserve Governor Jerome Powell and Stanford University economist John Taylor. However, Powell is taking a big lead in the betting market as the next Fed’s Chair which has spur some bearish momentum this morning. All in all, Powell is more skewed towards dovish stance which may spook market participants whom are hoping for more interest rate hike down the road. Overnight, the Greenback was traded at three-month highs against the Yen, with USD/JPY rose 0.14% to 113.69 after Prime Minister Shinzo Abe won a snap election for his party, resulting in increase in traders’ expectation for the Bank of Japan (BoJ) to continue its loose monetary policy measures in the future.
In the commodity market, crude oil price rose 3 cents at $51.89 a barrel supported by declining exports from southern Iraq which fell by 110,000 barrels per day this month. Gold price seesawed around $1,281.75 while market participants look ahead towards the appointment of next Fed Chair.
Today’s Holiday Market Close
Time Market Event
N/A
Today’s Highlight Events
Time Market Event
N/A
Today’s Highlight Economy Data
| Time | Nation & Data | Previous | Forecast | Actual |
| 15:30 | EUR – German Manufacturing PMI (Oct) | 60.6 | 60.0 | – |
| 16:00 | EUR – Manufacturing PMI (Oct) | 58.1 | 57.8 | – |
| 16:00 | EUR – Markit Composite PMI (Oct) | 56.7 | 56.5 | – |
| 16:00 | EUR – Services PMI (Oct) | 55.8 | 55.7 | – |
| 21:45 | USD – Manufacturing PMI (Oct) | 53.1 | 53.6 | – |
| 21:45 | USD – Markit Composite PMI (Oct) | 54.8 | – | – |
| 21:45 | USD – Services PMI (Oct) | 55.3 | 55.6 | – |
| 04:30 | CrudeOIL – API Weekly Crude Oil Stock | -7.310M |
GBPUSD
GBPUSD, H4: GBPUSD was traded higher prior breaking above resistance level at 1.3140. Formation of engulfing candlestick and upward slope of MACD signal line suggest the pair to continue its momentum to trade higher toward resistance level at 1.3220.
Resistance level: 1.3220, 1.3300
Support level: 1.3140, 1.3070
EURUSD
EURUSD, H4: EURUSD was traded higher prior rebound from support level at 1.1735. Formation of pin bar candlestick and upward slope of MACD histogram suggest the pair to extend its gains toward resistance level at 1.1785.
Resistance level: 1.1785, 1.1825
Support level: 1.1735, 1.1680
USDJPY
USDJPY, H4: USDJPY was traded lower after breaking support level at 113.55. Formation of negative divergence as shown by MACD histogram suggests the pair to extend losses toward the next support level at 113.15.
Resistance level: 113.55, 114.30
Support level: 113.15, 113.00
CrudeOIL
CrudeOIL, H4: Crude oil price was traded higher prior breaking resistance level at 51.65. A lack of momentum as shown by MACD signal line and candlestick pattern suggest to wait for confirmation breakout to gauge the direction of this commodity in nearer term.
Resistance level: 52.50, 53.70
Support level: 51.65, 51.25
GOLD
GOLD_, H1: Gold price was traded lower prior retracement from resistance level at 1283.40. Downward slope of MACD histogram suggests gold price to undergo short-term technical correction toward the support level at 1278.40.
Resistance level: 1283.40, 1290.45
Support level: 1278.40, 1273.95
231017 Weekly Analysis
23 October 2017 Weekly Analysis
GCMAsia Weekly Report: October 23 – 27
Market Review (Forex): October 16 – 20
U.S. Dollar
Greenback rose against a basket of six major currencies last Friday as the market sentiment were lifted by higher hopes for a US tax reforms. The dollar index was quoted up 0.61% to 93.57 during late trade, its largest daily gain since October 2nd.
Tax reforms proposed by the US President Donald Trump has cleared a critical hurdle on Thursday after Senate Republicans adopted a budget blueprint for the next fiscal year and included a procedure for Republicans to rewrite the tax code without support from the Democratic party.
The reform is expected to boost up inflation, catalyzing more pressure on the US Federal Reserve to raise interest rates gradually. However, gains on the greenback were limited as the Republicans has yet to produce a tax reform bill amid divisions over how the cut will be financed.
In the economic data front, National Association of Realtors shows that Existing Home Sales for last month rose by 0.7% to a seasonally adjusted annual rate of 5.39 million units, beating economist forecast for a 1% decline to 5.30 million units. Recent upbeat economic data has erased some bearish sentiment on the greenback due to prior sluggish inflation data which were deemed to be non-transitory by some members of Federal Reserve.
U.S. Baker Hughes Oil Rig Count
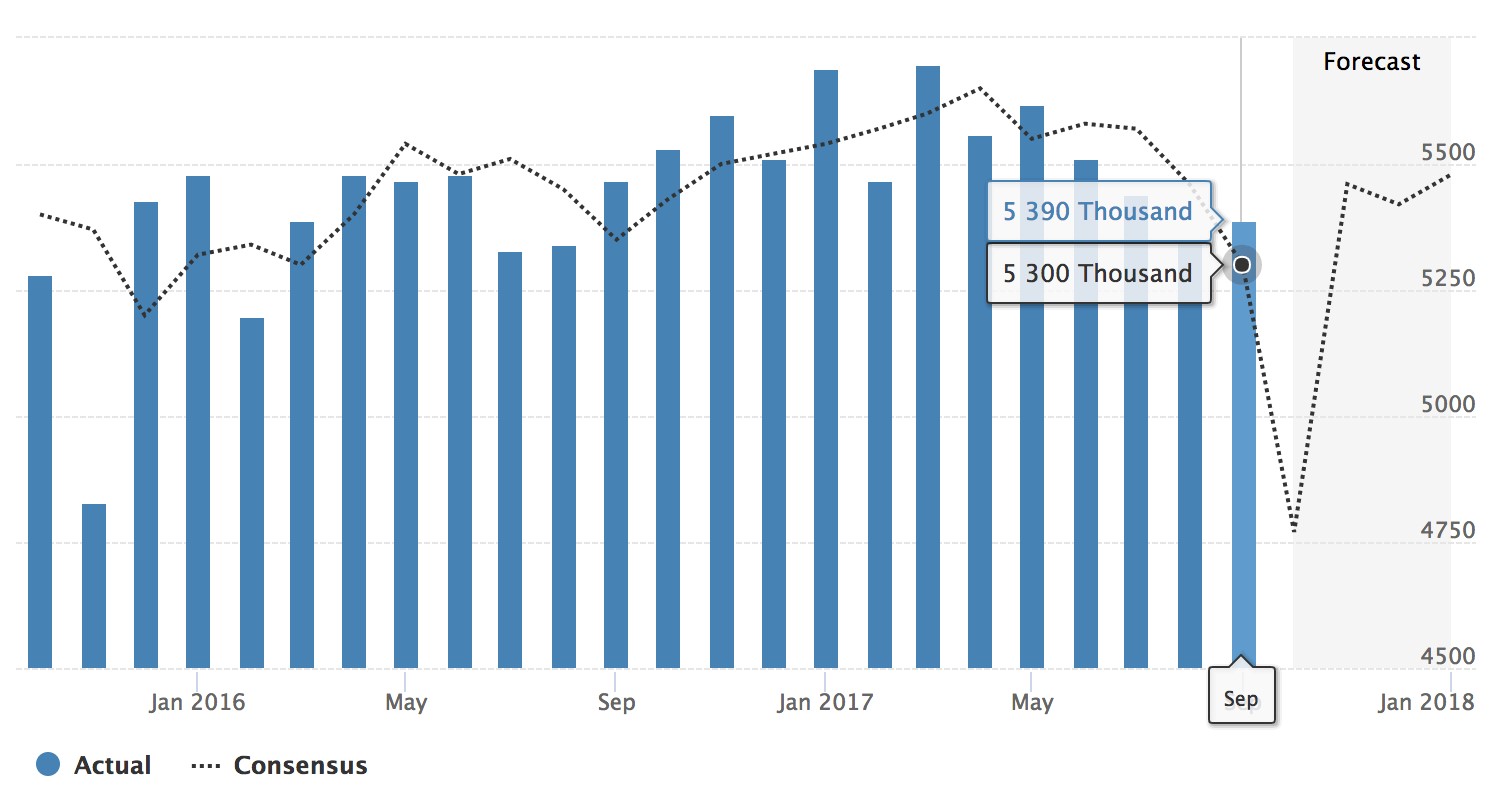
—– Forecast
US Existing Home Sales for the month of October came in with 5.39 million units, beating consensus forecast for a decline to 5.30 million units.
USD/JPY
Dollar rose to three-months high against the safe haven yen, with pairing of USD/JPY up 0.88% to 113.52.
EUR/USD
Euro was broadly lower, shedding 0.57% to $1.1784 against the US dollar.
GBP/USD
Pound sterling rose by 0.21% to $1.3185 against the greenback during late Friday trading. Sterling pared some of its prior losses after German Chancellor Angela Merkel said that the Brexit talks is progressing, refuting prior reports which indicate otherwise.
Market Review (Commodities): October 16 – 20
GOLD
Gold prices extended its losses on Friday, pressured by strong greenback due to higher prospect towards US tax reform and better-than-expected housing sector data. Price of the yellow metal settled down 0.59% to $1,282.42 while recording a weekly loss of up to 1.86%.
US dollar received higher demand across the board after US Senate adopted next year’s budget blueprint which will open the doors for an imminent US tax reform. Likewise, a higher sentiment towards an interest rate hike in the future has added further pressure on the gold price as higher rates environment will lift the opportunity cost for holding non-yielding asset.
Crude Oil
Crude oil price settled higher on Friday as political tension in the Kurdish region of Iraq escalates and may pose a threat to its crude supplies. Oil prices settled up 33 cents or around 0.6% to $51.84 while cashing in weekly gain of 0.8%.
Oil exports from the Iraqi’s Kurdish region towards the Turkish port of Ceyhan flows at an average rate of 216,000 barrels per day, versus prior level of 600,000 bpd. The disruption was ignited following Kurdish referendum to announce its independence from Iraq which has sparked regional conflict between respective forces.
On the other hand, oil prices were further supported after US drilling activity fell for third week in a row, extending its two-months decline. According to the oilfield services firm Baker Hughes, US drilling rigs fell by 7 to a total of 736, its lowest level since June.
In the OPEC front, secretary general from the cartel, Mohammad Barkindo postulate that the oil market is in the reign of balancing with “accelerated pace” and demand will continue to grow rapidly in the coming decades. However, analysts warned that OPEC will need to extend their production freeze agreement in order to yield a significant impact in reducing global supply glut.
U.S. Baker Hughes Oil Rig Count
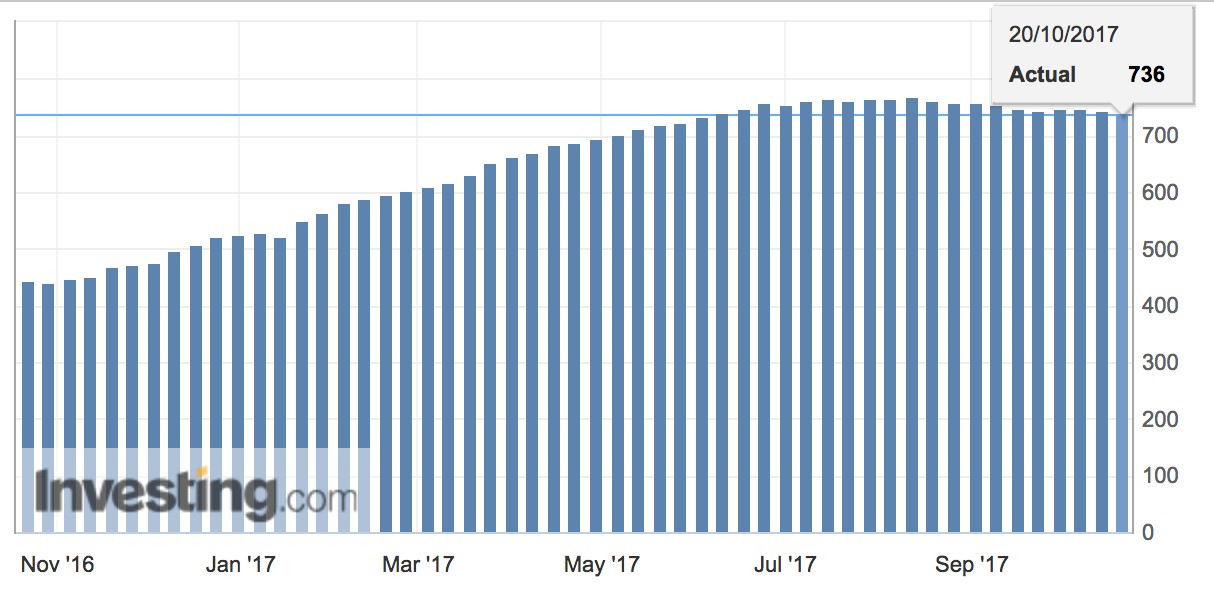
Active drilling rigs in the United States was down by 7 and the total count is currently at 736.
Weekly Outlook: October 23 – 27
For the week ahead, investors will keep an eye on European Central Bank’s meeting for further details on their plan to scale back its massive stimulus program. Likewise, market participants will also place their focus on US preliminary revision of third quarter growth in order to assess the impact of recent hurricanes on their economic activity and Federal Reserve’s view on monetary policy.
As for oil traders, they will be eyeing on US inventories level reported by API and EIA to gauge the strength of crude demand for world’s largest oil consumer.
Highlighted economy data and events for the week: October 23 – 27
| Monday, October 23 |
Data GBP – CBI Industrial Trends Orders (Oct) CAD – Wholesale Sales (MoM) (Aug)
Events N/A
|
| Tuesday, October 24 |
Data EUR – German Manufacturing PMI (Oct) EUR – Manufacturing PMI (Oct) EUR – Markit Composite PMI (Oct) EUR – Services PMI (Oct) USD – Manufacturing PMI (Oct) USD – Markit Composite PMI (Oct) USD – Services PMI (Oct)
Events N/A
|
| Wednesday, October 25 |
Data CrudeOIL – API Weekly Crude Oil Stock AUD – CPI (QoQ) (Q3) EUR – German Ifo Business Climate Index (Oct) GBP – GDP (QoQ) (Q3) USD – Core Durable Goods Orders (MoM) (Sep) USD – New Home Sales (Sep) CAD – BoC Interest Rate Decision CrudeOIL – Crude Oil Inventories
Events CAD – BoC Monetary Policy Report CAD – BoC Rate Statement CAD – BoC Gov Poloz Speaks
|
| Thursday, October 26 |
Data NZD – Trade Balance (MoM) (Sep) EUR – Deposit Facility Rate EUR – ECB Interest Rate Decision (Oct) USD – Initial Jobless Claims USD – Pending Home Sales (MoM) (Sep)
Events EUR – ECB Press Conference USD – FOMC Member Kashkari Speaks
|
|
Friday, October 27
|
Data JPY – National Core CPI (YoY) (Sep) JPY – Tokyo Core CPI (YoY) (Oct) USD – GDP (QoQ) (Q3) USD – Real Consumer Spending (Q3) USD – Michigan Consumer Sentiment (Oct) CrudeOIL – US Baker Hughes Oil Rig Count
Events N/A
|
Technical weekly outlook: October 23 – 27
Dollar Index
DOLLAR_INDX, Daily: Dollar index remained supported following prior rebound near the 60-MA line (green). Both MA lines which continues to expand upwards suggests dollar index to advance further up and retest at the strong resistance level of 93.95.
Resistance level: 93.95, 95.80
Support level: 92.50, 90.95
GBPUSD
GBPUSD, Daily: GBPUSD was traded higher following prior rebound near the 60-MA line (green). MACD histogram which illustrate diminishing downward signal suggests the pair to advance further upwards after successfully closing above the 20-MA line (red).
Resistance level: 1.3260, 1.3450
Support level: 1.3020, 1.2820
USDJPY
USDJPY, Daily: USDJPY skyrocketed following prior breakout from the strong resistance level of 113.00. MACD histogram which forms a golden cross suggest the pair to advance further up and retest near the strong resistance level of 114.30.
Resistance level: 114.30, 115.15
Support level: 113.00, 111.65
EURUSD
EURUSD, Daily: EURUSD remained under pressure following prior retracement from the strong resistance level of 1.1860. Recent closure below the 20-MA line (red) suggest further downside bias for the pair to fallback towards the strong support level near 1.1700.
Resistance level: 1.1860, 1.2090
Support level: 1.1700, 1.1450
GOLD
GOLD_, Daily: Gold price extended its losses following prior closure below the support level of 1281.00 and both MA lines. MACD histogram which begins to form a death cross signal suggest further bearish momentum for the commodity and advance towards the target of support level near 1263.00.
Resistance level: 1281.00, 1299.05
Support level: 1263.00, 1237.35
Crude Oil
CrudeOIL, Daily: Crude oil price remains traded within a rising wedge while recently rebounded from the 20-MA line (red). A successful closure above the strong resistance level of 52.40 would suggest further upside bias ahead, towards the upper level of the wedge.
Resistance level: 52.40, 53.90
Support level: 50.20, 48.65
201017 Daily Analysis
20 October 2017 Daily Analysis
Dollar high on tax reform while Catalonia sinks EU.
US dollar received bullish support across the board on Friday after news hit the wires that US Senate has passed the 2018 budget blueprint which will open doors for Republican tax reform effort. The dollar index was quoted up 0.26% to 93.33. The passage which saw a 51-49 vote to pass the budget is one of the first steps taken to inch closer towards legalizing the bill which will allow tax cuts up to $1.5 trillion for the next decade. Overall higher optimism sparked by the news has further supported the US Treasury which was seen with a steeper yield curve of up to 79 basis points. Likewise, overnight duo of upbeat economic data which compromises of jobless claims in Philly Fed Manufacturing Index were also seen to support the further upside of greenback. On the other hand, EUR/USD extended its losses by 0.35% to $1.1810 amid higher geopolitical risk in the region. The central government of Spain postulate on Thursday that they will suspend Catalonia’s autonomy and impose direct rule after the region’s leader Carles Puigdemont threatens to push for formal independence declaration if official talks were refused.
In the commodities front, crude oil price was narrowly mixed in Asia after adding up 0.14% to $51.36 as investors look ahead to OPEC’s meeting today for an update on the progress of production cuts and possible hints of extending the agreement. As for gold, price of the yellow metal shed 0.48% to $1,283.52 amid higher demand for the greenback this morning.
Today’s Holiday Market Close
Time Market Event
N/A
Today’s Highlight Events
Time Market Event
02:00 (Sat) USD FOMC Member Mester Speaks
07:30 (Sat) USD Fed Chair Yellen Speaks
Today’s Highlight Economy Data
| Time | Nation & Data | Previous | Forecast | Actual |
| 16:30 | GBP – Public Sector Net Borrowing (Sep) | 5.09B | 5.70B | – |
| 20:30 | CAD – Core CPI (MoM) (Sep) | 0.0% | – | – |
| 20:30 | CAD – Core Retail Sales (MoM) (Aug) | 0.2% | 0.3% | – |
| 22:00 | USD – Existing Home Sales (Sep) | 5.35M | 5.30M | – |
| 01:00 | CrudeOIL – US Baker Hughes Oil Rig Count | 743 | – | – |
GBPUSD
GBPUSD, H1: GBPUSD was traded lower prior breaking support level at 1.3140. Successful closure below the said support level and downslope of MACD signal line suggest GBPUSD to extend its losses toward the next support level at 1.3065.
Resistance level: 1.3140, 1.3220
Support level: 1.3065, 1.3020
EURUSD
EURUSD, H1: EURUSD was traded lower after breaking support level at 1.1825. Successful closure of candlestick below the said support level and increasing bearish MACD histogram suggest the pair to extend losses toward support by 200-MA line.
Resistance level: 1.1870, 1.1905
Support level: 1.1785, 1.1735
USDJPY
USDJPY, H4: USDJPY was traded higher after breaking resistance level at 113.00. The pair is currently testing the next resistance level at 113.15. Golden-cross as formed by MACD signal line suggest the pair to trade higher if breakout of the said resistance level is successful.
Resistance level: 113.15, 113.55
Support level: 112.50, 112.00
CrudeOIL
CrudeOIL, H4: Crude oil price was traded lower after breaking below support level at 51.65. Increasing bearish momentum as shown by MACD histogram suggest crude oil price to extend its losses toward the next support level at 51.25.
Resistance level: 51.65, 52.50
Support level: 51.25, 50.80
GOLD
GOLD_, H1: Gold price was traded lower prior retracement from resistance level at 1291.00 and resistance by 200-MA line. Formation of death-cross by MACD signal line suggests gold price to undergo short-term technical correction to trade lower toward the support level at 1283.45.
Resistance level: 1291.00, 1297.60
Support level: 1283.45, 1278.40
191017 Daily Analysis
19 October 2017 Daily Analysis
Greenback loses its support, Fed’s Beige Book in focus.
Dollar index was traded lower against a trade-weighted basket of major currencies at 93.14 as of writing after falling 0.05% amid weaker-than-expected housing data from overnight. According to data released by the Commerce Department, U.S. homebuilding fell 4.7% versus the expected 0.5% reduction to a seasonally adjusted annual rate of 1.127 million units in September. In addition, building permits data shown a sharp 4.5% slump to a rate of 1.215 million units and it was below estimates of a fall to 1.245 million units. However, losses of the Greenback was limited as it was being capped by gains in U.S. treasury yields on speculation over the next Fed chair to adopt a more hawkish stance on monetary policy in the future. Meanwhile, investors are awaiting release of Federal Reserve’s Beige Book, a report on economic and inflationary conditions across the twelve Federal Reserve districts. On the other hand, AUD/USD edged higher by 0.03% at 0.7848 ahead of China GDP data and other key economic data. In China, its GDP data is expected to show an increase of 1.7% quarterly and 6.8% yearly. Other data such as industrial production in September is expected to show a 6.2% gains and retail sales is expected to increase by 10.2%.
In the commodity market, crude oil price remained firm with gains of 0.13% at $52.11 per barrel, supported by ongoing supply restriction by OPEC, tensions in the Middle East and reduced production in the United States after incidence of hurricane-enforced closures. Likewise, gold prices remained flat at $1281.58 a troy ounce after a small increment of 0.13% while investors shifting their near-term focus toward Fed’s Beige Book which directly reflect the economic and inflationary conditions in U.S.
Today’s Holiday Market Close
Time Market Event
N/A
Today’s Highlight Events
Time Market Event
21:30 USD FOMC Member George Speaks
Today’s Highlight Economy Data
| Time | Nation & Data | Previous | Forecast | Actual |
| 08:30 | AUD – Employment Change (Sep) | 54.2K | 15.0K | 19.8K |
| 10:00 | CNY – GDP (YoY) (Q3) | 6.9% | 6.8% | – |
| 10:00 | CNY – Industrial Production (YoY) (Sep) | 6.0% | 6.2% | – |
| 16:30 | GBP – Retail Sales (MoM) (Sep) | 1.0% | -0.2% | – |
| 20:30 | USD – Initial Jobless Claims | 243K | 240K | – |
| 20:30 | USD – Philadelphia Fed Manufacturing Index (Oct) | 23.8 | 22.0 | – |
GBPUSD
GBPUSD, H1: GBPUSD was traded higher prior breaking above resistance level at 1.3190 and resistance by 200-MA line. Golden-cross as formed by MACD signal line suggest the pair to continue its momentum to trade higher toward the next resistance level at 1.3220.
Resistance level: 1.3220, 1.3255
Support level: 1.3190, 1.3150
EURUSD
EURUSD, H1: EURUSD was traded higher prior breaking above resistance by 200-MA line. Widening of MACD signal lines suggest increasing bullish momentum for the pair to trade higher toward the resistance level at 1.1815.
Resistance level: 1.1815, 1.1870
Support level: 1.1785, 1.1735
USDJPY
USDJPY, H1: USDJPY was traded lower prior breaking below support level at 113.00. Death-cross as formed by MACD signal line suggest short-term technical correction for the pair to trade lower toward the next support level at 112.75.
Resistance level: 113.15, 113.00
Support level: 112.75, 112.50
CrudeOIL
CrudeOIL, H4: Crude oil price was traded in consolidation between resistance level at 52.50 and support level at 51.65. It is suggested to wait for breakout to occur for a clearer sign of trend.
Resistance level: 52.50, 53.70
Support level: 51.65, 51.25
GOLD
GOLD_, H1: Gold price was traded higher prior its rebound from support level at 1278.35. Formation of pin bar and positive divergence by MACD signal line suggest the pair to undergo short-term technical correction toward the resistance level at 1283.40.
Resistance level: 1283.40, 1290.20
Support level: 1278.35, 1268.55
181017 Daily Analysis
18 October 2017 Daily Analysis
Fed Chair to-be more hawkish, Greenback on its support.
Dollar index was traded higher against a basket of major currencies, last quoted up 0.124% to 93.36. The gains in the Greenback are buoyed by economic data that topped expectations indicating the underlying strength in the U.S. economy. According to statement by Labor Department, U.S. import prices recorded the largest gain with a 0.7% increase for the month of September versus the expected 0.5% increase. In addition, recovery of construction and utilities production after the impact of Hurricanes Harvey and Irma last month boasted the U.S. industrial output and manufacturing production to rise 0.3% and 0.1% respectively. The increase in Greenback was further catalyzed following a report that President Donald Trump favored John Taylor, one of the more hawkish candidates as the next Fed chair. Release of the news has further spiked up investors’ expectation toward Fed to take more aggressive stance on monetary policy. On the other hand, EUR/USD decreased by 0.32% following failure of German ZEW index showing an increase to 17.6 but missed the expected 20.0.
In the commodity market, crude oil price extend its gains by 0.40% to $52.09 per barrel after American Petroleum Institute (API) stated that crude oil inventories reduced by 7.130 million barrels versus the expected decrease by 3.097 million barrels. Otherwise, gold price fell by 1.18% to $1286.72 a troy ounce overnight following a sharp rise in the Greenback on better-than-expected economic data and growing speculation of investors toward the next head of the Federal Reserve to be more hawkish on monetary policy.
Today’s Holiday Market Close
Time Market Event
N/A
Today’s Highlight Events
Time Market Event
16:10 EUR ECB President Draghi Speaks
20:00 USD FOMC Member Dudley Speaks
20:00 USD FOMC Member Kaplan Speaks
Today’s Highlight Economy Data
| Time | Nation & Data | Previous | Forecast | Actual |
| 08:30 | AUD – NAB Quarterly Business Confidence | 7 | – | – |
| 16:30 | GBP – Average Earnings Index + Bonus (Aug) | 2.1% | 2.1% | – |
| 16:30 | GBP – Claimant Count Change (Sep) | -2.8K | 1.0K | – |
| 20:30 | USD – Building Permits (Sep) | 1.300M | 1.245M | – |
| 20:30 | USD – Housing Starts (MoM) (Sep) | -0.8% | -0.5% | – |
| 20:30 | CAD – Manufacturing Sales (MoM) (Aug) | -2.6% | -0.3% | – |
| 22:30 | CrudeOIL – Crude Oil Inventories | -2.747M | -1.991M | – |
GBPUSD
GBPUSD, H1: GBPUSD was traded higher prior its rebound from support level at 1.3150. Formation of pin bar and golden-cross by MACD signal line suggest the pair to trade higher. However, a break above resistance by 200-MA line is required for the pair to extend its gain toward the resistance level at 1.3220.
Resistance level: 1.3220, 1.3300
Support level: 1.3150, 1.3020
EURUSD
EURUSD, H1: EURUSD was traded higher prior its rebound from support level at 1.1735. Formation of pin bar and positive divergence as shown by MACD signal line suggest the pair to continue its momentum to trade higher toward resistance by 200-MA line.
Resistance level: 1.1815, 1.1870
Support level: 1.1735, 1.1680
USDJPY
USDJPY, H1: USDJPY was traded lower prior its failure to break above resistance level at 112.35 and resistance by 200-MA line. Arrangement of bearish candlesticks and formation of negative divergence as shown by MACD histogram suggest the pair to extend its losses toward support level at 112.00.
Resistance level: 112.35, 112.70
Support level: 112.00, 111.65
CrudeOIL
CrudeOIL, H4: Crude oil price was traded higher prior its rebound from support level at 51.65. A breakout above resistance level at 52.40 is required for crude oil price to continue its momentum to trade higher toward the next resistance level at 53.00.
Resistance level: 52.40, 53.00
Support level: 51.65, 51.35
GOLD
GOLD_, H1: Gold price was traded higher prior its rebound from support level at 1283.40. Formation of pin bar and golden-cross by MACD signal line suggest gold price to trade higher, testing the resistance by 200-MA line.
Resistance level: 1290.20, 1297.60
Support level: 1283.40, 1278.35
171017 Daily Analysis
17 October 2017 Daily Analysis
Greenback’s bull on fire, Aussie fell after RBA meetings.
Dollar index was traded higher against a trade-weighted basket of major currencies, quoted up 0.24% to 93.14 on the back of upbeat manufacturing data. The Empire State manufacturing index rose to 30.2 in October, after reaching 24.4 last month. However, gains of the Greenback remained capped despite the positive outlook on manufacturing data due to investors’ concerns over disinflation following Friday’s inflation report. Beforehand, Fed Chair Janet Yellen has made reaffirmation that the Federal Reserve shall commit to increase its benchmark rates in December this year. She mentioned that U.S. economy remained resilient and that the positive labor market data suggested Fed to increase interest rates gradually. On the other hand, AUD/USD fell to its session low of 0.7838 following Reserve Bank of Australia (RBA) meeting minutes that shows policy makers see no reason to follow global rate hikes while reiterating that the change in interest rate should depend on local economic conditions and rate hikes abroad did not have much ”mechanical” implication for Australian rates.
In the commodity market, crude oil price settled lower by 0.21% to $51.76 per barrel after United States issued a permit to expand Enbridge cross-border oil pipeline, allowing the company to nearly double crude oil supply capacity to ship from 450,000 barrels per day (bpd) to 890,000 bpd. Likewise, gold price sheds 0.52% to $1293.11 a troy ounce following a surge in the Greenback amid optimistic manufacturing data and market sentiment toward Fed to increase interest rates for the third time in December.
Today’s Holiday Market Close
Time Market Event
N/A
Today’s Highlight Events
Time Market Event
08:30 AUD RBA Meeting Minutes
18:15 GBP BoE Gov Carney Speaks
01:00 USD FOMC Member Harker Speaks
Today’s Highlight Economy Data
| Time | Nation & Data | Previous | Forecast | Actual |
| 05:45 | NZD – CPI (QoQ) (Q3) | 0.0% | 0.4% | 0.5% |
| 16:30 | GBP – CPI (YoY) (Sep) | 2.9% | 3.0% | – |
| 17:00 | EUR – German ZEW Economic Sentiment (Oct) | 31.7 | 34.2 | – |
| 18:00 | EUR – CPI (YoY) (Sep) | 1.5% | 1.5% | – |
| 20:30 | USD – Import Price Index (MoM) (Sep) | 0.6% | 0.6% | – |
| 21:45 | USD – Industrial Production (MoM) (Sep) | -0.9% | 0.2% | – |
| 04:30 | CrudeOIL – API Weekly Crude Oil Stock | 3.097M | – | – |
GBPUSD
GBPUSD, H1: GBPUSD was traded higher prior its rebound from support level at 1.3225. The pair is currently traded within descending triangle suggesting a breakout is needed to determine its price movement in the nearer term.
Resistance level: 1.3280, 1.3330
Support level: 1.3225, 1.3175
EURUSD
EURUSD, H4: EURUSD was traded lower prior its retracement from resistance by 200-MA line. The pair is currently testing the support level at 1.1780. Successful closure below the said support level would suggest the pair to continue its losses toward the next support level at 1.1740.
Resistance level: 1.1880, 1.1990
Support level: 1.1780, 1.1740
USDJPY
USDJPY, H4: USDJPY was traded higher prior its rebound from support level at 111.65. Formation of bullish engulfing candlestick and golden-cross by MACD signal line suggest the pair to trade higher toward the resistance level at 112.35.
Resistance level: 112.35, 113.00
Support level: 111.65, 108.90
CrudeOIL
CrudeOIL, H4: Crude oil price was traded lower prior its retracement from resistance level at 52.40. Formation of bearish engulfing candlestick and negative divergence as shown by MACD histogram suggest crude oil price to extend its losses toward the support level at 51.75.
Resistance level: 52.40, 53.00
Support level: 51.75, 51.35
GOLD
GOLD_, H1: Gold price was traded higher prior its rebound from support level at 1290.20. Formation of pin bar and upward slope of MACD histogram suggest gold price to undergo short-term technical correction to trade higher toward the resistance level at 1297.60.
Resistance level: 1297.60, 1300.70
Support level: 1290.20, 1283.45
161017 Weekly Analysis
16 October 2017 Weekly Analysis
GCMAsia Weekly Report: October 16 – 20
Market Review (Forex): October 9 – 13
U.S. Dollar
Greenback ended mixed during last Friday following mixed inflationary data which has further cloud investors outlook for another rate hike by the Federal Reserve in December. The dollar index was last quoted around 93.62 during late trading after recovering from two-weeks low of 92.59.
For the month of August, consumer prices came in with a positive reading of 0.5%, its largest increase within eight months but missing expected forecast of 0.6%. The data was well supported by rising gasoline prices after hurricanes hit the southern coast of US. In spite of that, overall core inflation remained subdued with only 0.1% versus 0.2% seen, showing a still-sluggish inflationary pressure as commented by some Federal Reserve members in the September’s meeting minutes.
In terms of consumer spending, core retail sales which excludes purchases of automobiles came in with 1.0%, signaling a persistent pickup while recording its largest increase in more than 7 months. Although the pickup in spending remains optimistic, it has pose a major question to the Fed with its diminished inflationary pressure that are not supported by the prior; thus, exerting to monitor further economic data before initiating any changes to the monetary policy. According to the Fed Rate Monitor Tool, market probability for a rate hike in December retreats from 87.8% to 82.7% following the release of the data.
US Core Consumer Price Index
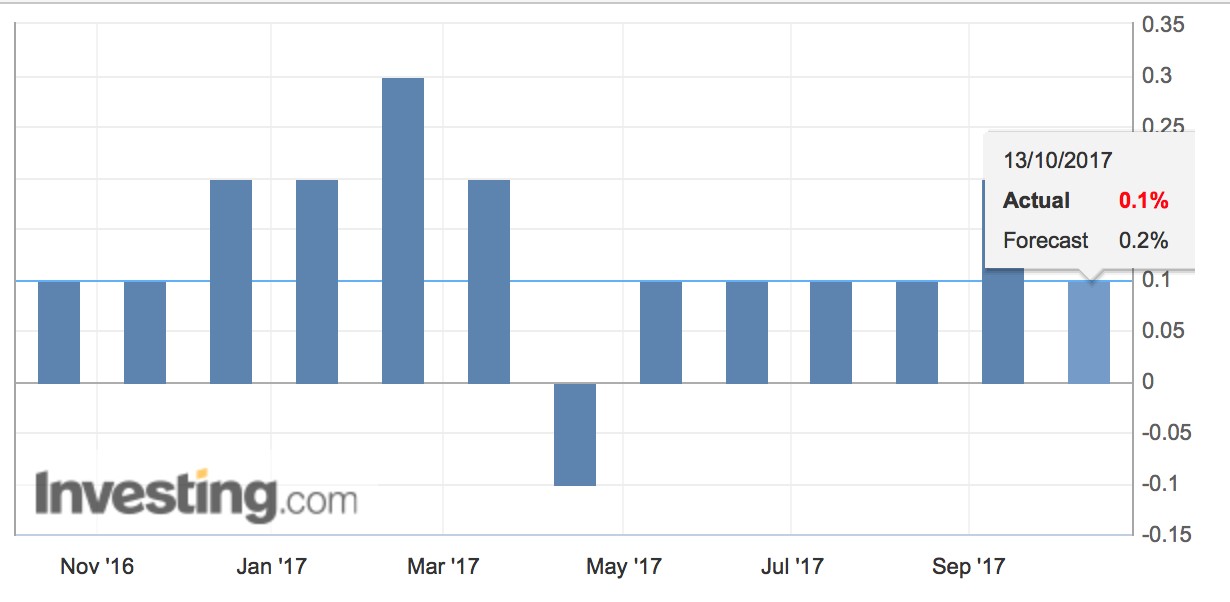
US Core Consumer Price Index which excludes food and energy came in at only 0.1% versus forecast of 0.2%.
US Retail Sales Ex. Automobiles (Core)
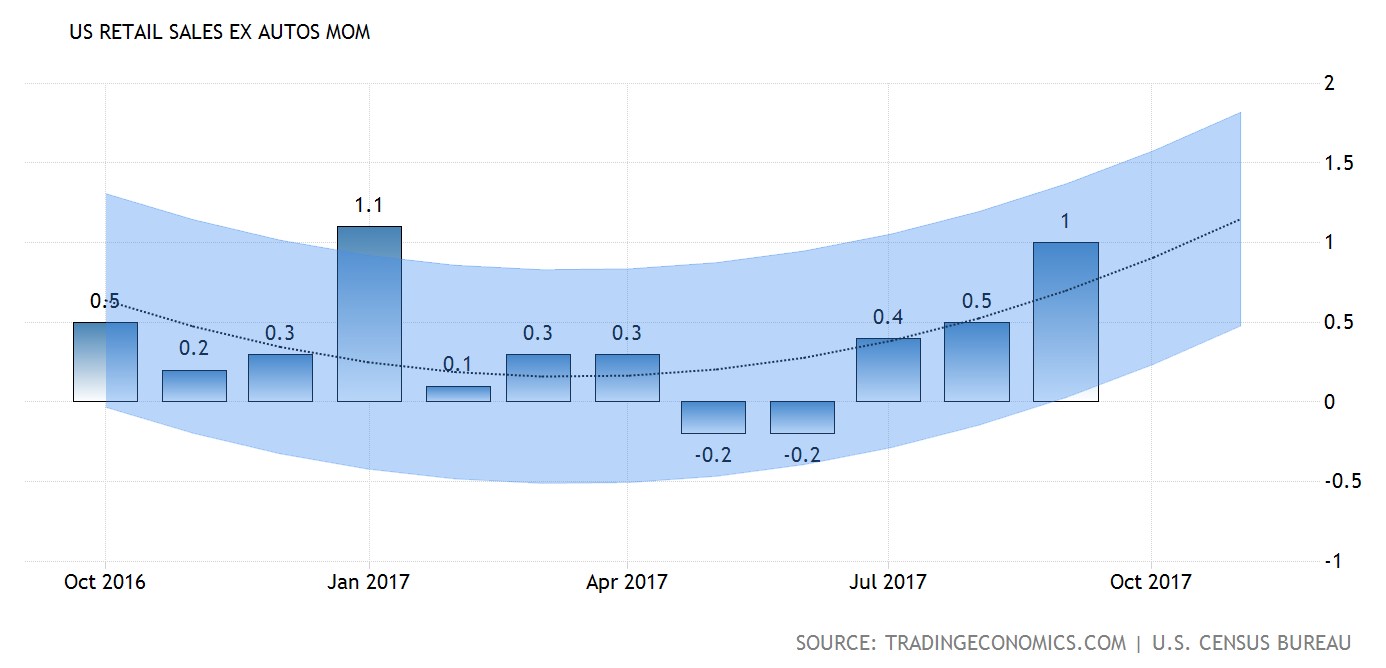
—– Forecast
US Core Retail Sales which excludes automobiles came in around 1.0%, its largest gain in seven months.
Fed Rate Monitor Tool
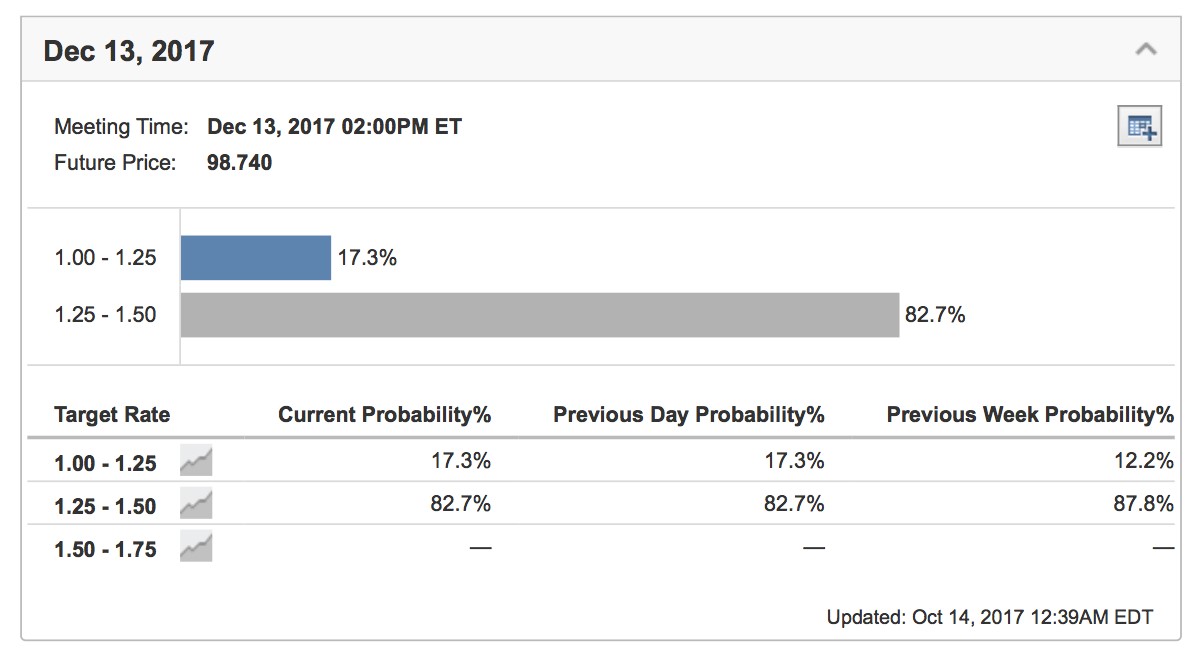
US Fed Rate Monitor Tool shows diminished probability for a rate hike in December from 87.8% to 82.7%.
USD/JPY
Dollar ended lower against the safe-haven Yen, down 0.43% to 111.80.
EUR/USD
Euro dipped to a session low of $1.1822 against the greenback after European Central Bank President Mario Draghi said that the euro zone still requires substantial monetary stimulus as inflation remains subdued.
GBP/USD
Sterling gained amid higher hopes that Britain could be offered a two-year transition to divorce from the EU economic bloc. GBP/USD rose 0.20% to $1.3287 while ended the week with 1.70% gain.
Market Review (Commodities): October 9 – 13
GOLD
Safe haven asset gold gained some demand on Friday following the release of mixed US inflation data which has added doubts over Federal Reserve’s ability to raise interest rates one more time before the year-end. Price of the yellow metal spikes up by 0.69% while ended the week with 2.03% gains at $1,305.40.
The data was in line with Federal Reserve’s September meeting minutes which highlighted that recent sluggishness in inflationary pressure may not be transitory. A lower expectation towards rate hike by year end will lift investors prospect towards bullion as higher rates environment could lift the opportunity cost for holding the asset which is non-yielding.
Crude Oil
Crude oil price settled higher on Friday as geopolitical uncertainty in the Middle East raised higher possibility for a supply disruption to occur. Its prices settled up 85 cents or 1.70% to a two-weeks high of $51.45 a barrel, its best close since October 2nd. For the week, its prices have gained around 4.4%, its largest within a month.
Within economist expectation, US President Donald Trump on Friday decided to go against certifying the 2015 Iran nuclear agreement, raising the risk of doing business in the oil-rich Middle Eastern nation whom are also a member of OPEC. Meanwhile, the ongoing unrest in Iraq following an independence referendum in Iraq’s Kurdistan region last month has raised domestic threats to disrupt the operation of pipeline in the region that carries around 500,000 – 600,000 barrels of crude per day.
Moreover, its prices were further supported after China’s import blow past economist expectation in September and expands at a healthy pace despite widespread speculation for an eventual and gradual slowdown. Furthermore, overall bullish sentiment was further catalyzed as US crude stockpiles falls for its third consecutive week in a row due to strong domestic demand.
Despite multiple bullish signal in the market, analyst warned that the OPEC may need to extend its agreement beyond March 2018 expiry date in order to yield significant results in rebalancing global oil supply and demand. The original deal which were stuck nearly a year ago failed to portray an eventual sign of supply reduction as non-participating nations such as Libya, Nigeria and United States continues to ramp up their daily crude production.
Weekly Outlook: October 16 – 20
For the week ahead, investors will be focusing on US housing sector data to assess the economic impact of hurricanes which has struck its southern region last month. Otherwise, inflation report from the UK will be kept in view amid higher chances for an interest rate hike by the Bank of England due to soaring inflation.
In the Canadian region, Friday’s release of inflation data would also be scrutinized by market participants to gauge the timing of next interest rate hike by the Bank of Canada.
As for oil traders, they will be eyeing on US inventories level reported by API and EIA to gauge the strength of crude demand for world’s largest oil consumer.
Highlighted economy data and events for the week: October 16 – 20
| Monday, October 16 |
Data CNY – CPI (YoY) (Sep) CNY – PPI (YoY) (Sep) EUR – Trade Balance (Aug) USD – NY Empire State Manufacturing Index (Oct) USD – Federal Budget Balance (Sep)
Events N/A
|
| Tuesday, October 17 |
Data NZD – CPI (QoQ) (Q3) GBP – CPI (YoY) (Sep) EUR – German ZEW Economic Sentiment (Oct) EUR – CPI (YoY) (Sep) USD – Import Price Index (MoM) (Sep) USD – Industrial Production (MoM) (Sep)
Events AUD – RBA Meeting Minutes GBP – BoE Gov Carney Speaks USD – FOMC Member Harker Speaks
|
| Wednesday, October 18 |
Data CrudeOIL – API Weekly Crude Oil Stock AUD – NAB Quarterly Business Confidence GBP – Average Earnings Index +Bonus (Aug) GBP – Claimant Count Change (Sep) USD – Building Permits (Sep) USD – Housing Starts (MoM) (Sep) CAD – Manufacturing Sales (MoM) (Aug) CrudeOIL – Crude Oil Inventories
Events EUR – ECB President Draghi Speaks USD – FOMC Member Dudley Speaks USD – FOMC Member Kaplan Speaks
|
| Thursday, October 19 |
Data AUD – Employment Change (Sep) CNY – GDP (YoY) (Q3) CNY – Industrial Production (YoY) (Sep) GBP – Retail Sales (MoM) (Sep) USD – Initial Jobless Claims USD – Philadelphia Fed Manufacturing Index (Oct)
Events USD – FOMC Member George Speaks
|
|
Friday, October 20
|
Data GBP – Public Sector Net Borrowing (Sep) CAD – Core CPI (MoM) (Sep) CAD – Core Retail Sales (MoM) (Sep) USD – Existing Home Sales (Sep) CrudeOIL – US Baker Hughes Oil Rig Count
Events USD – FOMC Member Mester Speaks
|
Technical weekly outlook: October 16 – 20
Dollar Index
DOLLAR_INDX, Daily: Dollar index pared some losses following prior rebound from the support level of 92.45 while closing above the 20-MA line (red). Recent formation of golden cross by both MA lines suggests further upside bias for the index. Thus, a rebound near the 20-MA line would suggest the dollar index to extend its gains towards the recent resistance at 93.95.
Resistance level: 93.95, 95.85
Support level: 92.45, 90.95
GBPUSD
GBPUSD, Daily: GBPUSD was traded higher following prior rebound near the support level of 1.3020 while currently testing at the 20-MA line (red). MACD histogram which shows diminishing downward signal and imminent formation of golden cross suggests the pair to advance further upwards after successfully closing above the 20-MA line (red).
Resistance level: 1.3450, 1.3655
Support level: 1.3260, 1.3020
USDJPY
USDJPY, Daily: USDJPY pared some losses following a rebound from the strong support level at 111.65. Such price action suggests further bullish bias for the pair to extend its upward momentum towards the first target at 20-MA line (red) followed by the resistance level at 112.85.
Resistance level: 112.85, 114.35
Support level: 111.65, 110.85
EURUSD
EURUSD, Daily: EURUSD was traded lower following prior retracement from the resistance level of 1.1865. Current bearish bias suggests the pair to extend its losses towards the next target at 1.1680 after a successful closure below the 20-MA line (red).
Resistance level: 1.1865, 1.2090
Support level: 1.1680, 1.1425
GOLD
GOLD_, Daily: Gold price extended its gains following prior rebound from the support level of 1263.00 while recently closed above 60-MA line (green). Signal line from MACD histogram which continues to expand upwards suggest the commodity price to advance further upwards towards the next target at 1321.35.
Resistance level: 1321.35, 1342.00
Support level: 1299.05, 1281.00
Crude Oil
CrudeOIL, Daily: Crude oil price remained traded within a rising wedge while recently opened lower near the resistance level of 52.40. A retracement from this level would suggest short-term downside bias for the commodity price to advance towards the first target at 50.20.
Resistance level: 52.40, 53.90
Support level: 50.20, 48.65
131017 Daily Analysis
13 October 2017 Daily Analysis
Greenback retraces amid release of economics data.
Dollar index was traded lower against a trade-weighted basket of major currencies, quoted down 0.05% to 92.74 while investors await tonight’s release of Consumer Price Index for further signal on next interest rate hike. Overnight, greenback extended some gains after U.S. Department of Labor reported a decrease in initial jobless claims by 15,000 to a seasonally adjusted total of 258,000 last week, versus forecasts of only 7,000 decline. In addition, producer price index (PPI) in September shown an increase of 0.4% in which has ease some investors’ concern over the slowdown in inflation amid dovish FOMC meeting minutes. On the other hand, pound sterling rose by 0.12% to $1.3278 against the US dollar following overnight’s plunge due to Brexit uncertainties. According to EU Brexit negotiator Michel Barnier, recent negotiation has reached an impasses while ruling out discussion on future trade with the UK for the time being. Recent stumbled progress has spurred higher uncertainty over UK’s economy in the future which may lose its access to the single economy bloc.
In the commodity market, crude oil price increased by 0.51% to $50.86 a barrel as it is supported by China trade data which mirrored rising demand views as the market looks ahead to a U.S. oil rig count data. Likewise, gold price extended gains by 0.26% to $1296.62 a troy ounce following a suspected nuclear test in North Korea after geology agency in the South reported a 2.7 magnitude earthquake this morning.
Today’s Holiday Market Close
Time Market Event
N/A
Today’s Highlight Events
Time Market Event
20:30 USD FOMC Member Rosengren Speaks
23:30 USD FOMC Member Kaplan Speaks
01:00 USD FOMC Member Powell Speaks
Today’s Highlight Economy Data
| Time | Nation & Data | Previous | Forecast | Actual |
| 11:00 | CNY – Trade Balance (USD) (Sep) | 41.99B | 39.50B | – |
| 14:00 | EUR – German CPI (MoM) (Sep) | 0.1% | 0.1% | – |
| 20:30 | USD – Core CPI (MoM) (Sep) | 0.2% | 0.2% | – |
| 20:30 | USD – Core Retail Sales (MoM) (Sep) | 0.2% | 0.3% | – |
| 20:30 | USD – Retail Sales (MoM) (Sep) | -0.2% | 1.7% | – |
| 22:00 | USD – Michigan Consumer Sentiment (Oct) | 95.1 | 95.0 | – |
| 01:00 | CrudeOIL – US Baker Hughes Oil Rig Count | 748 | – | – |
GBPUSD
GBPUSD, H4: GBPUSD was traded higher prior its breakout above resistance level at 1.3240 and resistance by 200-MA line. The successful breakout suggests GBPUSD to continue its momentum to trade higher toward the next resistance level at 1.3330.
Resistance level: 1.3330, 1.3445
Support level: 1.3240, 1.3175
EURUSD
EURUSD, H1: EURUSD was traded higher prior its rebound from support level at 1.1820. Upward slope of MACD histogram and bullish engulfing candlestick pattern suggest the pair to further its gains toward the resistance level at 1.1870.
Resistance level: 1.1870, 1.1910
Support level: 1.1820, 1.1775
USDJPY
USDJPY, H1: USDJPY was traded within descending triangle. It is suggested to wait for breakout to occur following absence of obvious signal from both price action and MACD indicator.
Resistance level: 112.60, 113.00
Support level: 112.10, 111.65
CrudeOIL
CrudeOIL, H4: Crude oil price was traded higher prior its failure to break below support level at 50.20. Formation of pin bar candlestick and golden-cross as formed by MACD signal line suggest the pair to trade higher if closure above resistance level at 50.80 is successful.
Resistance level: 50.80, 51.35
Support level: 50.20, 49.25
GOLD
GOLD_, H1: Gold price was traded in higher prior its rebound from the bullish trend line and support level at 1289.70. Formation of bullish pinbar candlestick and golden-cross of MACD signal line suggest gold price to trade higher toward the resistance level at 1297.60.
Resistance level: 1297.60, 1302.35
Support level: 1289.70, 1283.40
121017 Daily Analysis
12 October 2017 Daily Analysis
Greenback slumbered after Fed Minutes.
Dollar index was last quoted down 0.32% to 92.67 after Federal Reserve policymakers shown uncertainty regarding its rate hike later in December. A debate has been prolonged according to the last Fed policy meeting in September with regards to the prospects of recent sluggish inflation which could slow down the path of future rate hike. Also, an announcement is made by Fed that it would reduce its large bond portfolio starting this month following the financial crisis and unanimous vote to maintain steady interest rates. As such, Fed mentioned that they would decide future interest rate moves based on incoming inflation data over the next few months. Overnight, the latest Job Openings and Labor Turnover Survey (JOLTs) in August released by the U.S. Labor Department shown a decrease to 6.082M, below the expectations of 6.125M. On the other hand, Fed Rate Monitor Tool shown a positive market sentiment with nearly 90% of traders expect the Fed to increase interest rates in December as compared to only 80% in the previous week.
In the commodity market, crude oil price was down by 0.40% to trade at $51.08 per barrel following a gain in U.S. fuel inventories despite efforts by OPEC to restrict crude supplies. Otherwise, gold price was up by 0.52% to trade at $1292.53 a troy ounce following dovish U.S. data and absence of hawkish outlook by recent Fed minute meetings.
Today’s Holiday Market Close
Time Market Event
N/A
Today’s Highlight Events
Time Market Event
Tentative CrudeOIL IEA Monthly Report
22:30 USD FOMC Member Brainard Speaks
22:30 USD FOMC Member Powell Speaks
22:30 EUR ECB President Draghi Speaks
Today’s Highlight Economy Data
| Time | Nation & Data | Previous | Forecast | Actual |
| 17:00 | EUR – Industrial Production (MoM) (Aug) | 0.1% | 0.5% | – |
| 20:30 | USD – Initial Jobless Claims | 260K | 255K | – |
| 20:30 | USD – PPI (MoM) (Sep) | 0.2% | 0.4% | – |
| 20:30 | CAD – New Housing Price Index (MoM) (Aug) | 0.4% | 0.3% | – |
| 23:00 | CrudeOIL – Crude Oil Inventories | -6.023M | – | – |
GBPUSD
GBPUSD, H4: GBPUSD was traded higher prior its rebound from support level at 1.3175. The pair is currently testing resistance by 200-MA line and resistance level at 1.3240. Successful closure above the said resistance level will further suggest the pair to gain its momentum to trade higher toward the next resistance level at 1.3315.
Resistance level: 1.3315, 1.3330
Support level: 1.3175, 1.3025
EURUSD
EURUSD, H4: EURUSD was traded higher prior its breakout above resistance level at 1.1820. The pair is currently testing resistance by 200-MA line and resistance level at 1.1870. Successful breakout above the said resistance level will indicate the pair to continue its bullish momentum to trade higher toward the resistance level at 1.1990.
Resistance level: 1.1870, 1.1990
Support level: 1.1820, 1.1775
USDJPY
USDJPY, H4: USDJPY was traded higher prior its rebound from support level at 112.05. It is suggested to stay aside and wait for clearer signal before entering the trade prior to absence of obvious signals from both candlestick pattern and MACD signal line.
Resistance level: 112.60, 113.00
Support level: 112.05, 111.65
CrudeOIL
CrudeOIL, H1: Crude oil price was traded lower prior its retracement from resistance level at 51.35. Formation of engulfing candlestick pattern and negative divergence as portrayed by MACD signal line suggest crude oil price to undergo short-term technical correction to further its losses toward the support level at 50.80.
Resistance level: 51.35, 51.70
Support level: 50.80, 50.65
GOLD
GOLD_, H4: Gold price was traded higher after breaking above resistance level at 1278.25. Formation of engulfing candlestick suggests bullish momentum still taking over but diminishing due to downward slope of MACD histogram. A breakout above the resistance level at 1295.55 is required for gold price to gain greater momentum to increase its gains.
Resistance level: 1295.55, 1306.50
Support level: 1278.25, 1260.60
111017 Daily Analysis
11 October 2017 Daily Analysis
Greenback on pressure, Pound Sterling recoups losses.
Dollar index was depreciated by 0.49% to 92.90 against a trade-weighted basket of the other major currencies. Dollar index fell as it was being weighed by a rally in the Euro as catalyzed by positive economic data in the Euro zone and increased expectations of investors toward tightening of monetary policy by European Central Bank (ECB). In German, the Eurozone’s largest economy, its trade balance data was shown to be expanded to 21.6 billion, better than the expected 20 billion. On the other hand, Pound Sterling recouped its losses against the Greenback as backed by better-than-expected manufacturing and industrial data in United Kingdom. The manufacturing output has increased by 2.8% topping over forecast of a 1.9% increase, while total production output in the industrial sector risen by 1.6% against expectations of a 0.8% rise.
In the commodity market, crude oil price increased by 2 percent above $50 per barrel, traded at $51.05 as wrote after the market shown signs of gradual tightening of its crude supplies. Likewise, gold price remained stable and traded at $1288.71 a troy ounce following weakness of the Greenback.
Today’s Holiday Market Close
Time Market Event
N/A
Today’s Highlight Events
Time Market Event
Tentative CrudeOIL OPEC Monthly Report
02:00 USD FOMC Meeting Minutes
02:40 USD FOMC Member Williams Speaks
Today’s Highlight Economy Data
| Time | Nation & Data | Previous | Forecast |
Actual |
| 22:00 | USD – JOLTs Job Openings (Aug) | 6.170M | 6.138M | – |
GBPUSD
GBPUSD, H4: GBPUSD was traded higher prior its rebound from support level at 1.3175. Upward slope of MACD signal line suggests pair to trade higher toward the resistance by 200-MA and resistance level at 1.3240.
Resistance level: 1.3240, 1.3330
Support level: 1.3175, 1.3025
EURUSD
EURUSD, H4: EURUSD was traded higher prior its rebound from support level at 1.1740. The pair is currently testing the resistance level at 1.1820. Successful breakout of the said resistance level will suggest the pair to continue its momentum to trade higher based on upward slope of MACD signal line showing increasing bullish momentum, testing the next resistance level at 1.1870.
Resistance level: 1.1820, 1.1870
Support level: 1.1740, 1.1700
USDJPY
USDJPY, H4: USDJPY was traded lower after breaking below support level at 112.35. The pair is currently rebound to retest the current resistance level. In shorter term, it is suggested to wait for clearer confirmation before entering the trade.
Resistance level: 112.35, 113.00
Support level: 111.65, 111.05
CrudeOIL
Crude OIL, H4: Crude oil price was traded higher after breaking resistance level at 50.80. Golden-cross as formed by MACD histogram suggests the pair to continue its momentum to trade higher toward the next resistance level at 51.45.
Resistance level: 51.45, 52.40
Support level: 50.80, 49.85
GOLD
GOLD_, H4: Gold price was traded higher prior breaking above resistance level at 1278.25. It is currently testing the next resistance level at 1290.85. Successful closure of price above the said resistance level will further suggest gold price to surge higher toward the next resistance level at 1298.30.
Resistance level: 1290.85, 1298.30
Support level: 1278.25, 1272.55
101017 Daily Analysis
10 October 2017 Daily Analysis
Greenback loses its momentum, Gold price soars higher.
Dollar index was traded lower against a trade-weighted basket of the other major currencies by 0.07% to 93.55, following the latest geopolitical tension aroused when North Korea was reported to prepare a long-range missile test as a celebration to the founding of Pyongyang’s ruling party. In addition, the Greenback took a knock against Euro after data shown that German industrial output in August recorded its largest monthly increase in more than six years. A call from a member from the European Central Bank (ECB) executive board, Sabine Lautenschlaeger to roll back asset purchases in 2018 has also lead to a surge in Euro currency. Overall, according to Masafumi Yamamoto, chief forex strategist at Mizuho Securities, the dollar is still well supported and it is not easy to sell Greenback at the moment following a steady improve in U.S. wages as released on last Friday. Meanwhile, USD/JPY was last quoted at 112.66, down 0.02%; GBP/USD traded at 1.3168, up 0.2%; AUD/USD was traded higher at 0.7787, up 0.44%.
In the commodity market, crude oil price remains stable at 49.69 with an increase of 0.22% as OPEC mentioned that the market is undergoing rebalancing while U.S. production stayed offline prior to Hurricane Nate. Otherwise, gold prices continue to surge higher by 0.48% to $1287.90 as an uptick in geopolitical uncertainty increases the demand for safe-haven asset.
Today’s Holiday Market Close
Time Market Event
N/A
Today’s Highlight Events
Time Market Event
22:00 USD FOMC Member Kashkari Speaks
Today’s Highlight Economy Data
| Time | Nation & Data | Previous | Forecast | Actual |
| 08:30 | AUD – NAB Business Confidence (Sep) | 5 | 6 | 7 |
| 14:00 | EUR – German Trade Balance (Aug) | 19.5B | 20.3B | – |
| Tentative | CNY – New Loans | 1090.0B | 1230.0B | – |
| 16:30 | GBP – Manufacturing Production (MoM) (Aug) | 1.9% | 1.9% | – |
| 20:15 | CAD – Housing Starts (Sep) | 223.2K | 210.0K | – |
| 20:30 | CAD – Building Permits (MoM) (Aug) | -3.5% | – | – |
GBPUSD
GBPUSD, H4: GBPUSD was traded lower prior its retracement from resistance level at 1.3175. However, upward slope as portrayed by MACD signal line suggests the pair on higher tendency to trade higher, testing back the said resistance level.
Resistance level: 1.3175, 1.3240
Support level: 1.3025, 1.2940
EURUSD
EURUSD, H4: EURUSD was traded higher prior breaking above resistance level at 1.1740. Upward slope of MACD signal line suggests the pair to continue its momentum to trade higher toward the next resistance level at 1.1820.
Resistance level: 1.1820, 1.1870
Support level: 1.1700, 1.1615
USDJPY
USDJPY, H4: USDJPY was traded in consolidation within resistance level at 113.00 and support level at 112.35. It is suggested to wait for breakout to occur following absent of obvious signal from both price action and MACD indicator.
Resistance level: 113.00, 113.55
Support level: 112.35, 111.65
CrudeOIL
Crude OIL, H4: Crude oil price was traded higher following its rebound from support level at 49.10 and support by 200-MA line. Positive divergence as shown by MACD histogram suggests crude oil price to trade higher toward the resistance level at 49.85.
Resistance level: 49.85, 50.80
Support level: 49.10, 48.30
GOLD
GOLD_, H1: Gold price was traded higher following its successful breaking above resistance level at 1278.25 and 200-MA line. Engulfing candlestick pattern and diminishing bearish momentum as portrayed by MACD histogram suggest gold price to trade higher toward the next resistance level at 1290.85.
Resistance level: 1290.85, 1298.30
Support level: 1278.25, 1272.55