110618 Weekly Analysis
11 June 2018 Weekly Analysis
GCMAsia Weekly Report: June 11 – 15
Market Review (Forex): June 4 – 8
US dollar appreciates slightly last Friday albeit gains were limited as market participants remains wary over escalating trade tension as G7 meeting got underway. The dollar index rose 0.14% to 93.56 albeit recording a weekly loss of 0.68%.
Due to the lack of top-tier economic data from the US, market participants shifted their focus towards the G7 meeting held in Canada which consist of United States and its allies. US President Donald Trump attended the meeting following frosty measures taken upon Mexico, Canada and European Union by enacting high tariff upon aluminum and steel import from those countries.
For the week, investors will be placing their focus over the highly anticipated summit between United States and North Korea which is scheduled to be held on Tuesday in Singapore. Prior, Trump postulate that he may sign a peace treaty with the North counterpart in order to officially end the Korean War, which could erase geopolitical tension that has haunt the market periodically.
USD/JPY
Pair of USD/JPY was down 0.14% to 109.55 following risk aversion in the market prior to G7 meeting.
EUR/USD
Euro was down 0.25% to $1.1770 against the greenback despite expectations for the European Central Bank to announce the end date of its quantitative easing program next week.
GBP/USD
GBP/USD depreciates by 0.11% to $1.3407 during late Friday trading.
Market Review (Commodities): June 4 – 8
GOLD
Gold price extended gains during late Friday trading due to higher risk aversion among investors against escalating trade tension between the US and its allies. Gold price extended gains by 0.14% while closing the week at $1,299.04 a troy ounce.
Tension between the US and its allies grew following Trump’s controversial introduction of high tariff upon steel and aluminum imports from Mexico, Canada and European Union. However, gains on the safe-haven commodity remains limited as US Federal Reserve is widely expected to raise interest rate next week, a condition which could downgrade the appeal of non-yielding assets in the market.
Crude Oil
Crude oil price settled lower last Friday after data showed higher count of US oil rigs which may interrupt OPEC’s effort in reducing global supply glut. Price of the black commodity slumped 0.52% while closing the week at $65.55 per barrel.
According to US oilfield service provider, Baker Hughes reported that the number of oil drilling rig was up by 1 to 862, its highest level since March 2015. The continuous increase in oil rig came after Energy Information Administration revealed that US oil output has rose to a record high of 10.8 million barrels per day.
However, losses on the commodity were limited after Algeria’s oil minister said that OPEC would focus on balancing the market rather than easing their production limit in order to offset supply shortage from Venezuela and Iran. The bullish comment came after Iraqi oil minister said that production increase in second half of the year is not likely as it was not included in the agenda for month end OPEC meeting.
Weekly Outlook: June 11 – 15
For the week, investors will place their focus over US Federal Reserve whom are widely anticipated to increase their interest rate by 25 basis points to 2.00% on Thursday. In addition, investors will also ponder upon the European Central Bank which is expected to announce the end date for their QE program during their policy meeting on Thursday.
For the oil market, traders will anticipate the release of monthly report from International Energy Agency and OPEC in order to gauge the supply and demand levels of global oil market.
Highlighted economy data and events for the week: June 11 – 15
| Monday, June 11 |
Data GBP – Manufacturing Production (MoM) (Apr) GBP – Trade Balance (Apr)
Events N/A
|
| Tuesday, June 12 |
Data GBP – Average Earnings Index +Bonus (Apr) GBP – Claimant Count Change GBP – Unemployment Rate (Apr) USD – Core CPI (MoM) (May)
Events CrudeOIL – OPEC Monthly Report
|
| Wednesday, June 13 |
Data CrudeOIL – API Weekly Crude Oil Stock GBP – CPI (YoY) (May) EUR – Industrial Production (MoM) (Apr) USD – PPI (MoM) (May) CrudeOIL – Crude Oil Inventories CrudeOIL – Gasoline Inventories
Events CrudeOIL – IEA Monthly Report
|
| Thursday, June 14 |
Data USD – Fed Interest Rate Decision AUD – Employment Change (May) AUD – Unemployment Rate (May) CNY – Industrial Production (YoY) (May) EUR – German CPI (MoM) (May) GBP – Retail Sales (MoM) (May) EUR – ECB Interest Rate Decision EUR – Deposit Facility Rate EUR – ECB Marginal Lending Facility USD – Core Retail Sales (MoM) (May) USD – Import Price Index (MoM) (May) USD – Initial Jobless Claims
Events USD – FOMC Economic Projections USD – FOMC Statement USD – FOMC Press Conference EUR – ECB Press Conference
|
|
Friday, June 15
|
Data JPY – BoJ Interest Rate Decision EUR – CPI (YoY) (May) USD – NY Empire State Manufacturing Index (Jun) CAD – Manufacturing Sales (Apr) USD – Industrial Production (MoM) (May) USD – Michigan Consumer Sentiment (Jun) CrudeOIL – US Baker Hughes Oil Rig Count
Events JPY – BoJ Monetary Policy Statement JPY – BoJ Press Conference
|
Technical Weekly Outlook: June 11 – 15
Dollar Index
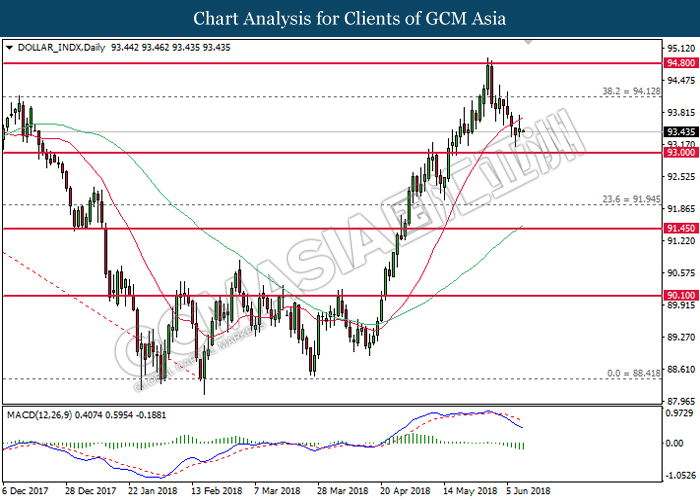
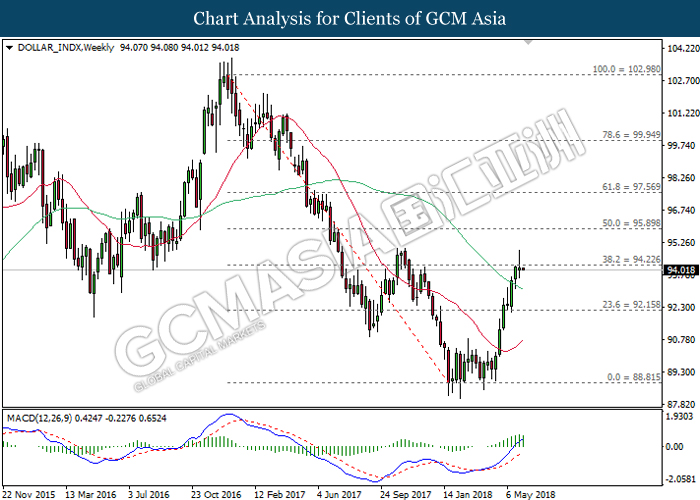
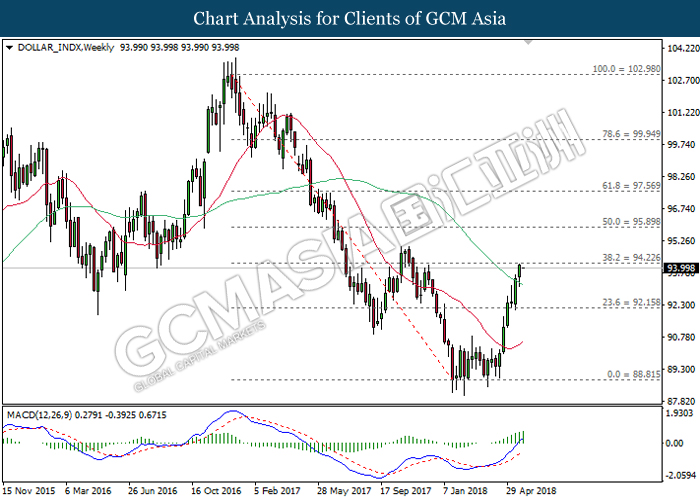
DOLLAR_INDX, Daily: Dollar index was traded lower following prior retracement from the resistance level at 94.80. MACD histogram which continues to illustrate downward signal suggests the index to extend its bearish bias, towards the support level at 93.00.
Resistance level: 94.10, 94.80
Support level: 93.00, 91.95
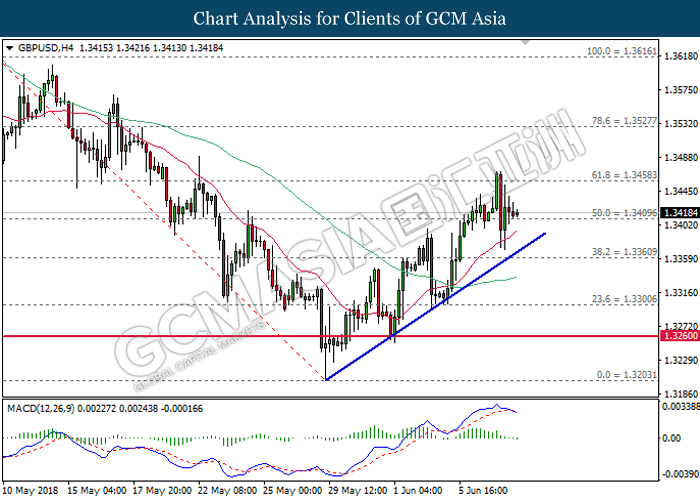
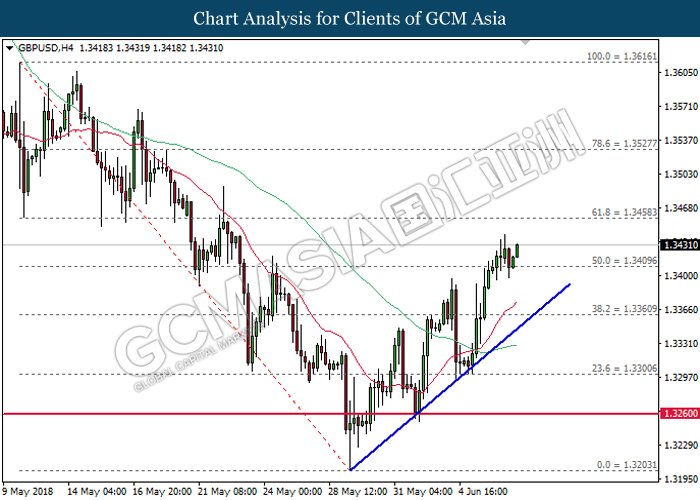
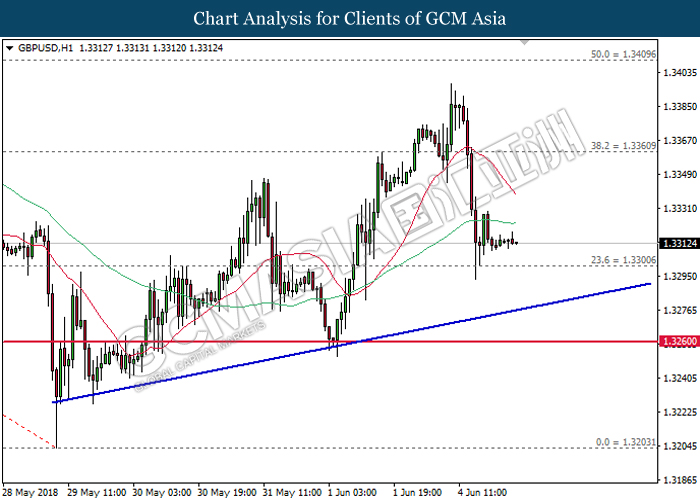
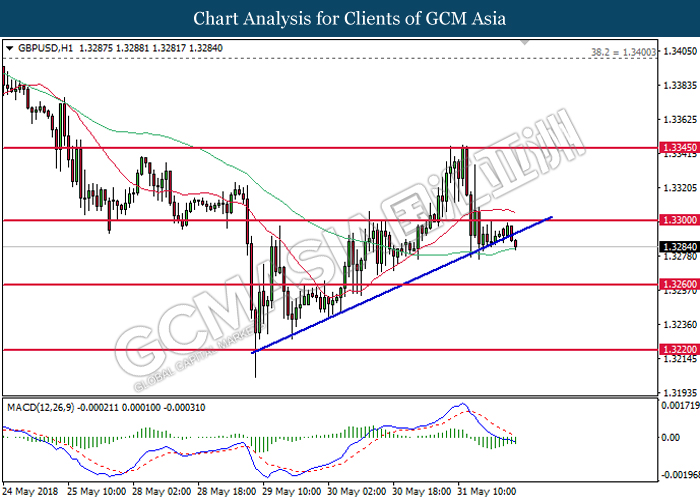
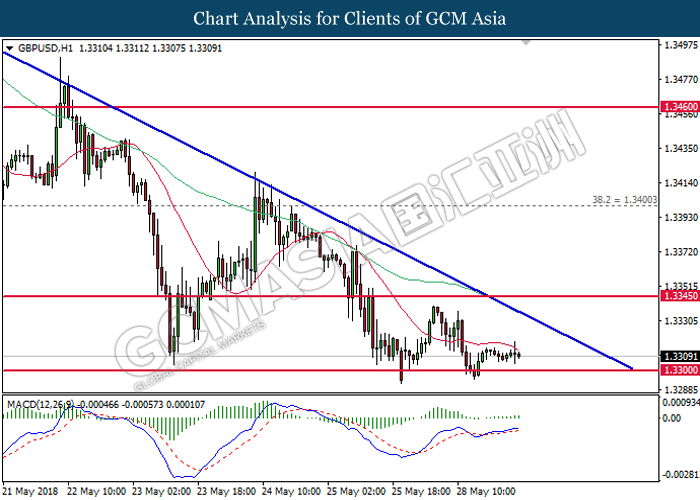
GBPUSD
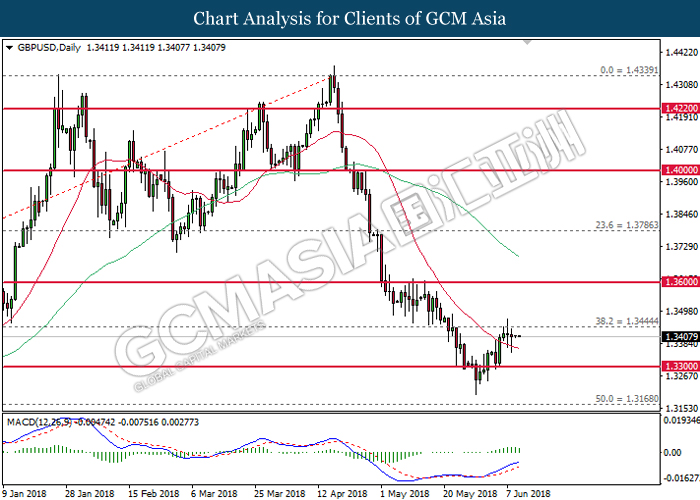
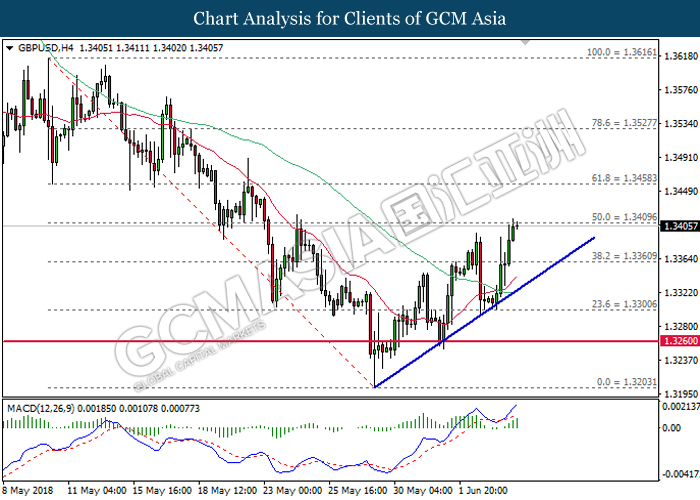
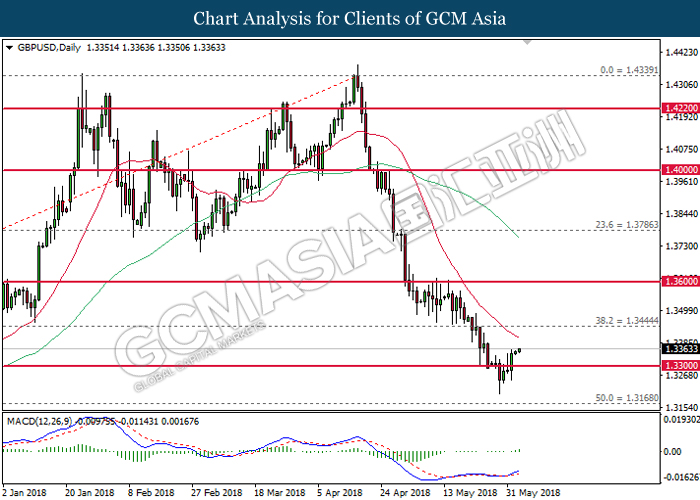
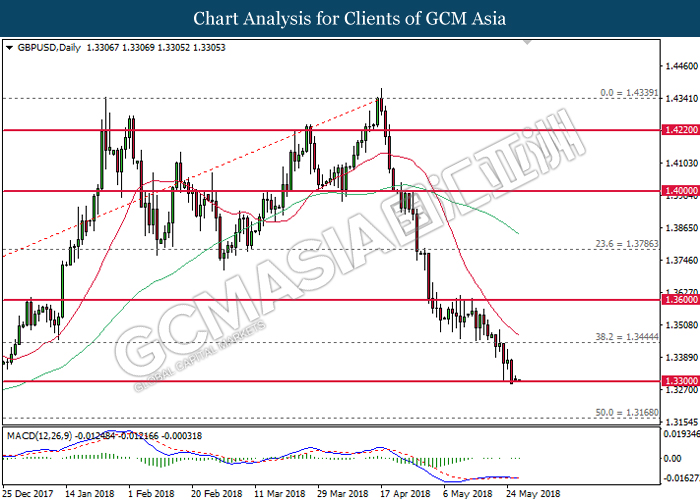
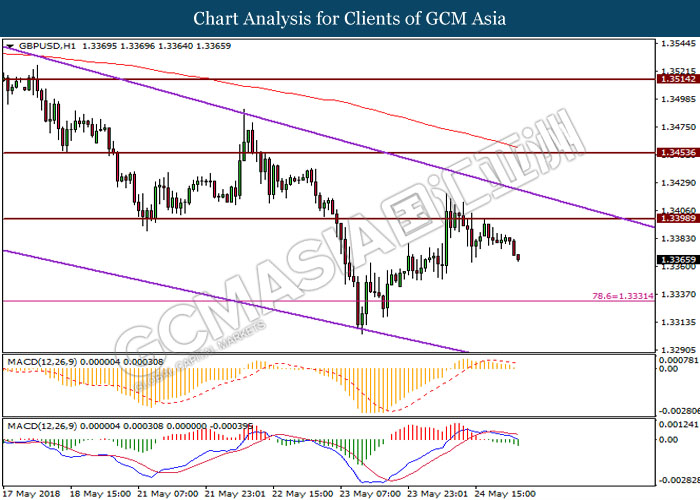
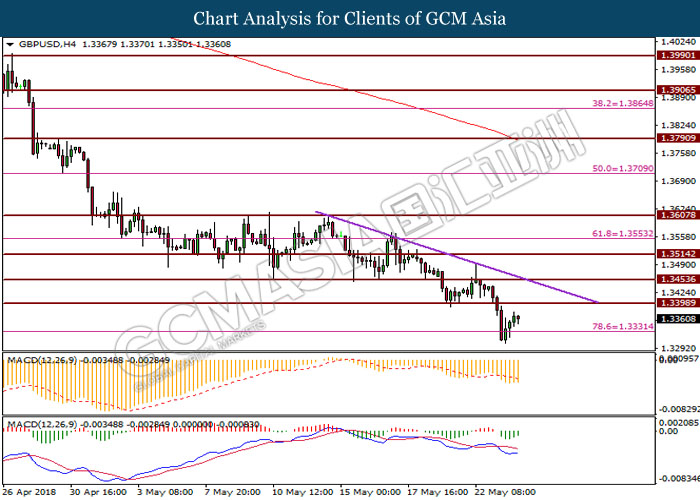
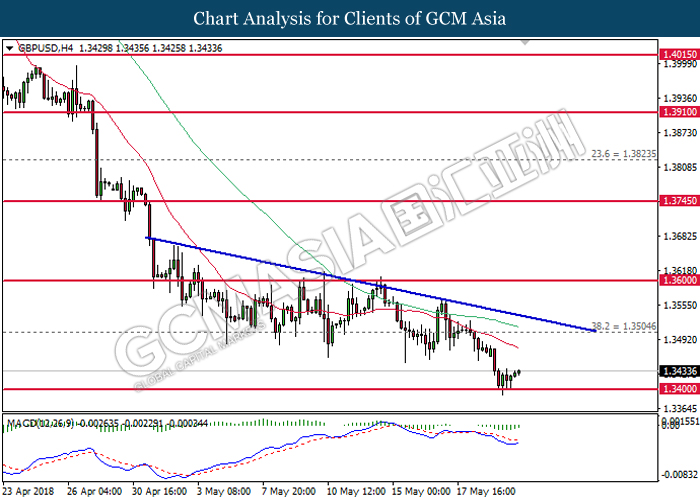
GBPUSD, Daily: GBPUSD was traded lower following prior retracement from the resistance level of 1.3445. MACD histogram which continues to illustrate bullish bias suggests the pair to extend its gains in the event of a successful closure above the threshold of 1.3445.
Resistance level: 1.3445, 1.3600
Support level: 1.3300, 1.3170
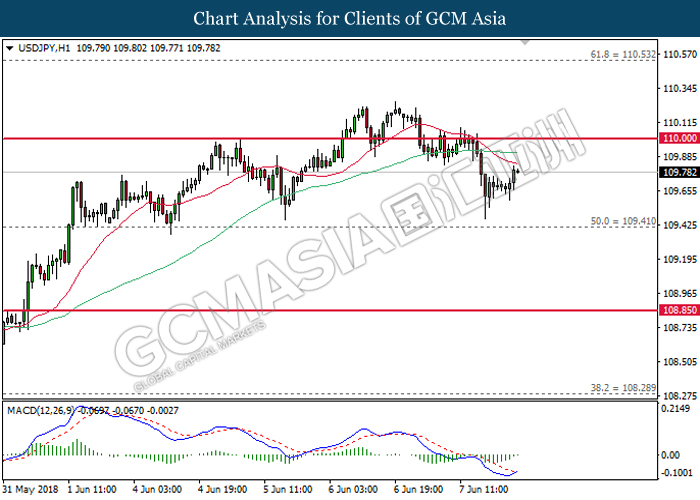
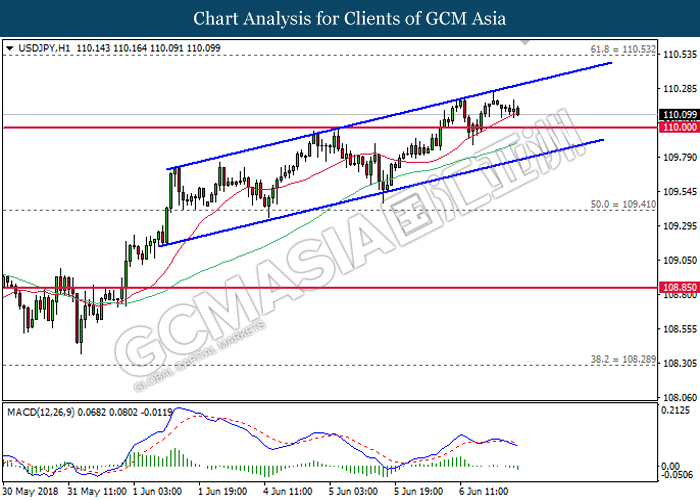
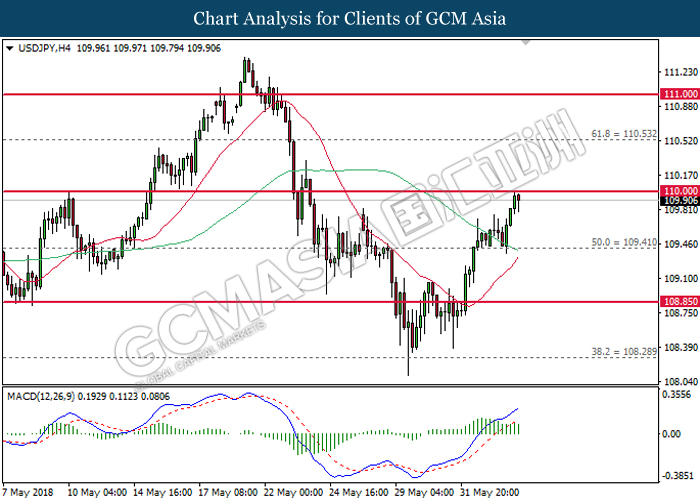
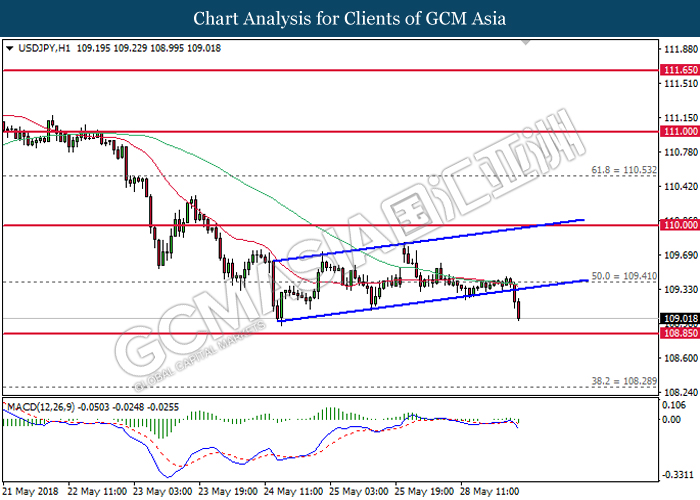
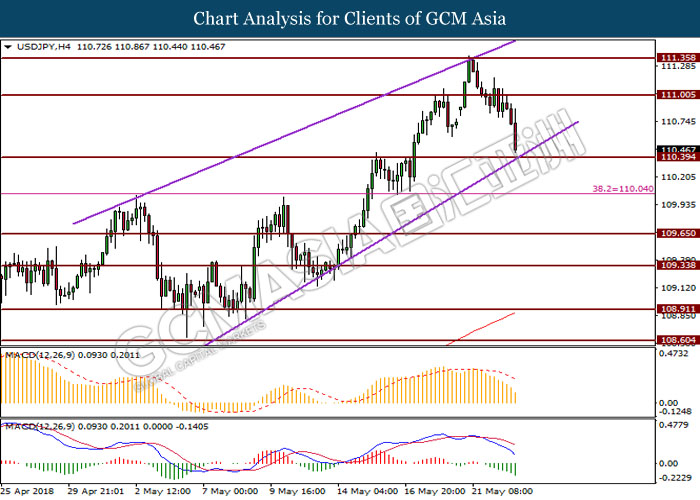
USDJPY
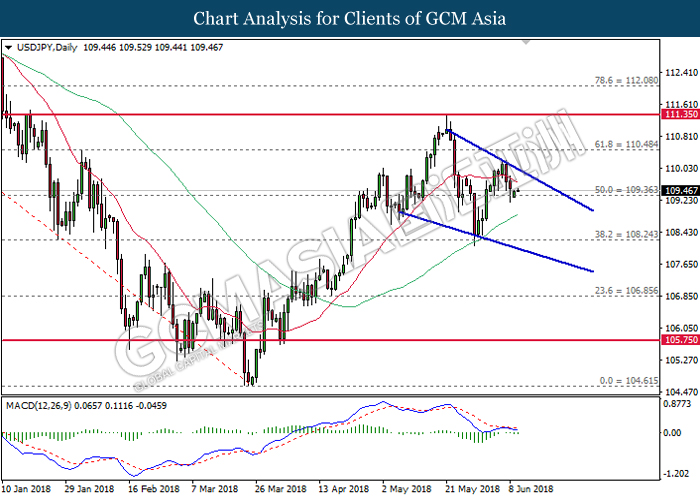
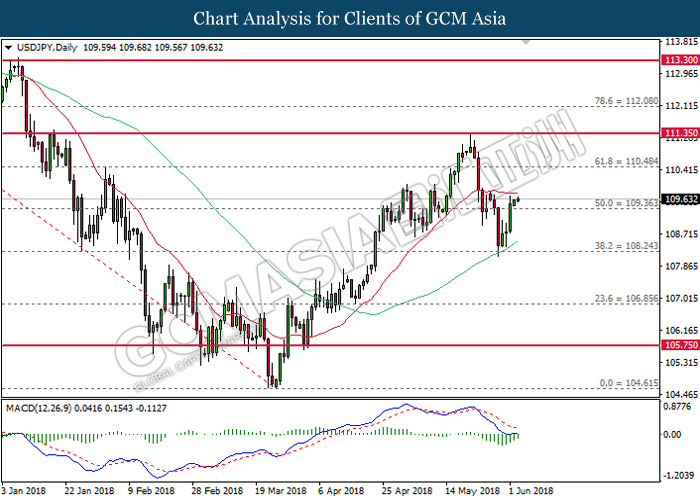
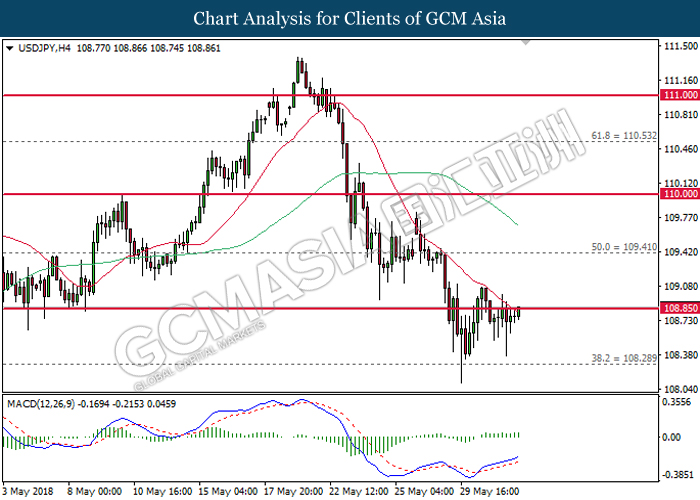
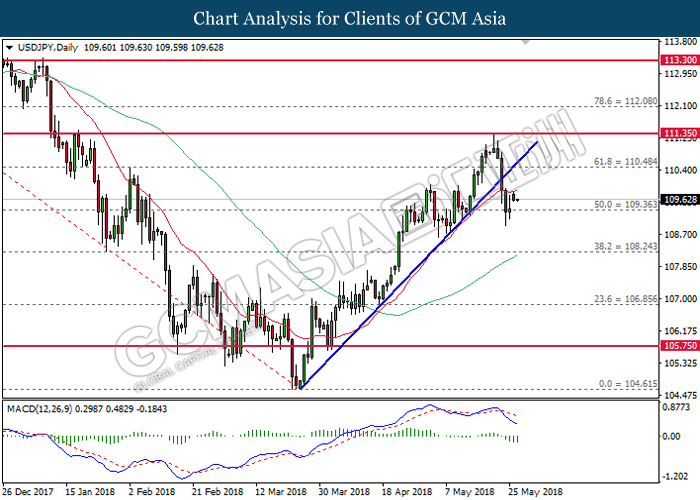
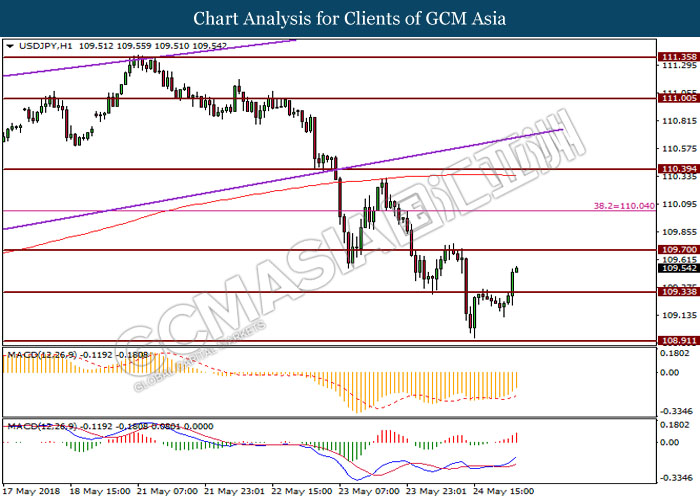
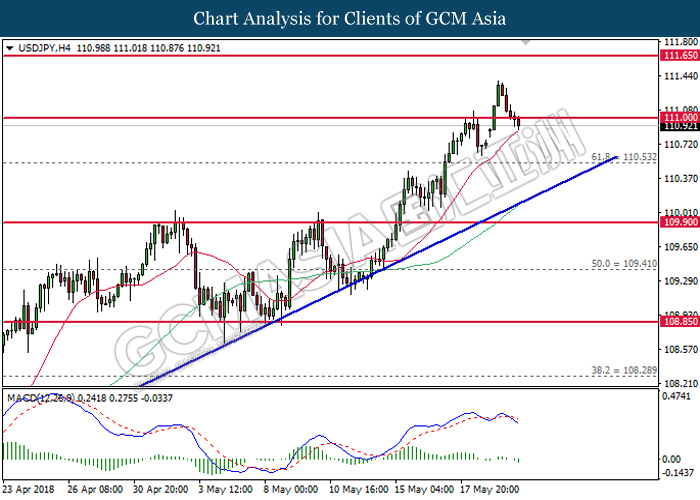
USDJPY, Daily: USDJPY remains traded within a descending wedge following prior retracement from the top level. MACD histogram which begins to illustrate downward signal suggests the pair to extend its losses after breaking the support level of 109.35.
Resistance level: 110.50, 111.35
Support level: 109.35, 108.25
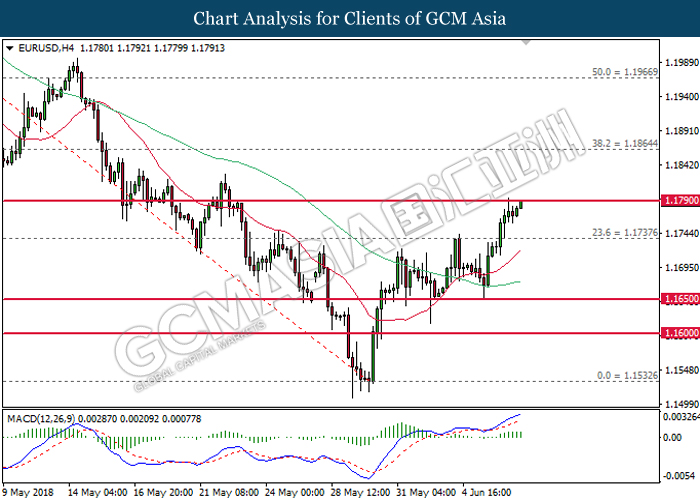
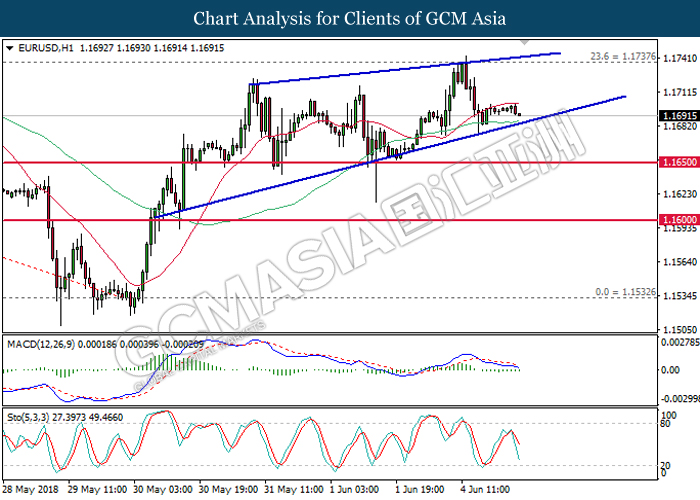
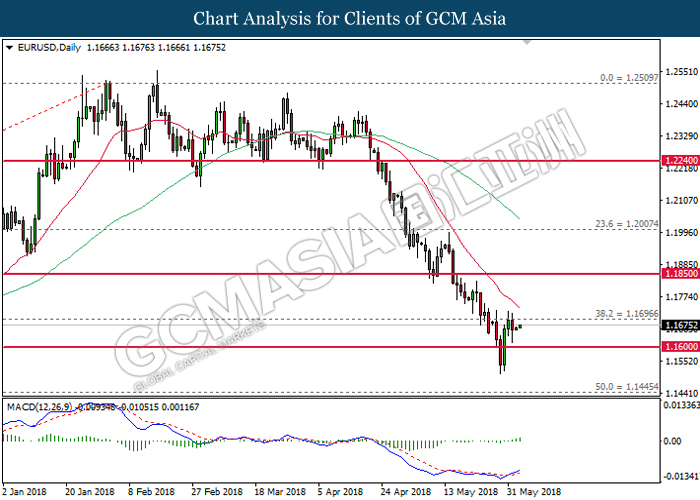
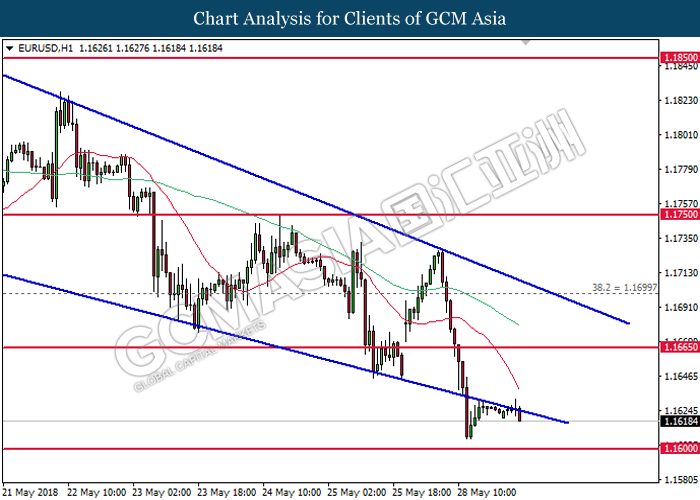
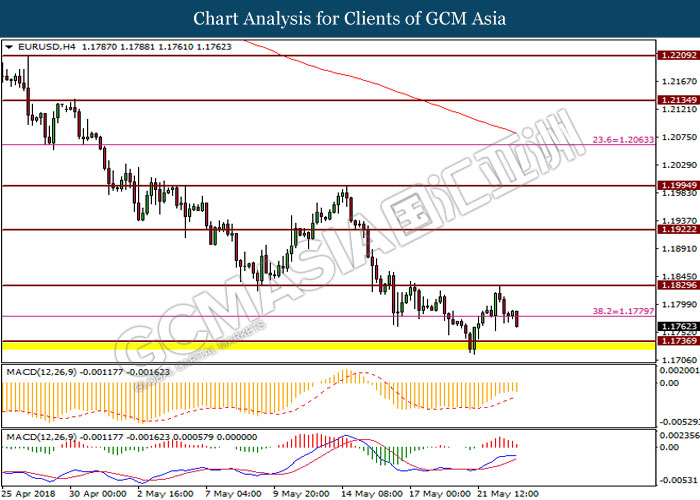
EURUSD
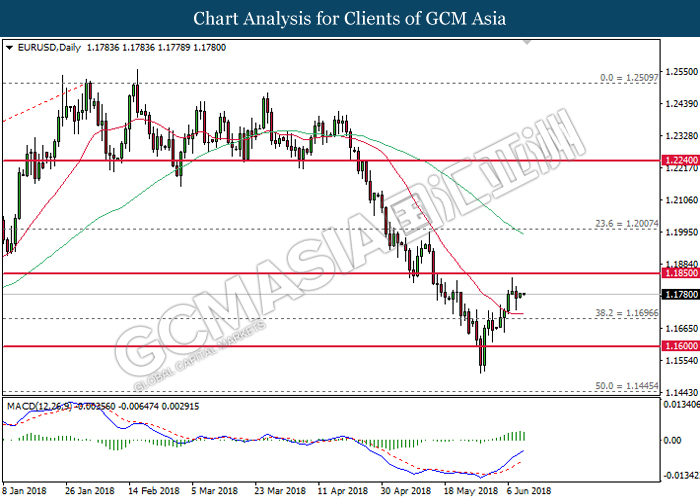
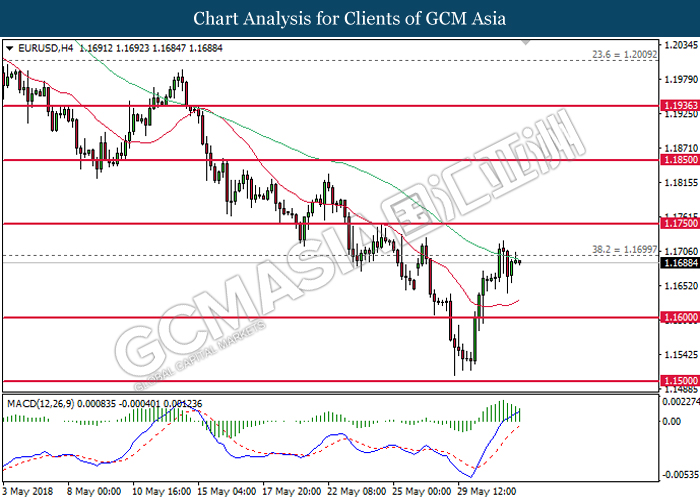
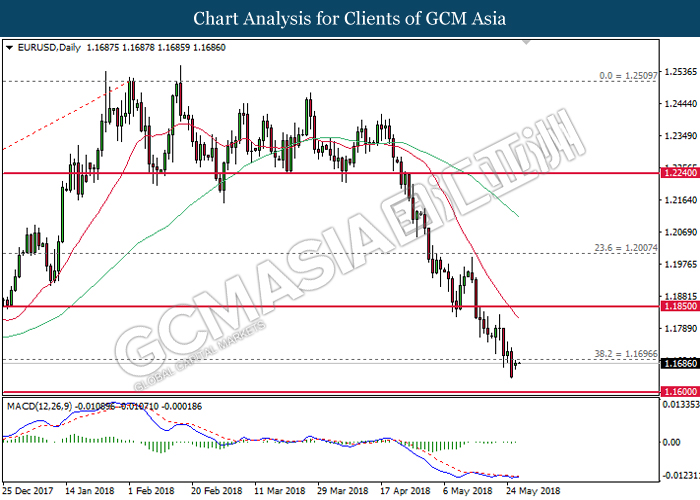
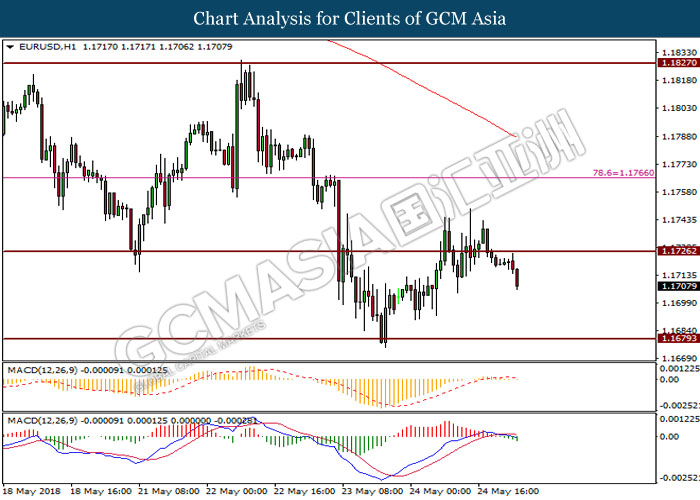
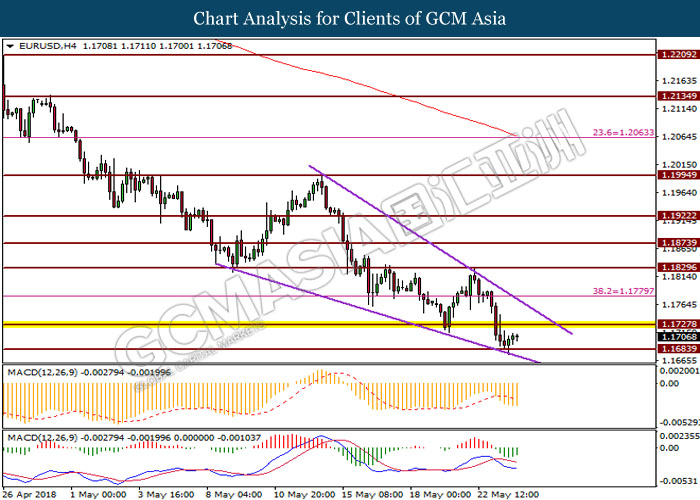
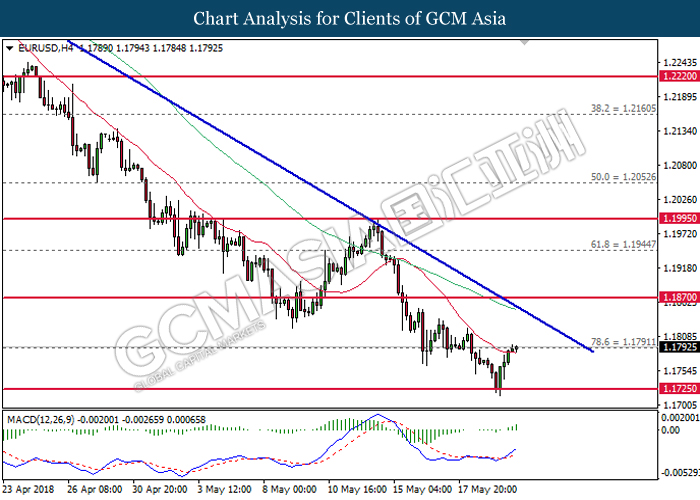
EURUSD, Daily: EURUSD was traded higher following prior rebound near the 20-MA line (red). MACD histogram which continues to illustrate bullish signal suggests the pair to extend its gains after breaking the strong resistance level near 1.1850.
Resistance level: 1.1850, 1.2000
Support level: 1.1700, 1.1600
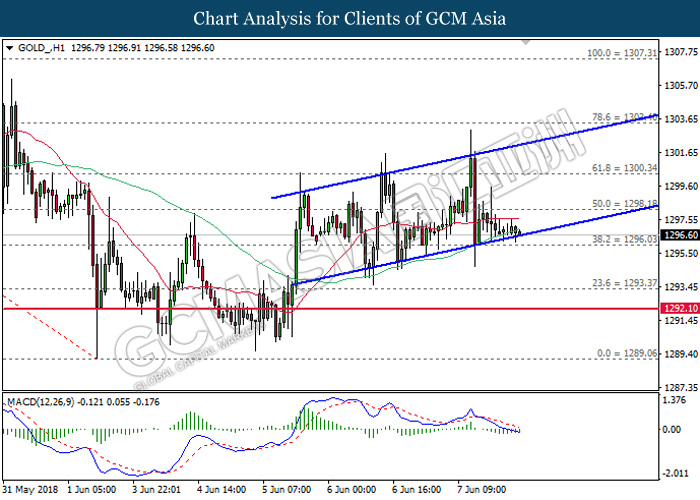
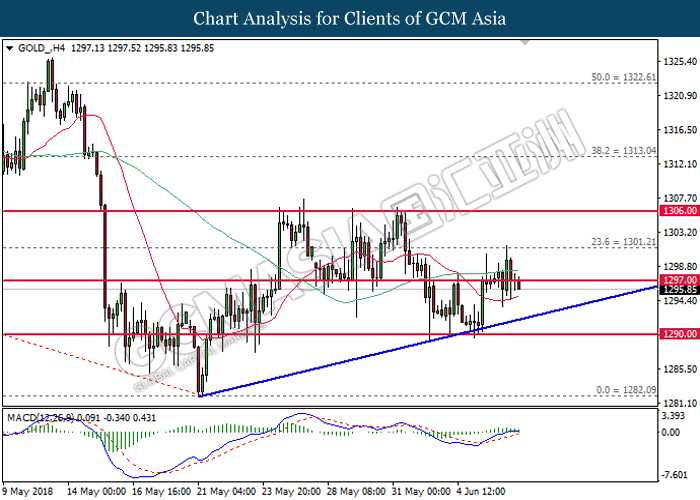
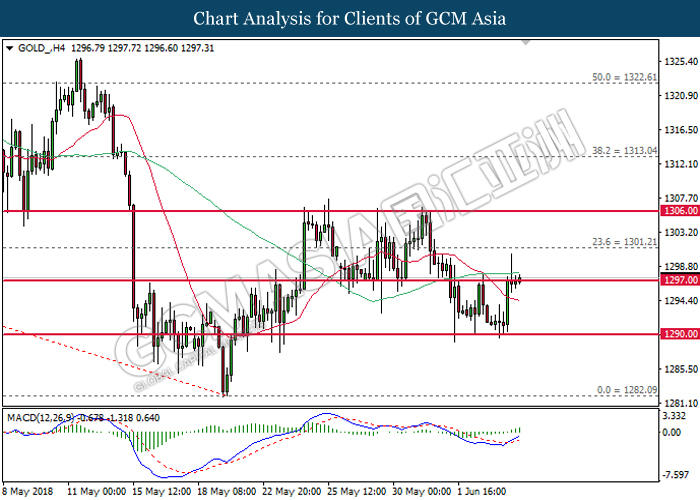
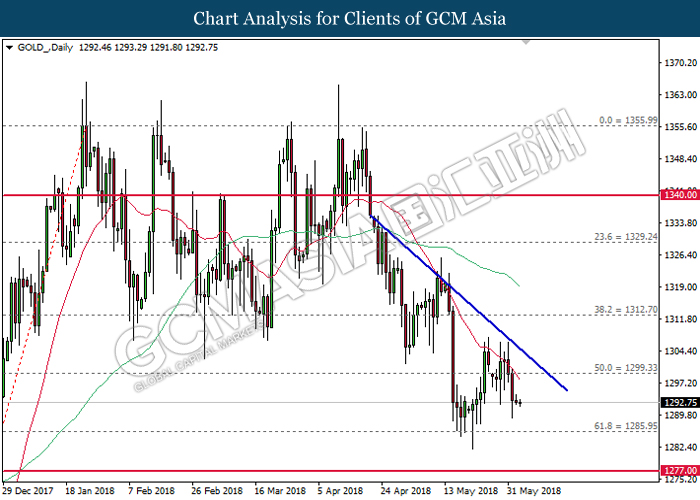
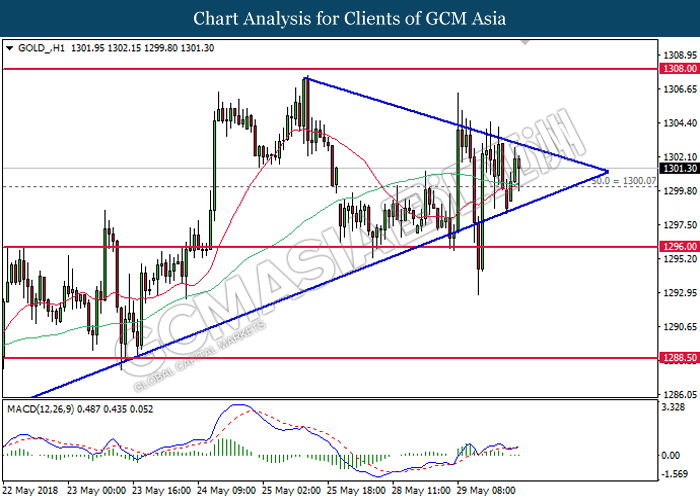
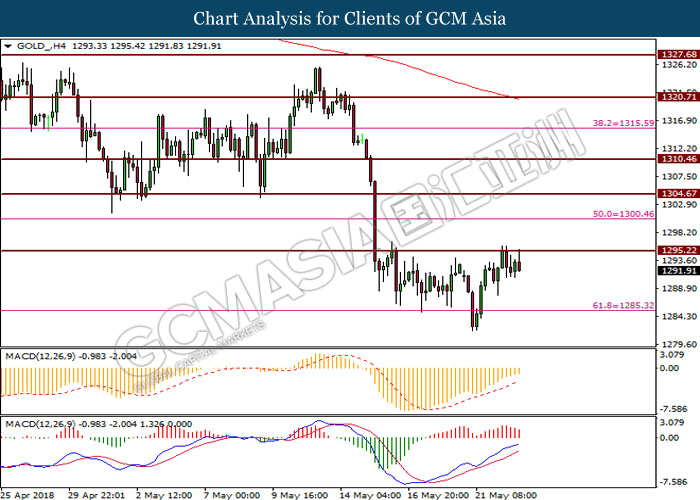
GOLD
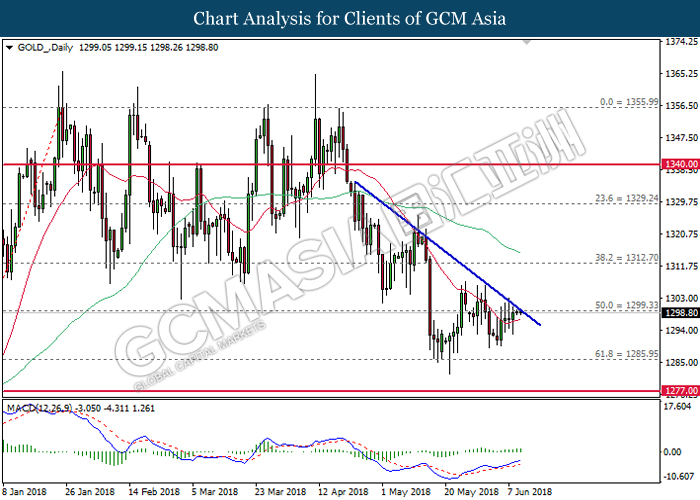
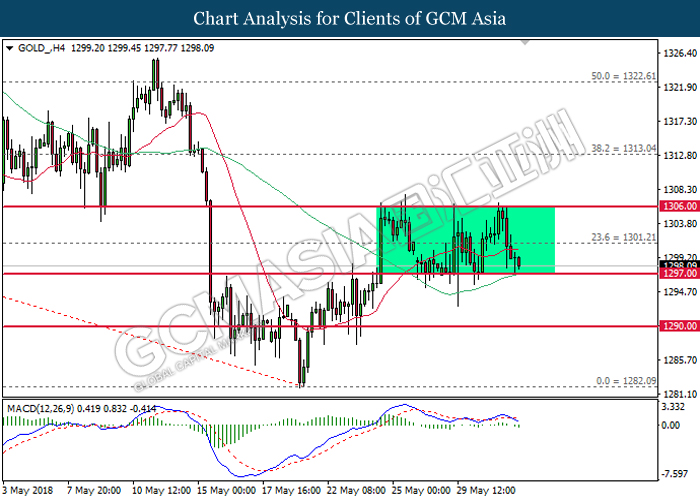
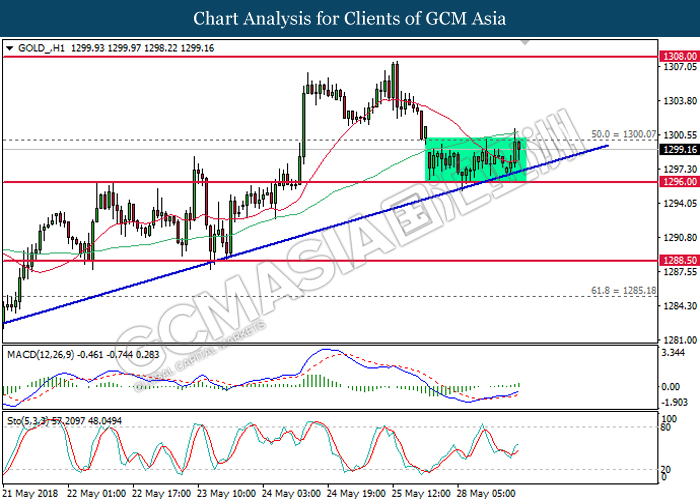
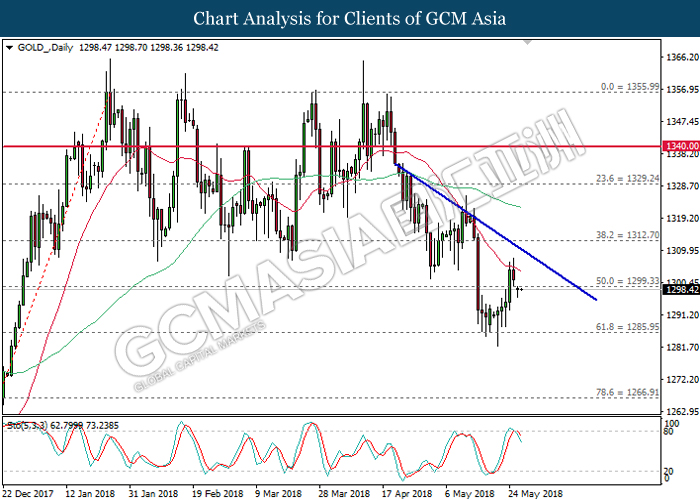
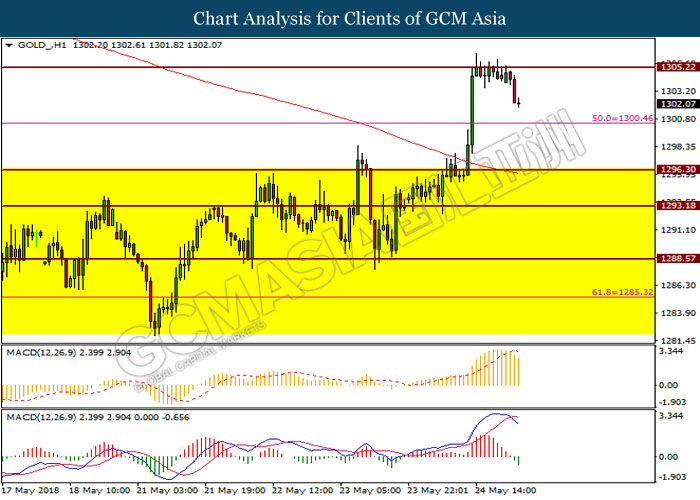
GOLD_, Daily: Gold price extended its recovery following prior rebound near the strong support level of 1285.95. MACD histogram which illustrate persistent upward signal suggests the commodity price to advance further upwards after breaking the downward trendline and resistance level at 1300.00.
Resistance level: 1300.00, 1312.70
Support level: 1285.95, 1266.90
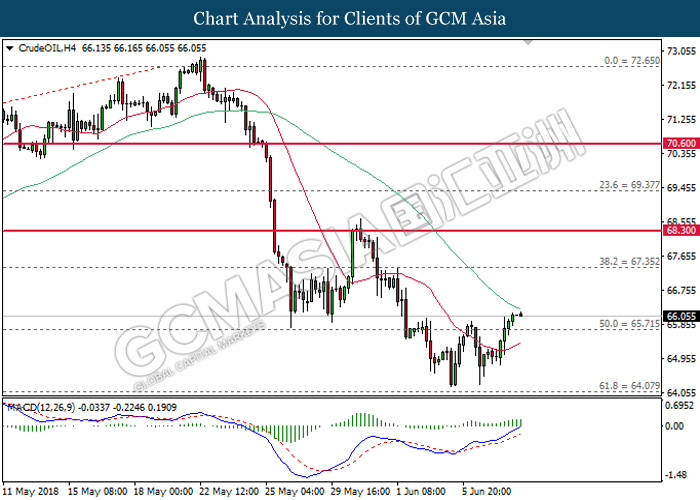
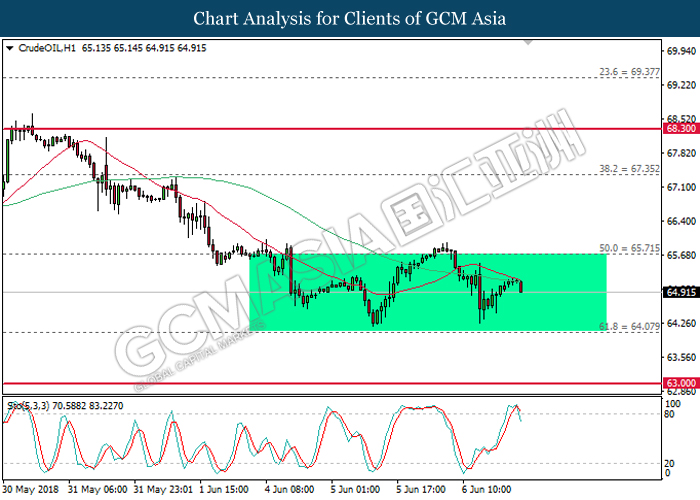
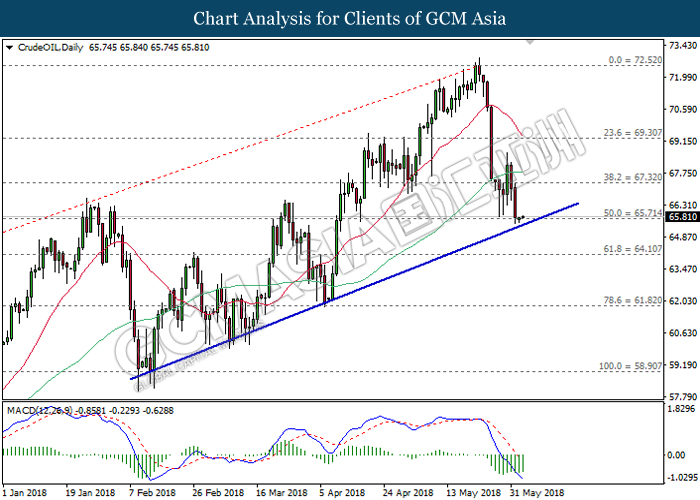
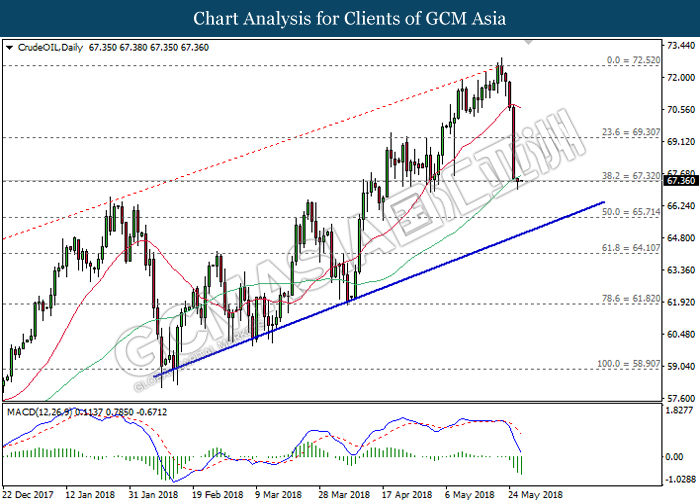
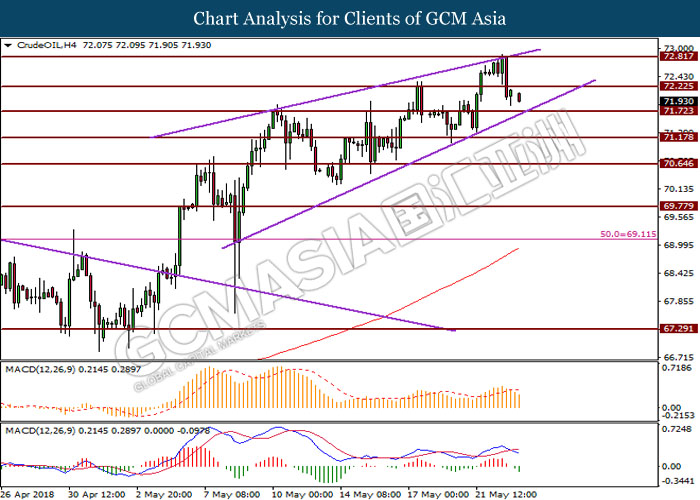
Crude Oil
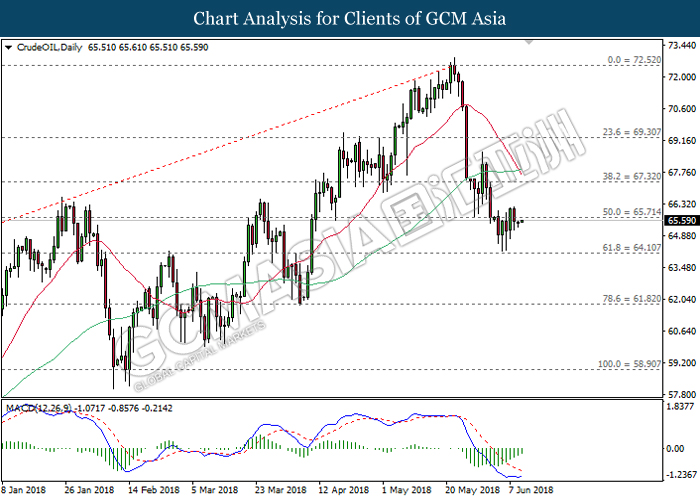
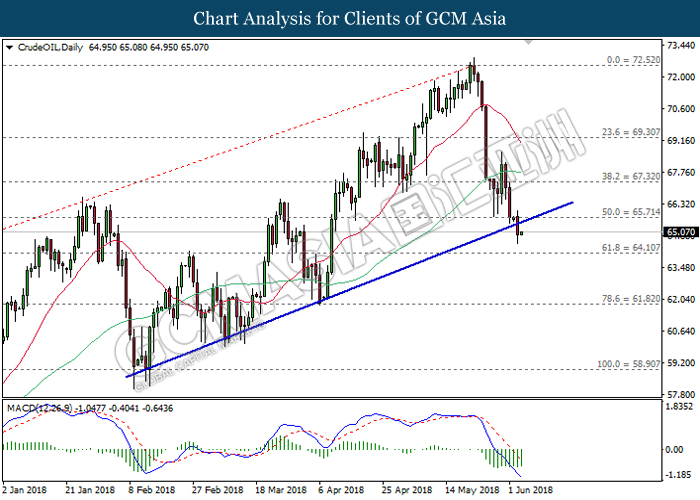
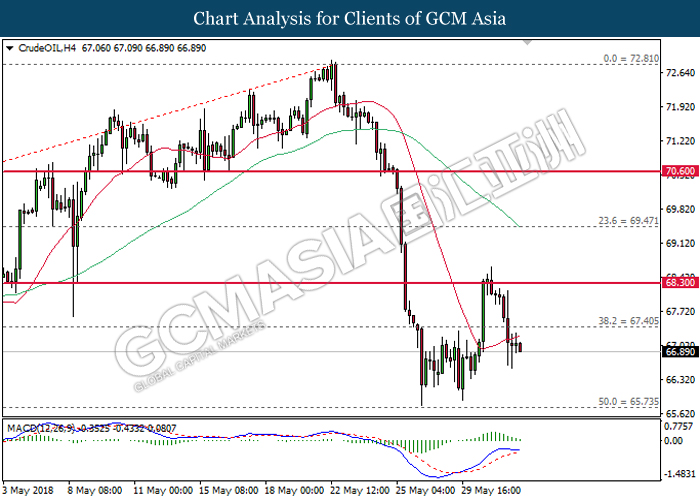
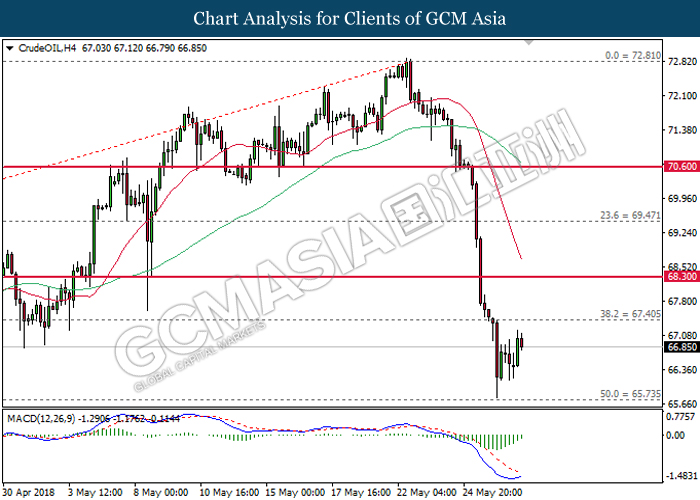
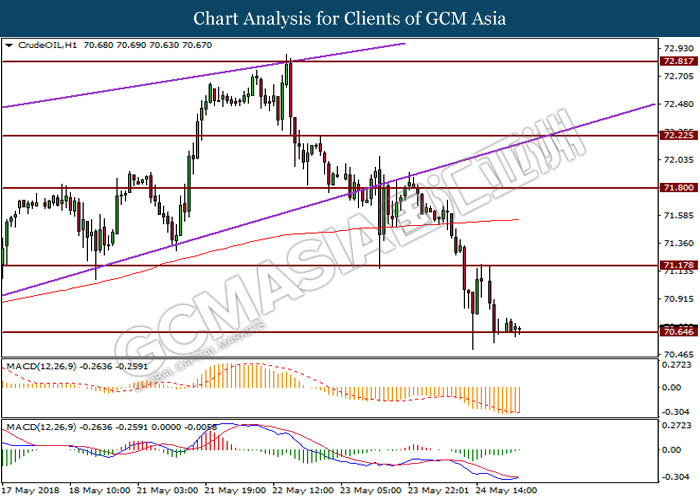
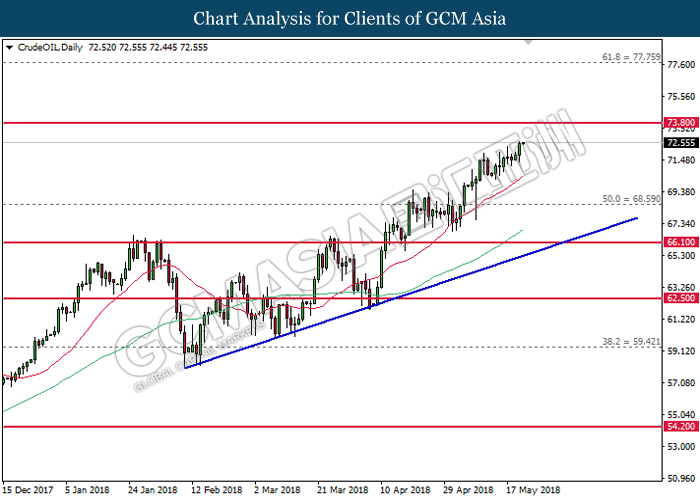
CrudeOIL, Daily: Crude oil price was traded higher after regaining some support at 64.10. MACD histogram which illustrate diminishing downward momentum suggests the commodity price to extend its recovery after breaking the resistance level near 65.70.
Resistance level: 65.70, 67.30
Support level: 64.10, 61.80
080618 Daily Analysis
8 June 2018 Daily Analysis
Dollar-bears took a break, ECB still on tap.
Greenback shies away from session low against other major peers on yesterday albeit remained under pressure as Euro continued to extend its gains over the backdrop of higher prospect towards European Central Bank (ECB) to shed their plans on their QE program. The dollar index tacks up 0.08% while last quoted at 93.37 during Asian trading hours. Overnight, US dollar received some bullish support after Initial Jobless Claims for last week decreased by 1,000 individuals to a seasonally adjusted total of 222,000, beating economist expectation to remain at 223,000. However, overall upside on the currency remained limited as investors mulls over ECB that may announce the end date of their massive bond-purchasing program next week, sparking higher bets on the central bank to tighten their policy sooner than later. The single common currency, Euro depreciates slightly by 0.06% to $1.1796 against the US dollar.
Peering into the commodities market, crude oil price pared its losses by 0.35% to $66.12 per barrel after Iraqi’s Oil Minister postulate that a production increase for the second half of the year is not the main agenda for OPEC’s meeting on June 22nd. The signal has reduced investors fear over OPEC which has suggested to lift their production levels in order to offset diminished supply from Venezuela and Iran. Otherwise, gold price was down 0.02% to $1,296.93 a troy ounce over the backdrop of stronger dollar and diminished market risk.
Today’s Holiday Market Close
Time Market Event
N/A
Today’s Highlight Events
Time Market Event
N/A
Today’s Highlight Economy Data
| Time | Nation & Data | Previous | Forecast | Actual |
| 07:50 | JPY – GDP (QoQ) (Q1) | -0.2% | -0.1% | -0.2% |
| 14:00 | EUR – German Industrial Production (MoM) (Apr) | 1.0% | 0.3% | – |
| 14:00 | EUR – German Trade Balance (Apr) | 22.0B | 21.0B | – |
| 16:30 | GBP – Manufacturing Production (MoM) (Apr) | -0.1% | -0.2% | – |
| 20:30 | CAD – Employment Change (May) | -1.1K | 17.5K | – |
| 20:30 | CAD – Unemployment Rate (May) | 5.8% | 5.8% | – |
| 01:00 | CrudeOIL – US Baker Hughes Oil Rig Count | 861 | – | – |
GBPUSD
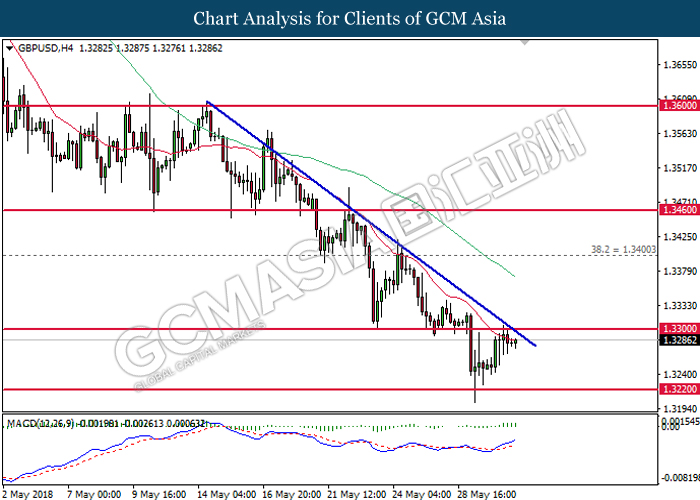
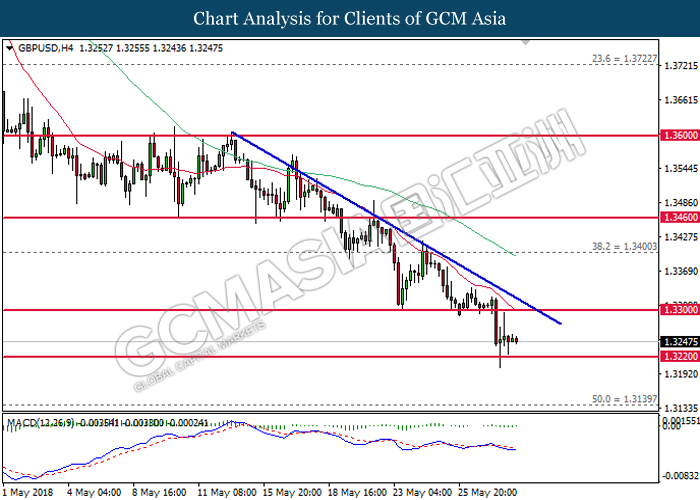
GBPUSD, H4: GBPUSD was traded lower following prior retracement from the threshold of 1.3460. MACD histogram which has formed a death cross signal suggests the pair to be traded lower in short-term as technical correction after closing below the support level of 1.3410.
Resistance level: 1.3460, 1.3530
Support level: 1.3410, 1.3360
EURUSD
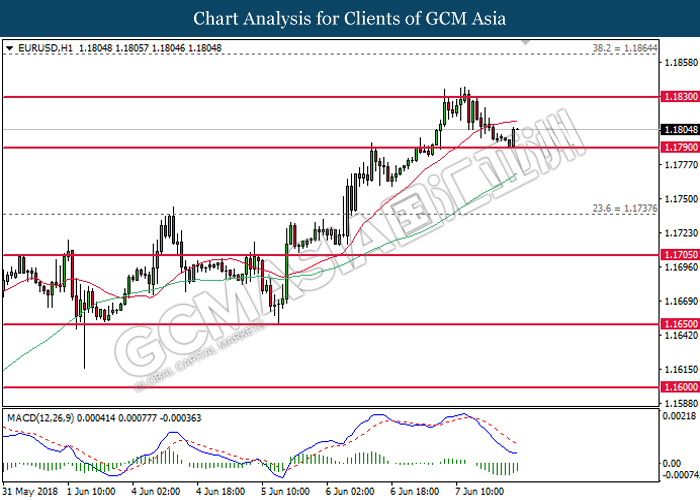
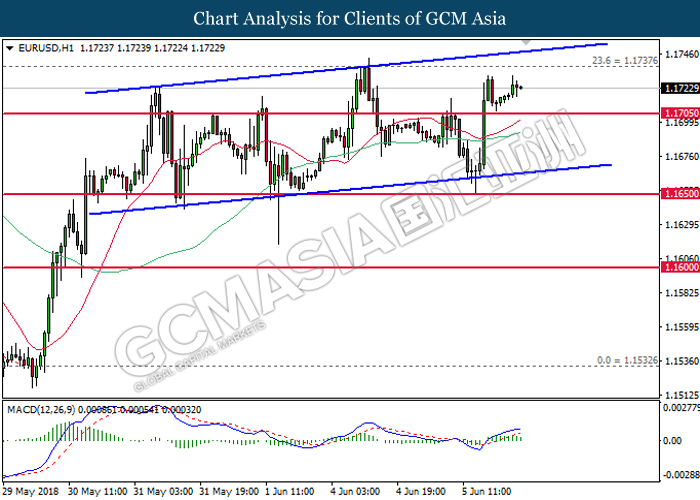
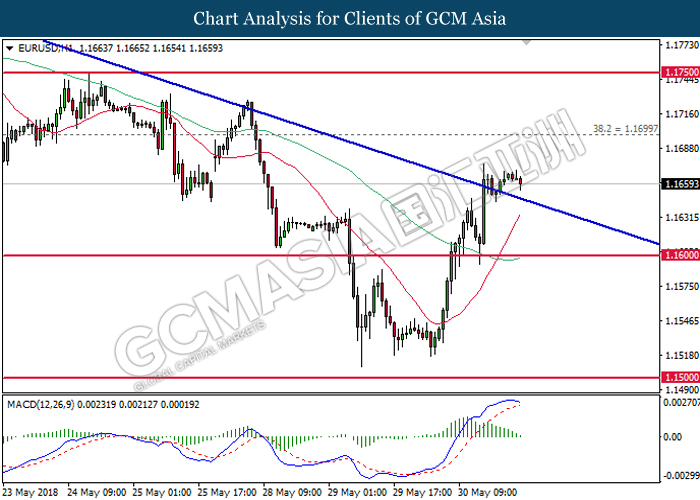
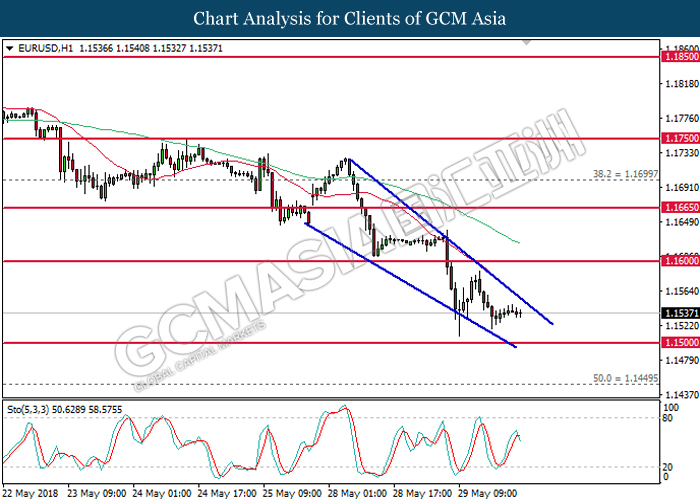
EURUSD, H1: EURUSD was traded higher following a bullish rebound from the support level of 1.1790. MACD histogram which illustrate diminishing downward momentum suggests the pair to extend its upside bias after closing above the 20-MA line (red).
Resistance level: 1.1830, 1.1865
Support level: 1.1790, 1.1740
USDJPY
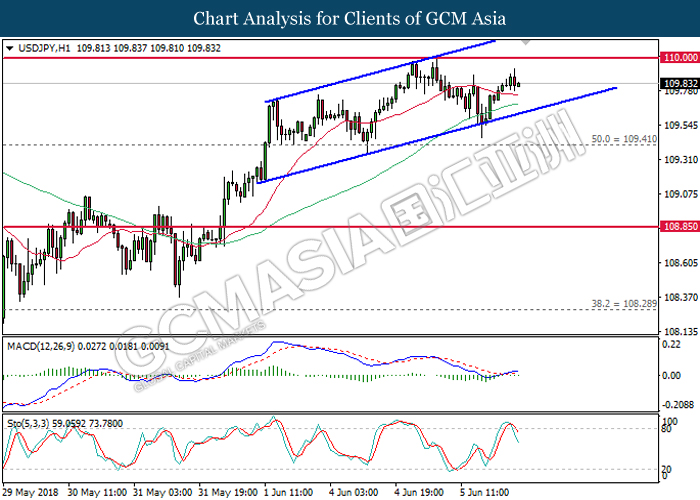
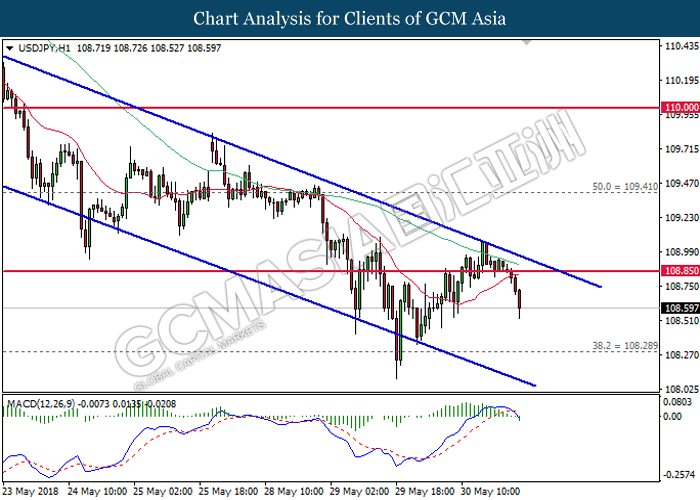
USDJPY, H1: USDJPY was traded higher following prior rebound near the region of 109.40. MACD histogram which begins to form an upward signal suggests the pair to extend its gains after closing above the 20-MA line (red).
Resistance level: 110.00, 110.55
Support level: 109.40, 108.85
CrudeOIL
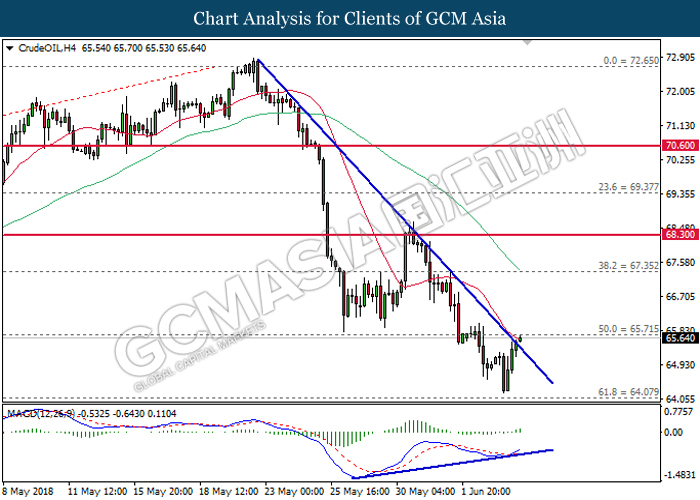
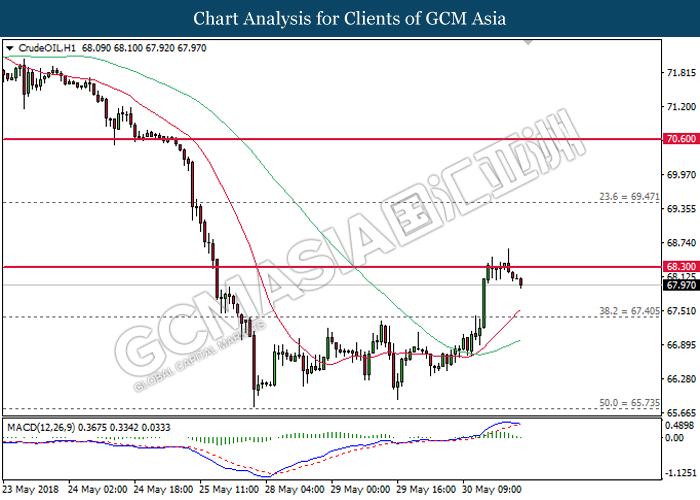
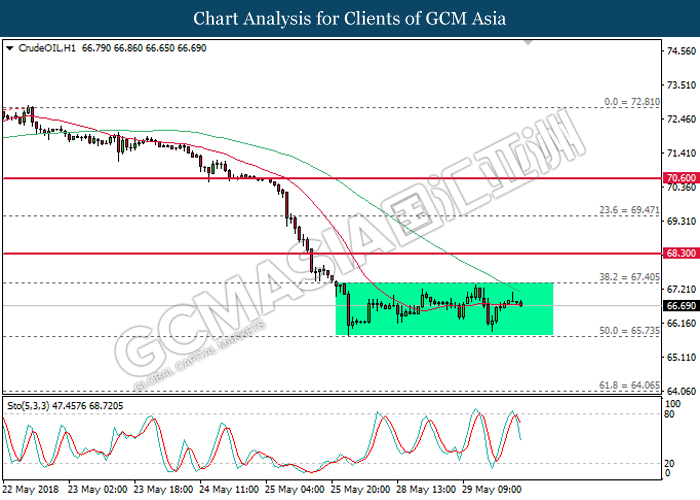
CrudeOIL, H4: Crude oil price extended gains following prior closure above the resistance level at 65.70. MACD histogram which illustrate upside bias suggests the commodity price to advance further upwards after closing above the 60-MA line (green).
Resistance level: 67.35, 68.30
Support level: 65.70, 64.10
GOLD
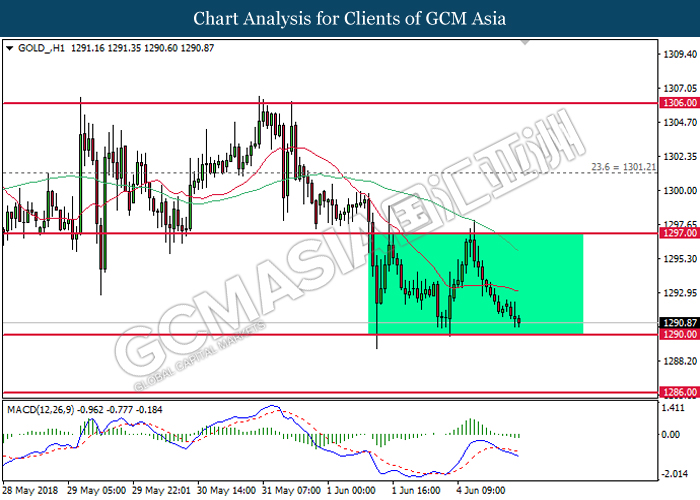
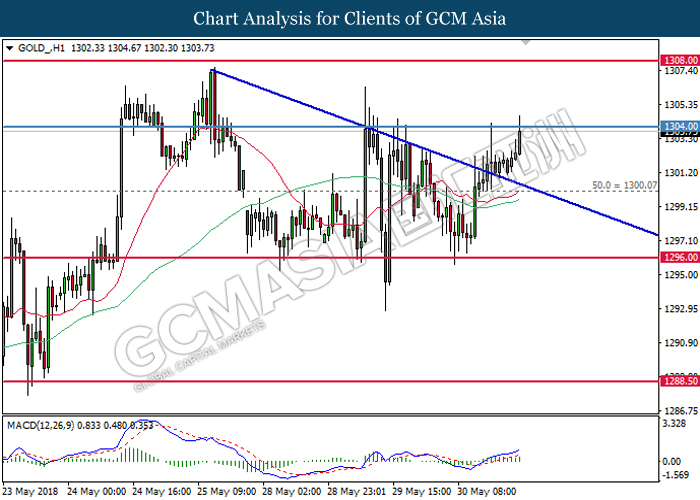
GOLD_, H1: Gold price remains traded within an ascending channel while currently testing at the bottom level. MACD histogram which illustrate downward signal suggests the commodity price to extend its losses after breaking the bottom level of the channel and target at 1296.00.
Resistance level: 1298.20, 1300.35
Support level: 1296.00, 1293.40
070618 Daily Analysis
7 June 2018 Daily Analysis
Dollar squandered as economic data softens.
Greenback depreciates sharply against its other major peers on yesterday over-the-backdrop of softer regional economic data while Euro extend its gains following hawkish comments from central bank members. The dollar index tumbled down 0.10% while last seen around 93.55 during early Asian trading session. According to US Bureau of Labor Statistics, regional worker productivity rose slower than economist’s expectation for the first quarter, coming in with a reading of 0.4% versus consensus of 0.7%. The bearish reading has diminished some bullish sentiment towards a stronger labor market in the long-run following optimistic jobs report from last Friday. In addition, the US dollar was held back further after European Central Bank (ECB) policymakers signaled to tighten their monetary policy sooner than later on yesterday. ECB chief economist Peter Praet postulate that ECB will debate whether to scale back their bond purchases gradually during their meeting next week. In addition, Euro received further buyback following diminished political uncertainty in Italy. Pairing of EUR/USD extended gains by 0.08% to $1.1784 as of writing.
Looking into the commodities market, crude oil price pared its losses by 0.25% to $65.12 per barrel after tumbling down on yesterday due to bearish US stockpiles data. According to Energy Information Administration, US crude stocks swelled up by 2.07 million barrels last week, missing economist expectation to reduce by 2.00 million barrels. On the other hand, gold price rose by 0.04% to $1,297.17 a troy ounce due to weaker dollar.
Today’s Holiday Market Close
Time Market Event
N/A
Today’s Highlight Events
Time Market Event
23:15 CAD BoC Gov Poloz Speaks
Todays’ Highlight Economy Data
| Time | Nation & Data | Previous | Forecast | Actual |
| 09:30 | AUD – Trade Balance (Apr) | 1.527B | 0.980B | – |
| 14:00 | EUR – German Factory Orders (MoM) (Apr) | -0.9% | 0.7% | – |
| 15:30 | GBP – Halifax House Price Index (MoM) (Apr) | -3.1% | 1.1% | – |
| 17:00 | EUR – GDP (QoQ) (Q1) | 0.4% | 0.4% | – |
| 20:30 | USD – Initial Jobless Claims | 221K | 223K | – |
GBPUSD
GBPUSD, H4: GBPUSD was traded higher following prior rebound from the support level at 1.3410. Both MA line which continues to expand upwards suggests the pair to continue its bullish bias, towards the direction of 1.3460.
Resistance level: 1.3460, 1.3530
Support level: 1.3410, 1.3360
EURUSD
EURUSD, H4: EURUSD extended gains after regaining some support near the threshold of 1.1650. MACD histogram which continues to illustrate bullish signal suggests the pair to extend its gains after breaking the resistance level at 1.1790.
Resistance level: 1.1790, 1.1865
Support level: 1.1740, 1.1650
USDJPY
USDJPY, H1: USDJPY remains traded within an ascending channel following recent retrace from the top level. MACD histogram which has formed a death cross signal suggests the pair to be traded lower in short-term in the event of a closure below the 20-MA line (red).
Resistance level: 110.55, 111.00
Support level: 110.00, 109.40
CrudeOIL
CrudeOIL, H1: Crude oil price remains traded within a tight range following prior retracement from the top level. Stochastic Oscillator which begin to form a retracement signal from the overbought region suggests the commodity price to be traded lower in short-term, towards the lower level of the range.
Resistance level: 65.70, 67.35
Support level: 64.10, 63.00
GOLD
GOLD_, H4: Gold price was traded lower following prior retracement from the resistance level of 1301.20. Diminishing upward momentum from the MACD histogram suggests the pair to extend its losses after closing below the 20-MA line (red).
Resistance level: 1297.00, 1301.20
Support level: 1290.00, 1282.10
060618 Daily Analysis
6 June 2018 Daily Analysis
Greenback relinquished as Euro retributes.
Greenback droops against other major peers on Tuesday following major buyback on the Euro while optimistic US economic data being dismissed by investors. The dollar index extended losses by 0.12% to 93.80 during early Asian trading hours. In the economic front, ISM reported that Non-Manufacturing PMI for the month of May ticks up to 58.6, beating economist forecast of only 57.9. Likewise, job openings in the US rose to a total of 6.7 million in April, exceeding economist expectation for a decrease to 6.5 million. However, the optimistic data failed to safe-guard a bullish rebound following bullish surge in the Euro due to diminished political risk. Major buyback came in after Italian Prime Minister Giuseppe Conte insist that they have never discuss the country’s exit from the EU economic zone, debunking previous speculation for such measures to be pushed forward. Likewise, the single common currency received further bullish support after reports postulate that European Central Bank may reveal their cut-off date to stop asset purchases next week, igniting speculation for an imminent monetary policy tightening up ahead. As such, pair of EUR/USD rose 0.12% to $1.1724 as of writing.
Pondering into the commodities market, crude oil price rebounds by 0.11% to $65.55 after American Petroleum Institute reported that US crude inventories was down by 2.03 million barrels last week. Market participants will now keep a close eye on a similar report by the highly regarded Energy Information Administration to gain further market signals. Similarly, gold price rose 0.06% to $1,297.35 a troy ounce as investors initiate a buyback on the commodity due to weaker US dollar.
Today’s Holiday Market Close
Time Market Event
N/A
Today’s Highlight Events
Time Market Event
N/A
Today’s Highlight Economy Data
| Time | Nation & Data | Previous | Forecast | Actual |
| 09:30 | AUD – GDP (QoQ) (Q1) | 0.4% | 0.8% | – |
| 20:30 | USD – Trade Balance (Apr) | -49.00B | -50.00B | – |
| 20:30 | USD – Unit Labour Costs (QoQ) (Q1) | 2.7% | 2.7% | – |
| 20:30 | CAD – Trade Balance (Apr) | -4.14B | -3.40B | – |
| 22:30 | CrudeOIL – Crude Oil Inventories | -3.620M | -1.824M | – |
| 22:30 | CrudeOIL – Gasoline Inventories | 0.534M | 0.587M | – |
GBPUSD
GBPUSD, H4: GBPUSD extended gains following prior rebound from the upward trendline at 1.3300. MACD histogram which has formed an upward signal suggests further bullish bias. However, a breakout from 1.3410 is required to attain further confirmation.
Resistance level: 1.3410, 1.3460
Support level: 1.3360, 1.3300
EURUSD
EURUSD, H1: EURUSD remains traded within an ascending channel while currently testing at the top level. MACD histogram which illustrate slightly diminished upward momentum suggests the pair to be traded lower in short-term as technical correction.
Resistance level: 1.1740, 1.1790
Support level: 1.1705, 1.1650
USDJPY
USDJPY, H1: USDJPY remains traded within an ascending channel while currently testing at the mid-level. Both MACD histogram and Stochastic Oscillator which illustrate downward signal may suggests the pair to be traded lower in short-term after closing below the 20-MA line (red).
Resistance level: 110.00, 111.55
Support level: 109.40, 108.85
CrudeOIL
CrudeOIL, H4: Crude oil price was traded higher while recently breakthrough the downward trendline. MACD histogram which illustrate positive divergence signal suggests the commodity price to extend its gains after successfully breaking the resistance level at 65.70.
Resistance level: 65.70, 67.35
Support level: 64.10, 63.00
GOLD
GOLD_, H4: Gold price was traded higher while currently testing near the strong resistance level at 1297.00. MACD histogram which illustrate the formation of golden cross signal suggests gold price to extend its gains in the event of a closure above the target of 1297.00 and 60-MA line (green).
Resistance level: 1297.00, 1301.20
Support level: 1290.00, 1282.10
050618 Daily Analysis
5 June 2018 Daily Analysis
Greenback stages its rebound as Italy stirs up politics.
US dollar pared its losses against other major currencies on yesterday over the backdrop of positive economic data while investors monitor imminent political risk arise from the formation of new government in Italy. The dollar index which measures its strength against a basket of six major currencies added up 0.04% to 93.96 during early Asian trading hours. Overnight, greenback rebounds from its prior one-week low after US Commerce Department reported that Non-Defense Capital Shipments rose 0.9% last month, beating economist expectation for a rise of up to 0.8%. However, gains on the currency were capped after Durable Goods Orders fell in line with economist forecast with a reading of -1.6% for last month. On the other hand, pairing of EUR/USD retreats from its one-week high, down 0.02% to $1.1698. The single common currency received a bearish blow since few weeks ago following higher political risk within the economic zone. Although administration crisis in Italy has been resolved since last Friday with the swearing in of new government formed by 5-Star Movement and League, both parties remained as anti-EU and may have clashes with Brussels in the long-run. For the time being, investors will anticipate parliamentary approval for 18-members of cabinet before setting out to overhaul EU rules and establish their policy.
For the commodities market, crude oil price backtracks its losses by 0.25% to $65.00 per barrel while gains remain limited as market prospect soured due to OPEC’s suggestion to ramp up daily production in order to offset diminished supplies from Iran and Venezuela. On the contrary, gold price was down 0.03% to $1,292.07 a troy ounce as US Federal Reserve is expected to hike their interest rate next week which could lead to diminishing appeal of the safe-haven asset.
Today’s Holiday Market Close
Time Market Event
N/A
Today’s Highlight Events
Time Market Event
12:30 AUD RBA Rate Statement
Today’s Highlight Economy Data
| Time | Nation & Data | Previous | Forecast | Actual |
| 07:30 | JPY – Household Spending (YoY) (Apr) | -0.7% | 0.8% | -1.3% |
| 09:45 | CNY – Caixin Services PMI (May) | 52.9 | 52.9 | – |
| 12:30 | AUD – RBA Interest Rate Decision (Jun) | 1.50% | 1.50% | – |
| 15:55 | EUR – German Services PMI (May) | 52.1 | 52.1 | – |
| 16:30 | GBP – Services PMI (May) | 52.8 | 52.9 | – |
| 22:00 | USD – ISM Non-Manufacturing Employment (May) | 53.6 | – | – |
| 22:00 | USD – ISM Non-Manufacturing PMI (May) | 56.8 | 57.9 | – |
| 22:00 | USD – JOLTs Job Openings (Apr) | 6.550M | 6.490M | – |
| 04:30 | CrudeOIL – API Weekly Crude Oil Stock | 1.001M | – | – |
GBPUSD
GBPUSD, H1: GBPUSD was traded lower following prior retracement and closure below the 60-MA line (green). Both MA lines which continues to narrow downwards suggests the pair to extend its losses towards the target at 1.3300.
Resistance level: 1.3360, 1.3410
Support level: 1.3300, 1.3260
EURUSD
EURUSD, H1: EURUSD remains traded within an ascending wedge while currently testing at the lower level. Both MACD histogram and Stochastic Oscillator which illustrate downward signal suggests bearish bias. Thus, a successful breakout from the bottom level would provide further validation.
Resistance level: 1.1740, 1.1815
Support level: 1.1650, 1.1600
USDJPY
USDJPY, H4: USDJPY extended gains following prior rebound from the support level at 109.40. Both MACD histogram and MA lines suggests further bullish bias for the pair. However, a close above the resistance level at 110.00 is required to attain further validation.
Resistance level: 110.00, 110.55
Support level: 109.40, 108.85
CrudeOIL
CrudeOIL, Daily: Crude oil price extended its losses following prior breakout from the upward trendline. MACD histogram which continues to illustrate persistent downward signal suggests the pair to extend its bearish bias and move towards the direction of support level near 64.10.
Resistance level: 65.70, 67.30
Support level: 64.10, 61.80
GOLD
GOLD_, H1: Gold price remains traded within a sideways channel while currently testing at the bottom level. MACD histogram which illustrate downward signal suggests further bearish bias. However, a breakout from 1290.00 is required to attain further confirmation.
Resistance level: 1297.00, 1301.20
Support level: 1290.00, 1286.00
040618 Weekly Analysis
4 June 2018 Weekly Analysis
GCMAsia Weekly Report: June 4 – 8
Market Review (Forex): May 28 – June 1
US dollar extended gains last Friday over the backdrop of optimistic jobs report which has further cemented the course for further monetary policy tightening by the Federal Reserve. The dollar index rose 0.18% while closing the week around 94.16 during late Friday trading.
According to the Bureau of Labor Statistics, the economy has generated 223,000 jobs last month, beating economist expectation for a reading of only 189,000 jobs. Concurrently, unemployment rate fell to 18-years low of 3.8%, hinting solid hiring up ahead as the Fed tightens their policy.
In addition, wage growth rose more than expected with 0.3% versus 0.2% seen, hinting further escalation in inflationary pressure for the long-run. The data has renewed market speculation that the Fed’s would add a fourth rate hike this year if wage growth remains consistent throughout the coming months.
However, gains on the greenback were capped while market participants weighed on current trade wars between the US and other countries. Last week, Trump administration slapped hefty tariffs over steel and aluminum from Europe, Mexico and Canada, escalating the issue to the brink of trade war.
US Nonfarm Payrolls
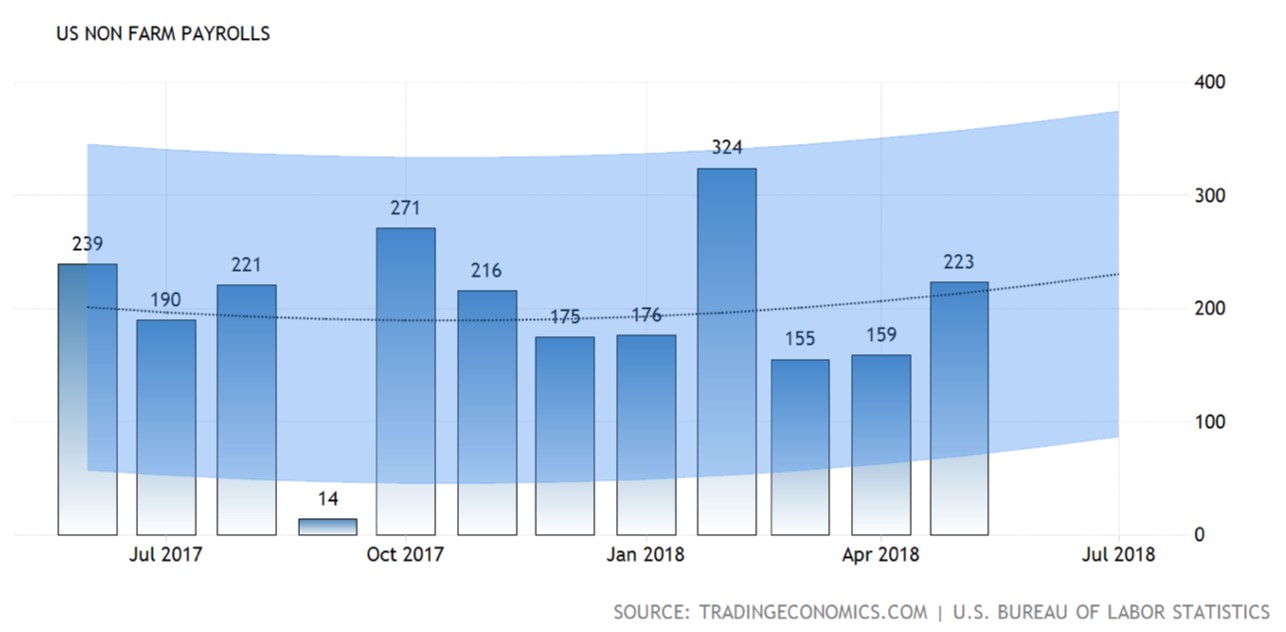
—– Forecast
US Nonfarm Payrolls report for the month of May came in at 223,000 jobs.
US Unemployment Rate
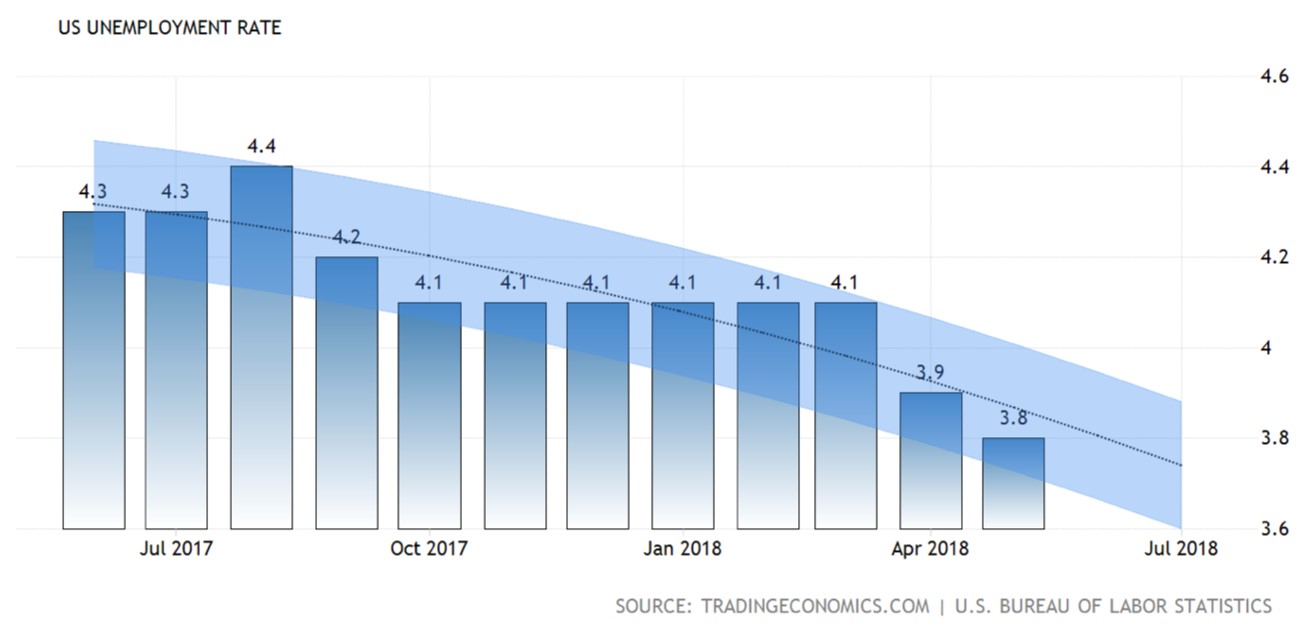
—– Forecast
US Unemployment rate ticked down by 0.1% to 18-years low of 3.8% for the month of May.
US Average Hourly Earnings
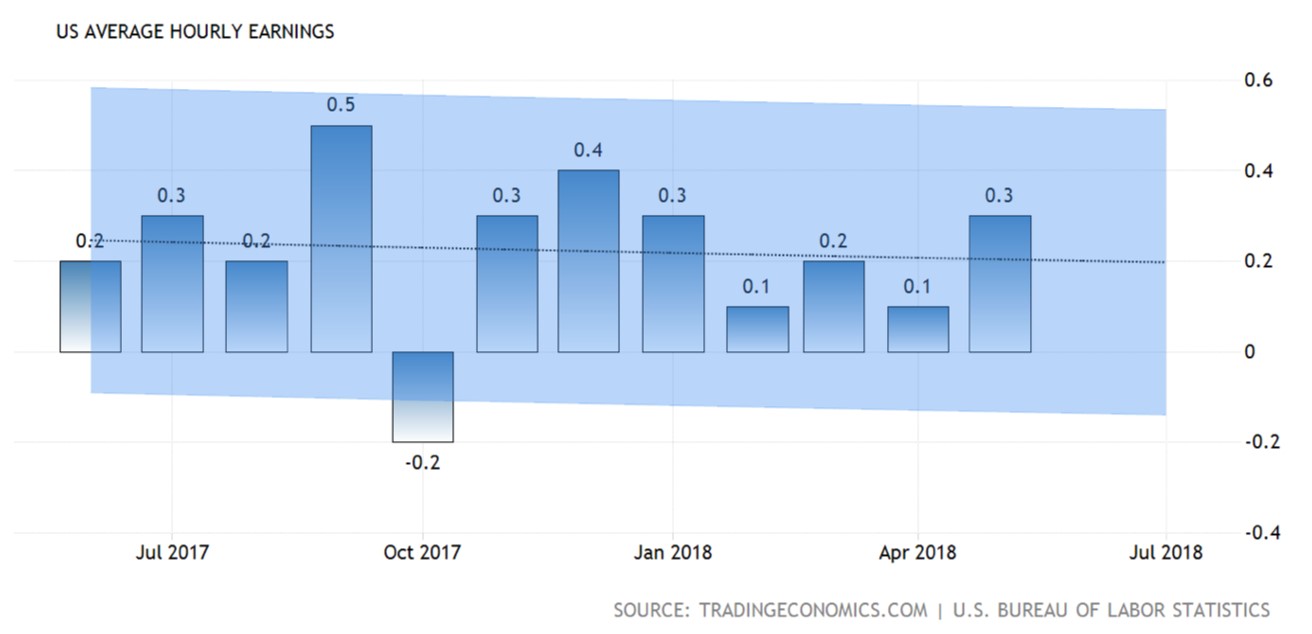
—– Forecast
US Average Hourly Earnings beats economist expectation with 0.3% versus 0.2% for the month of May.
USD/JPY
Pair of USD/JPY rose 0.65% to 109.53 during late Friday trading.
EUR/USD
Euro was down 0.27% to $1.1660 against the US dollar. The single common currency received further bearish pressure following political turmoil in Italy and Spain which may hinder economic progression and monetary policy tightening of the economic zone.
GBP/USD
Pairing of GBP/USD extended gains by 0.38% to $1.3348 after Chancellor Hammond suggests that the Bank of England will continue to normalize their policy as inflation hovers above their target of 2%.
Market Review (Commodities): May 28 – June 1
GOLD
Gold price fell sharply following the release of US NFP report last Friday while market participants continues to weigh between greenback’s appreciation and ongoing political turmoil in the EU zone. Price of the yellow metal settled down 0.39% while closing the week at $1,293.29 a troy ounce.
The precious metal came under pressure following large selloffs in the safe-haven assets mainly gold and Japanese yen while investors flock to US dollar following better-than-expected jobs report. However, losses on the commodity were capped as EU political turmoil continues to lend some support towards the safe-haven asset.
Crude Oil
Crude oil price extended its losses last Friday while posting its second weekly losses due to ongoing signs of US oil expansion and uncertainty over OPEC’s decision to ease their production limit. Price of the black commodity plunged 1.97% while ended the week at $65.71 per barrel.
According to the US services provider, Baker Hughes reported that the number of US oil rigs increased by 2 to 861, its highest level since March 13, 2015. An uptick in drilling activities came in tandem with Energy Information Administration’s report on Thursday which shows US oil production rose 215,000 barrels per day to a staggering record high of 10.47 million barrels per day in March.
Oil prices took a back foot for almost two weeks after OPEC and Russia suggested to increase their oil production in order to offset supply shortage from Venezuela and Iran. However, OPEC’s stance over the suggestion were still unknown as it will only be discussed during a meeting scheduled on 22nd of June.
Weekly Outlook: June 4 – 8
For the week ahead, investors will continue to scrutinize major economic release from the United States especially ISM Non-Manufacturing data in order to gauge current economic progression in the region. Otherwise, they will also place their attention over ECB President Mario Draghi’s speech on Tuesday to attain further clues with regards to the central bank’s monetary policy tightening and tapering plans.
As for oil traders, they will be eyeing on US inventories level reported by API and EIA to gauge the strength of crude demand for world’s largest oil consumer.
Highlighted economy data and events for the week: June 4 – 8
| Monday, June 4 |
Data AUD – Retail Sales (MoM) (Apr) GBP – Construction PMI (May) USD – Durable Goods Orders (MoM) USD – Factory Orders (MoM) (Apr)
Events N/A
|
| Tuesday, June 5 |
Data JPY – Household Spending (YoY) (Apr) AUD – RBA Interest Rate Decision (Jun) EUR – German Services PMI (May) GBP – Services PMI (May) USD – ISM Non-Manufacturing PMI (May) USD – ISM Non-Manufacturing Employment (May) USD – JOLTs Job Openings
Events AUD – RBA Rate Statement EUR – ECB President Draghi Speaks
|
| Wednesday, June 6 |
Data CrudeOIL – API Weekly Crude Oil Stock AUD – GDP (QoQ) (Q1) USD – Trade Balance (Apr) USD – Unit Labor Costs (QoQ) (Q1) CAD – Trade Balance (Apr) CAD – Ivey PMI (May) CrudeOIL – Crude Oil Inventories CrudeOIL – Gasoline Inventories
Events N/A
|
| Thursday, June 7 |
Data AUD – Trade balance (Apr) EUR – German Factory Orders (MoM) (Apr) GBP – Halifax House Price Index (MoM) (May) EUR – GDP (QoQ) (Q1) USD – Initial Jobless Claims
Events CAD – BoC Gov Poloz Speaks
|
|
Friday, June 8
|
Data JPY – GDP (QoQ) (Q1) CNY – Trade Balance (USD) (May) EUR – German Industrial Production (MoM) (Apr) EUR – German Trade Balance (Apr) GBP – Manufacturing Production (MoM) (Apr) CAD – Employment Change (May) CAD – Unemployment Rate (May) CrudeOIL – US Baker Hughes Oil Rig Count
Events N/A
|
Technical Weekly Outlook: June 4 – 8
Dollar Index
DOLLAR_INDX, Weekly: Dollar index extended gains following prior closure above the 60-MA line (green). However, diminishing upward momentum from MACD histogram may suggests the index to be traded lower in short-term as technical correction before continuing its bullish bias thereafter.
Resistance level: 94.20, 95.90
Support level: 92.15, 88.80
GBPUSD
GBPUSD, Daily: GBPUSD advance further up following prior rebound and closure above the threshold at 1.3300. MACD histogram which begins to form a golden cross signal suggests the pair to extend its bullish bias after closing above the 20-MA line (red).
Resistance level: 1.3445, 1.3600
Support level: 1.3300, 1.3170
USDJPY
USDJPY, Daily: USDJPY pared its prior losses following a rebound from the 60-MA line (green) near 108.25. MACD histogram which illustrate diminishing downward momentum suggests the pair to extend its gains after closing above the 20-MA line (red).
Resistance level: 110.50, 111.35
Support level: 109.35, 108.25
EURUSD
EURUSD, Daily: EURUSD pared its losses following prior rebound while closing above the resistance level at 1.1600. MACD histogram has begin to form an upward signal suggests the pair to extend its gains after closing above the resistance level near 1.1700 and 20-MA line (red).
Resistance level: 1.1700, 1.1850
Support level: 1.1600, 1.1445
GOLD
GOLD_, Daily: Gold price remained under pressure following prior retracement from the downward trendline. Both MA lines which continues to expand downwards suggests its prices to extend its losses, towards the support level at 1285.95.
Resistance level: 1300.00, 1312.70
Support level: 1285.95, 1266.90
Crude Oil
CrudeOIL, Daily: Crude oil price extended its losses following prior retracement from the 60-MA line (green). MACD histogram which illustrate downward signal suggests further bearish bias. However, a breakout from the upward trendline is required to attain further confirmation.
Resistance level: 67.30, 69.30
Support level: 65.70, 64.10
010618 Daily Analysis
1 June 2018 Daily Analysis
Greenback rebounds over robust fundamentals.
Greenback rebounds from its session low during North American trading hours following optimistic economic data from the region and a retreat in Euro despite diminishing political risk in the region. The dollar index was quoted up 0.02% to 93.90 during early Asian trading session. Overnight, Federal Reserve’s preferred inflation measure – Core PCE Price Index rose more than expected with 0.2%, beating economist forecast of only 0.1% for month-over-month comparison in April. In terms of jobs market, US Department of Labour reported a drop in Initial Jobless Claims last week, down by 13,000 individuals to a seasonally adjusted total of 221,000. Both data came helped the greenback to recover some losses after it received tremendous bearish bias following a rise in Euro and weaker-than-expected first quarter GDP reading. On the other hand, pair of EUR/USD was down 0.02% to $1.1690 while investors place their sole attention over political turmoil in Spain. Spain Prime Minister Mariano Rajoy is expected to face the no-confidence vote scheduled to take place later today after being called to step down following multiple graft allegation.
In the commodities market, crude oil price settled down by 0.07% to $66.98 per barrel despite massive draw in US crude supplies as US oil output continued its expansion by rising 215,000 barrels per day (bpd) to 10.47 million bpd in March. Otherwise, gold price rose 0.03% to $1,298.47 a troy ounce as investors monitor ongoing geopolitical tension around the globe.
Today’s Holiday Market Close
Time Market Event
N/A
Today’s Highlight Events
Time Market Event
08:30 USD FOMC Member Kaplan Speaks
20:55 USD FOMC Member Kashkari Speaks
Today’s Highlight Economy Data
| Time | Nation & Data | Previous | Forecast | Actual |
| 09:45 | CNY – Caixin Manufacturing PMI (May) | 51.1 | 51.3 | – |
| 15:55 | EUR – German Manufacturing PMI (May) | 56.8 | 56.8 | – |
| 16:30 | GBP – Manufacturing PMI (May) | 53.9 | 53.5 | – |
| 20:30 | USD – Average Hourly Earnings (MoM) (May) | 0.1% | 0.2% | – |
| 20:30 | USD – Nonfarm Payrolls (May) | 164K | 189K | – |
| 20:30 | USD – Unemployment Rate (May) | 3.9% | 3.9% | – |
| 22:00 | USD – ISM Manufacturing PMI (May) | 57.3 | 58.2 | – |
| 22:00 | USD – ISM Manufacturing Employment (May) | 54.2 | 54.5 | – |
| 01:00 | CrudeOIL – US Baker Hughes Oil Rig Count | 844 | – | – |
GBPUSD
GBPUSD, H1: GBPUSD was traded lower following prior breakout from the mini upward trendline. MACD histogram which begins to illustrate increasing downward momentum suggests the pair to extend its losses after closing below the 60-MA line (green).
Resistance level: 1.3300, 1.3345
Support level: 1.3260, 1.3220
EURUSD
EURUSD, H4: EURUSD was traded lower following prior retracement and closure below the target of 1.1700. MACD histogram which illustrate diminishing upward momentum may suggests the pair to be traded lower in short-term after a bearish retrace from the 60-MA line (green).
Resistance level: 1.1700, 1.1750
Support level: 1.1600, 1.1500
USDJPY
USDJPY, H4: USDJPY was traded higher after receiving some support from the threshold at 108.30. MACD histogram which illustrate persistent upward signal suggest the pair to extend its gains after breaking the resistance level at 108.85.
Resistance level: 108.85, 109.40
Support level: 108.30, 107.50
CrudeOIL
CrudeOIL, H4: Crude oil price extended losses following prior retracement from the resistance level at 68.30. MACD histogram which illustrate diminished upward momentum suggests the commodity price to extend its losses towards the direction of 65.75.
Resistance level: 67.40, 68.30
Support level: 65.75, 64.05
GOLD
GOLD_, H4: Gold price remains traded within a sideways channel while currently testing at the bottom level. MACD histogram which illustrate the formation of death cross suggests further bearish bias. However, a close below the support level at 1297.00 is required to attain further validation.
Resistance level: 1301.20, 1306.00
Support level: 1297.00, 1290.00
310518 Daily Analysis
31 May 2018 Daily Analysis
Euro recuperate as political conundrum recedes.
US dollar received a bearish turnaround following the release of pessimistic economic data while coupled with a relief in EU political risk. The dollar index recorded a loss of 0.09% while last quoted at 94.00 during Asian trading hours. Overnight, ADP Nonfarm Employment Change showed lesser-than-expected jobs generated in the private sector with 178,000 versus 186,000. The data which is highly correlated to Nonfarm Payrolls report has dimmed economist expectation towards the latter. Similarly, Gross Domestic Product advanced slower than expected during the first quarter with only 2.2% versus 2.3% seen. In addition, greenback received further selling pressure after risk aversion towards Euro-denominated asset subsides. Abrupt change upon investor’s risk appetite came after interim Prime Minister Carlo Cottarelli postulate that the discussion to form an interim government is progressing, attenuating investors’ fear towards imminent EU-Exit referendum that may arise from fresh election for the time being. Pairing of EUR/USD ticked down 0.05% while last seen at $1.1656.
Peering into the commodities market, crude oil price settled down 0.40% to $67.89 per barrel after American Petroleum Institute reported an increase in US crude stockpiles by 1.001M during last week. On the other hand, gold price rose 0.15% to $1,303.07 a troy ounce over the backdrop of weaker US dollar.
Today’s Holiday Market Close
Time Market Event
N/A
Today’s Highlight Events
Time Market Event
00:30 USD FOMC Member Bostic Speaks
01:00 USD FOMC Member Brainard Speaks
Today’s Highlight Economy Data
| Time | Nation & Data | Previous | Forecast | Actual |
| 07:50 | JPY – Industrial Production (MoM) (Apr) | 1.4% | 1.5% | 0.3% |
| 09:00 | CNY – Manufacturing PMI (May) | 51.4 | 51.4 | – |
| 09:00 | CNY – Non-Manufacturing PMI (May) | 54.8 | 54.8 | – |
| 17:00 | EUR – CPI (YoY) (May) | 1.3% | 1.6% | – |
| 20:30 | USD – Core PCE Price Index (MoM) (Apr) | 0.2% | 0.1% | – |
| 20:30 | USD – Initial Jobless Claims | 234K | 234K | – |
| 20:30 | USD – Personal Income (MoM) (Apr) | 0.3% | 0.3% | – |
| 20:30 | USD – Personal Spending (MoM) (Apr) | 0.4% | 0.4% | – |
| 20:30 | CAD – GDP (MoM) (Mar) | 0.4% | 0.2% | – |
| 22:00 | USD – Pending Home Sales (MoM) (Apr) | 0.4% | 1.1% | – |
| 23:00 | CrudeOIL – Crude Oil Inventories | 5.778M | 2.214M | – |
| 23:00 | CrudeOIL – Gasoline Inventories | 1.883M | – | – |
GBPUSD
GBPUSD, H4: GBPUSD was traded lower following prior retracement from the downward trendline. However, MACD histogram which illustrate upward signal may suggest the pair to extend its gains and retest near the downward trendline at 1.3300 in short-term.
Resistance level: 1.3300, 1.3400
Support level: 1.3220, 1.3140
EURUSD
EURUSD, H1: EURUSD was traded higher following prior breakout from the downward trendline. However, MACD histogram which illustrate diminishing upward momentum may suggests the pair to be traded lower in short-term as technical correction, towards the direction of 20-MA line (red).
Resistance level: 1.1700, 1.1750
Support level: 1.1600, 1.1500
USDJPY
USDJPY, H1: USDJPY remained traded within a descending channel following prior retracement from the top level. MACD histogram which has formed a death cross signal suggests the pair to extend its losses, towards the direction of support level at 108.30.
Resistance level: 108.85, 109.40
Support level: 108.30, 107.50
CrudeOIL
CrudeOIL, H1: Crude oil price was traded lower following prior retracement from the resistance level at 68.30. MACD histogram which illustrate diminished upward momentum may suggest the commodity price to extend its losses in short-term as technical correction, towards the 20-MA line (red).
Resistance level: 68.30, 69.45
Support level: 67.40, 65.75
GOLD
GOLD_, H1: Gold price extended gains following prior breakout from the top level of descending triangle. MACD histogram which illustrate upward signal suggests further bullish momentum. However, a close above the minor resistance at 1304.00 is required to attain further validation.
Resistance level: 1304.00, 1308.00
Support level: 1300.00, 1296.00
300518 Daily Analysis
30 May 2018 Daily Analysis
Dollar stands tall as EU-risk demoralize investors.
Greenback extended gains to fresh 6-months high against its major peers following high volume of selloff explicitly on the Euro over the backdrop of rising political uncertainty. During the Asian trading session, the dollar index rose 0.46% while last quotes around 94.75. Prior, Italy faces imminent calls for election after two anti-establishment party abandoned their plans to form a coalition government. Snap election could deliver a blow to the EU as the outcome would have chances to form a Eurosceptic government that could challenge Italy’s membership in the integrated economic region. As such, investors dialed down their volume of investment’s in the EU particularly Italian’s assets while flocking towards assets which is denominated in the US dollar. However, gains on the greenback remained capped after Conference Board revealed that consumer confidence in the US rose to only 128.0 versus forecast of 128.2 for the month of May. For the time being, investors will place their attention on major economic releases from the US such as ADP, PCE and NFP report to gauge its economic growth momentum and future monetary policy stance.
Peering into the commodities market, crude oil price ticked down 0.06% to $66.78 during early Asian trading session as investors fret over OPEC’s pledge to increase production to offset imminent supply shortage from Venezuela and Iran. On the contrary, gold price extended gains by 0.12% to $1,300.07 a troy ounce following mild risk aversion in the market due to political risk in the EU region.
Today’s Holiday Market Close
Time Market Event
N/A
Today’s Highlight Events
Time Market Event
09:10 NZD RBNZ Gov Orr Speaks
22:00 CAD BoC Rate Statement
Today’s Highlight Economy Data
| Time | Nation & Data | Previous | Forecast | Actual |
| 09:30 | AUD – Building Approvals (MoM) (Apr) | 2.6% | -3.0% | – |
| 14:00 | EUR – German Retail Sales (MoM) (Apr) | -0.6% | 0.7% | – |
| 16:00 | EUR – German Unemployment Change (May) | -7K | -10K | – |
| 16:00 | EUR – German Unemployment Rate (May) | 5.3% | 5.3% | – |
| 20:15 | USD – ADP Nonfarm Employment Change (May) | 204K | 190K | – |
| 20:30 | USD – GDP (QoQ) (Q1) | 2.35 | 2.3% | – |
| 20:30 | USD – GDP Price Index (QoQ) (Q1) | 2.0% | 2.0% | – |
| 20:30 | CAD – RMPI (MoM) (Apr) | 2.1% | – | – |
| 22:00 | CAD – BoC Interest Rate Decision | 1.25% | 1.25% | – |
| 04:30 | CrudeOIL – API Weekly Crude Oil Stock | -1.300M | – | – |
GBPUSD
GBPUSD, H4: GBPUSD extended its losses following prior breakout from the support level at 1.3300. However, MACD histogram which illustrate diminishing downward momentum may suggests the pair to be traded higher in short-term as technical correction before continuing its major bearish bias thereafter.
Resistance level: 1.3300, 1.3400
Support level: 1.3220, 1.3140
EURUSD
EURUSD, H1: EURUSD remained traded within a mini descending wedge following prior retracement from the upper level. Recent formation of retrace signal prior to the overbought region suggests the pair to be traded lower in short-term, towards the lower level of the formation.
Resistance level: 1.1600, 1.1665
Support level: 1.1500, 1.1450
USDJPY

USDJPY, H4: USDJPY extended its losses following prior closure below the strong support level at 108.85. MACD histogram which illustrate persistent downward signal suggests the pair to extend its losses after breaking the support level near 108.30.
Resistance level: 108.85, 109.40
Support level: 108.30, 107.50
CrudeOIL
CrudeOIL, H1: Crude oil price remains traded within a sideways channel following prior retracement from the top level. Stochastic Oscillator which illustrate retrace signal from the overbought regions suggests the commodity price to be traded lower in short-term after closing below the 20-MA line (red). Otherwise, long-term trend direction could only be determined following a successful breakout from either side of the channel.
Resistance level: 67.40, 68.30
Support level: 65.75, 64.05
GOLD
GOLD_, H1: Gold price remains traded within a narrowing triangle while currently testing at the top level. Due to the lack of clarity from MACD histogram and price action, it is suggested to enter the market after a successful breakout has occur from either side of the triangle.
Resistance level: 1308.00, 1314.95
Support level: 1300.00, 1296.00
290518 Daily Analysis
29 May 2018 Daily Analysis
Euro succumbed to political tempest.
Greenback remained fluoresce although two major markets were closed on yesterday following heightened political uncertainty in the European Union. The dollar index rose 0.24%, peaking at fresh 6 months high of 94.38 during Asian trading hours. Euro received tremendous selling pressure in the market after former IMF director Carlo Cottarelli was named as the stopgap Prime Minister of Italy. His appointment came amidst political and constitutional turmoil after two anti-establishment parties abandoned their plans to form a coalition following a veto from head of state to block the nomination of their choice for finance minister. Italy’s political unrest alongside with graft allegation made upon Spanish’s Prime Minister Mariano Rajoy may lead to a further setback on the union’s economy and thus spooking off investors towards the single common currency. Pair of EUR/USD was down 0.27% while hovering near six-months low of $1.1623.
As for commodities, crude oil price recovered its losses by 0.54% to $66.92 while gains remained limited as traders weighed the possibility of Organization of the Petroleum Exporting Countries (OPEC) and Russia in ceasing curbs on their daily production levels. Otherwise, gold price ticked down 0.03% to $1,297.50 as stronger dollar reduces the appeal of the commodity to holders of other currencies.
Today’s Holiday Market Close
Time Market Event
N/A
Today’s Highlight Events
Time Market Event
22:00 USD FOMC Member Bullard Speaks
Today’s Highlight Economy Data
| Time | Nation & Data | Previous | Forecast | Actual |
| 22:00 | USD – CB Consumer Confidence (May) | 128.7 | 128.2 | – |
GBPUSD
GBPUSD, H1: GBPUSD remains traded within a descending triangle following prior retracement from the upper level. Diminishing upward momentum from MACD histogram may suggests further bearish bias. However, a successful breakout from the strong support at 1.3300 is required to attain further confirmation.
Resistance level: 1.3345, 1.3400
Support level: 1.3300, 1.3215
EURUSD
EURUSD, H1: EURUSD was traded lower following prior breakout from the bottom level of descending wedge. Both MA lines which continues to expand downwards suggests the pair to advance further down, towards the direction of support level near 1.1600.
Resistance level: 1.1665, 1.1700
Support level: 1.1600, 1.1500
USDJPY
USDJPY, H1: USDJPY has recently broke out from the bottom level of ascending channel, signaling a change in trend direction to move further downwards. MACD histogram which has formed a death cross signal suggests the pair to extend its losses after breaking the support level at 108.85.
Resistance level: 109.40, 110.00
Support level: 108.85, 108.30
CrudeOIL
CrudeOIL, H4: Crude oil price was traded higher following a rebound near the support level at 65.75. Diminishing downward momentum from MACD histogram may suggests the crude oil price to be traded higher in short-term as technical correction before extend its bearish bias for the mid-term.
Resistance level: 67.40, 68.30
Support level: 65.75, 64.05
GOLD
GOLD_, H1: Gold price remains traded in an uptrend while currently testing at the strong threshold of 1300.00. MACD histogram and Stochastic Oscillator which illustrate upward signal suggests bullish bias. However, a successful close above 1300.00 is required to attain further validation.
Resistance level: 1300.00, 1308.00
Support level: 1296.00, 1288.50
280518 Weekly Analysis
28 May 2018 Weekly Analysis
GCMAsia Weekly Report: May 28 – June 1
Market Review (Forex): May 21 – 25
Greenback extended gains to fresh six-months high against a basket of major currencies following positive US economic data which is enough so sustain further rate hikes by the Federal Reserve. The dollar index rose 0.53% while closing the week at 94.25 last Friday.
According to the US Commerce Department, US Core Durable Goods Orders rose 0.9% for the month of April, beating economist expectation for a rise of only 0.5%. In conjunction with that, US Nondefense capital goods orders ex-aircraft rose 1.0%, showing higher regional business spending.
Both data suggests that the economy is performing well to resist any rate hikes by the Federal Reserve which is scheduled to have at least two more this year. However, gains on the dollar remained capped after Feds downplayed market expectation for a third rate hike this year following their reiteration to enable inflation to surpass their 2% target in order to maintain its sustainable momentum in the long-run.
US Core Durable Goods Orders
—– Forecast
US Core Durable Goods Orders came in at 0.9% versus consensus reading of 0.5% for the month of April.
USD/JPY
Pair of USD/JPY rose 0.16% to 109.43 during late Friday trading after North Korean leader Kim Jong-Un reiterate to negotiate with the United States at any time albeit President Donald Trump’s cancelation of next month’s highly anticipated summit between both countries.
EUR/USD
Pair of EUR/USD fell 0.59% to $1.1650 after Spanish Prime Minister Mariano Rajoy faces a no-confidence vote while Italian political uncertainty continues to weigh on the currency.
GBP/USD
GBP/USD extended losses by 0.63% to $1.3296 following higher demand for the greenback.
Market Review (Commodities): May 21 – 25
GOLD
Gold price depreciates slightly during late Friday trading following dollar’s resurgence while coupled with lower geopolitical risk from the Korean Peninsula. Price of the yellow commodity tumbled down by 0.25% while closing the week at $1,301.60 a troy ounce.
The safe-haven commodity pared some of its gains following a sharp rebound in the US dollar over-the-backdrop of better-than-expected economic data which warrants for further rate hike from the Federal Reserve.
Likewise, the precious metal sheds its gains further after North Korean leader Kim Jong-Un reiterates to held peace talk with the United States at any point of time despite Trump’s rhetoric to cancel the highly anticipated summit.
Crude Oil
Crude oil price plunged sharply as of last Friday following market signals to increase their oil production in order to prevent crude shortage from Iran and Venezuela. Price of the black commodity plunged 4.46% while closing the week at $67.42 per barrel.
Both Organization of the Petroleum Exporting Countries and Russia suggested to increase their oil output by dialing down the current production cut levels following lower oil production from two OPEC’s members – Iran and Venezuela.
Iran, one of the producers from OPEC may be subjected to US sanctions following President Donald Trump’s decision to withdraw from the Nuclear Agreement with the oil producing country. Likewise, oil production from Venezuela has taken a toll following political and civilian unrest in the oil nation due to dictatorial policies and non-recognition electoral results from the global community.
The increase in production is scheduled to be discuss in the next meeting among members and non-members of OPEC which is to be held in June at Vienna. Investors will keep an eye on the outcome of the meeting in order to attain further prospects with regards to the commodity price and future outlook.
Weekly Outlook: May 28 – June 1
For the week ahead, investors will be place their full attention on major economic reports from the United States such as Nonfarm Payrolls report and ADP Nonfarm Employment Change. Likewise, global geopolitical condition and current US-North Korea conundrum will also be sidelined in order to gauge investor’s sentiment towards the greenback and safe-haven assets.
As for oil traders, they will be eyeing on US inventories level reported by API and EIA to gauge the strength of crude demand for world’s largest oil consumer.
Highlighted economy data and events for the week: May 28 – June 1
| Monday, May 28 |
Data N/A
Events N/A
|
| Tuesday, May 29 |
Data USD – CB Consumer Confidence (May)
Events USD – FOMC Member Bullard Speaks
|
| Wednesday, May 30 |
Data AUD – Building Approvals (MoM) (Apr) EUR – German Unemployment Change (May) EUR – German Unemployment Rate (May) EUR – German CPI (MoM) (May) USD – ADP Nonfarm Employment Change (May) USD – GDP (QoQ) (Q1) USD – GDP Price Index (QoQ) (Q1) CAD – RMPI (MoM) (Apr) CAD – BoC Interest Rate Decision
Events NZD – RBNZ Gov Orr Speaks CAD – BoC Rate Statement
|
| Thursday, May 31 |
Data CrudeOIL – API Weekly Crude Oil Stock JPY – Industrial Production (MoM) (Apr) CNY – Manufacturing PMI (May) CNY – Non-Manufacturing PMI (May) EUR – German Retail Sales (MoM) (Apr) EUR – CPI (YoY) (May) USD – Core PCE Price Index (MoM) (Apr) USD – Initial Jobless Claims USD – Personal Income (MoM) (Apr) USD – Personal Spending (MoM) (Apr) CAD – GDP (MoM) (Mar) USD – Pending Home Sales (MoM) (Apr) CrudeOIL – Crude Oil Inventories CrudeOIL – Gasoline Inventories
Events N/A
|
|
Friday, June 1
|
Data CNY – Caixin Manufacturing PMI (May) EUR – German Manufacturing PMI (May) GBP – Manufacturing PMI (May) USD – Average Hourly Earnings (MoM) (May) USD – Nonfarm Payrolls (May) USD – Unemployment Rate (May) USD – ISM Manufacturing PMI (May) USD – ISM Manufacturing Employment (May) CrudeOIL – US Baker Hughes Oil Rig Count
Events USD – FOMC Member Bostic Speaks USD – FOMC Member Bullard Speaks USD – FOMC Member Kaplan Speaks USD – FOMC Member Kashkari Speaks
|
Technical Weekly Outlook: May 28 – June 1
Dollar Index
DOLLAR_INDX, Weekly: Dollar index extended gains following prior rebound from the support level at 92.15. MACD histogram which illustrate upward signal suggests further bullish bias. Thus, a successful close above the target of 94.20 would provide further clarification.
Resistance level: 94.20, 95.90
Support level: 92.15, 88.80
GBPUSD
GBPUSD, Daily: GBPUSD extended its losses after losing its support near 1.3445. MACD histogram and both MA lines which illustrate downward signal and momentum suggests the pair to advance further downwards after breaking the support level near 1.3300.
Resistance level: 1.3445, 1.3600
Support level: 1.3300, 1.3170
USDJPY
USDJPY, Daily: USDJPY was traded lower following prior breakout from the upward trend line. MACD histogram which illustrate downward signal suggests the pair to extend its losses after successfully breaking the support level at 109.35.
Resistance level: 110.50, 111.35
Support level: 109.35, 108.25
EURUSD
EURUSD, Daily: EURUSD was traded higher following prior rebound while currently testing at 1.1700. MACD histogram which illustrate the formation of upward signal may suggests the pair to be traded higher in short-term as technical correction before extending its bearish bias thereafter.
Resistance level: 1.1700, 1.1850
Support level: 1.1600, 1.1445
GOLD
GOLD_, Daily: Gold price was traded lower following prior retracement from the 20-MA line (red). Stochastic Oscillator which illustrate the formation of retrace signal from the overbought region suggests the commodity price to extend its losses, towards the direction of support level near 1285.95.
Resistance level: 1300.00, 1312.70
Support level: 1285.95, 1266.90
Crude Oil
CrudeOIL, Daily: Crude oil price plunged sharply following previous retracement from the resistance level at 72.50. MACD histogram which illustrate bearish signal suggest the commodity price to extend its losses after breaking the strong support level at 67.30.
Resistance level: 69.30, 72.50
Support level: 67.30, 65.70
250518 Daily Analysis
25 May 2018 Daily Analysis
Dollar slumps over negative economic data and renewed geopolitical tensions.
Dollar index was traded lower against its major peers by 0.23% to 93.80 as of writing following the release of bearish economic data in the region and President Trump’s cancellation of planned summit with North Korea. Overnight, Greenback took a hit after the Commerce Department reported reduction in existing home sales by 2.5% in April, much higher than the expected reading for a fall of 0.2%. In addition, initial jobless claims recorded gains of 11,000 to a seasonally adjusted 234,000 last week versus the expected reading for a drop to only 220,000. Moreover, Greenback suffered massive selling after the White House stated it would be “inappropriate” to discuss possible denuclearization with North Korea leader Kim Jong Un which was previously scheduled to be held on June 12 in Singapore following open hostility displayed in the recent statement of the latter party. On the contrary, GBP/USD rose 0.25% to $1.3369 after retail sales reflected an actual gains of 1.6% versus the forecast reading of 0.8% in April.
In the commodities market, crude oil price fell 1.57% to $70.71 per barrel as the oil market was continuously being haunted by fears over OPEC and its allies to scale back production cut as a measure to counter possible oil shortage in global market. Otherwise, gold price rose 1.18% to $1302.51 a troy ounce following the summit between U.S. and North Korea was being called off by the White House, thus triggering renewed geopolitical tensions.
Today’s Holiday Market Close
Time Market Event
N/A
Today’s Highlight Events
Time Market Event
21:00 USD Fed Chair Powell Speaks
23:45 USD FOMC Member Bostic Speaks
23:45 USD FOMC Member Kaplan Speaks
Today’s Highlight Economy Data
| Time | Nation & Data | Previous | Forecast | Actual |
| 07:30 | JPY – Tokyo Core CPI (YoY) (Mar) | 0.6% | 0.6% | 0.5% |
| 16:00 | EUR – German Ifo Business Climate Index (May) | 102.1 | 101.9 | – |
| 16:30 | GBP – GDP (QoQ) (Q1) | 0.1% | 0.1% | – |
| 20:30 | USD – Core Durable Goods Orders (MoM) (Apr) | -0.1% | 0.5% | – |
| 22:00 | USD – Michigan Consumer Sentiment (May) | 98.8 | 98.8 | – |
| 01:00 | CrudeOIL – US Baker Hughes Oil Rig Count | 844 | – | – |
GBPUSD
GBPUSD, H1: GBPUSD was traded lower prior retracement from resistance level at 1.3400. Death-cross as displayed by MACD signal line would suggest the pair to extend its losses towards the support level at 1.3330.
Resistance level: 1.3400, 1.3450
Support level: 1.3330, 1.3270
EURUSD
EURUSD, H1: EURUSD was traded lower prior breaking support level at 1.1720. Death-cross as displayed by MACD signal line would suggest the pair to extend its losses towards the next support level at 1.1680.
Resistance level: 1.1720, 1.1770
Support level: 1.1680, 1.1610
USDJPY
USDJPY, H1: USDJPY was traded higher prior breaking resistance level at 109.30. Positive divergence as displayed by MACD signal line would suggest the pair to extend its gains towards the next resistance level at 109.70.
Resistance level: 109.70, 110.00
Support level: 109.30, 108.90
CrudeOIL
CrudeOIL, H1: Crude oil price was traded lower after breaking support level at 71.20. However, golden-cross as shown by MACD signal line would suggest the commodity price to undergo short-term technical correction to trade higher before continuing its bearish bias.
Resistance level: 71.20, 71.80
Support level: 70.60, 69.80
GOLD
GOLD_, H1: Gold price was traded lower prior retracement from resistance level at 1305.20. Formation of death cross by MACD signal line would suggest the safe-haven asset price to extend its losses towards the support level at 1300.50.
Resistance level: 1305.20, 1310.40
Support level: 1300.50, 1296.30
240518 Daily Analysis
24 May 2018 Daily Analysis
Greenback retraces over dovish FOMC statement and Trump’s new tariff plan.
Dollar index was down by 0.12% to 93.79 as of writing following dovish FOMC statement while Trump’s new US auto tariff proposal continued to weigh on the Greenback. Overnight, the FOMC Committee released their statement that there was a lack of urgency to tighten monetary policy in a more aggressive pace given that “modestly above 2 percent would be consistent with the committee’s symmetric inflation target and could be helpful in anchoring inflation expectations in the long run”. In addition, according to the administration officials and industry executives, US President Trump and his administration is looking into using national-security laws to impose new tariffs on vehicle imports, thus provoking market participants’ concerns over the risks of global trade war. On the other hand, GBP/USD fell 0.67% to $1.3355 following the release of worse-than-expected Consumer Price Index (CPI) data in April, last stood at 2.4% versus the expected reading of 2.5%, thus lowering investors’ expectations towards the Bank of England (BoE) to increase its interest rates within a shorter timeframe.
In the commodities market, crude oil price fell by 0.15% to $71.63 per barrel following expectations over the potential increase in OPEC output in response to make up for reduced supply from Iran and Venezuela. Otherwise, gold price rose 0.20% to $1294.00 a troy ounce in the wake of recent geopolitical uncertainty as triggered by Trump’s new tariff plan.
Today’s Holiday Market Close
Time Market Event
N/A
Today’s Highlight Events
Time Market Event
16:00 GBP BoE Gov Carney Speaks
16:15 USD FOMC Member Dudley Speaks
19:30 EUR ECB Publishes Account of Monetary Policy Meeting
22:35 USD FOMC Member Bostic Speaks
Tentative (Fri) EUR BoE Gov Carney Speaks
02:00 (Fri) USD FOMC Member Harker Speaks
Today’s Highlight Economy Data
| Time | Nation & Data | Previous | Forecast | Actual |
| 14:00 | EUR – German GDP (QoQ) (Q1) | 0.3% | 0.3% | – |
| 14:00 | EUR – GfK German Consumer Climate (Jun) | 10.8 | 10.8 | – |
| 16:30 | GBP – Retail Sales (MoM) (Apr) | -1.2% | 0.7% | – |
| 20:30 | USD – Initial Jobless Claims | 222K | 220K | – |
| 22:00 | USD – Existing Home Sales (Apr) | 1.1% | – | – |
GBPUSD
GBPUSD, H4: GBPUSD was traded higher prior breaking resistance level at 1.3330. MACD signal line that shows continuous weakness would suggest the pair to continue its losses towards the support level at 1.3330.
Resistance level: 1.3400, 1.3450
Support level: 1.3330, 1.3270
EURUSD
EURUSD, H4: EURUSD was traded higher prior rebound from support level at 1.1680. MACD signal line that shows continuous bearish momentum would suggest the pair to extend its losses to retest the said support level.
Resistance level: 1.1730, 1.1780
Support level: 1.1680, 1.1630
USDJPY
USDJPY, H1: USDJPY was traded lower after breaking support level at 110.00. Death-cross as displayed by MACD signal line would suggest the pair to extend its losses if candlestick successfully closes below the support level at 109.60.
Resistance level: 110.00, 110.40
Support level: 109.60, 109.30
CrudeOIL
CrudeOIL, H1: Crude oil price was traded lower prior its failure to break resistance level at 71.75. MACD signal line that portrays weakness in bullish momentum would suggest the commodity price to extend its losses if candlestick closes below the previous low.
Resistance level: 71.80, 72.20
Support level: 71.20, 70.60
GOLD
GOLD_, H4: Gold price was traded in consolidation with absence of significant indication from both candlestick pattern formation and MACD. Thus, a breakout is required to grasp the direction of price movement for the yellow metal in short-term.
Resistance level: 1296.30, 1300.50
Support level: 1288.60, 1285.30
230518 Daily Analysis
23 May 2018 Daily Analysis
Dollar retraces ahead FOMC meeting minutes.
Dollar index was down 0.08% against a trade-weighted basket of major currencies to 93.40 as of writing following absence of economic catalysts while investors sold their long position on the Greenback ahead the release of FOMC meeting minutes due tomorrow morning (GMT+8). In spite of that, market still portrays optimistic sentiment towards the Fed to tighten its monetary policy in the coming meeting minutes due to recent rise in bond yields as well as healthy economic growth as displayed by most of the recent economic data. On the contrary, Euro suffered losses against the Greenback by 0.16% to $1.1780 following continuous political uncertainty in Italy and economic recession in the European zone.
In the commodities market, crude oil price fell 0.24% to $72.00 per barrel off its 3.5 year highs following prospect over the OPEC to increase its oil output next month after the former expressed its concerns over Iranian supply curb and falling Venezuelan output. Otherwise, gold price rose 0.14% to $1292.80 a troy ounce following recent retracement of the Greenback.
Today’s Holiday Market Close
Time Market Event
N/A
Today’s Highlight Events
Time Market Event
02:00 (Thu) USD FOMC Meeting Minutes
Today’s Highlight Economy Data
| Time | Nation & Data | Previous | Forecast | Actual |
| 14:00 | EUR – German GDP (QoQ) (Q1) | 0.6% | 0.3% | – |
| 15:30 | EUR – German Manufacturing PMI (May) | 58.1 | 57.8 | – |
| 16:00 | EUR – Manufacturing PMI (May) | 56.2 | 56.0 | – |
| 16:00 | EUR – Markit Composite PMI (May) | 55.1 | 55.0 | – |
| 16:00 | EUR – Services PMI (May) | 54.7 | 54.7 | – |
| 16:30 | GBP – CPI (YoY) (Apr) | 2.5% | 2.5% | – |
| 22:00 | USD – New Home Sales (Apr) | 694K | 679K | – |
| 21:45 | USD – Manufacturing PMI (May) | 56.5 | 56.5 | – |
| 21:45 | USD – Markit Composite PMI (May) | 54.9 | – | – |
| 22:00 | USD – Services PMI (May) | 54.6 | 54.9 | – |
| 22:30 | CrudeOIL – Crude Oil Inventories | -1.404M | -0.763M | – |
| 22:30 | CrudeOIL – Gasoline Inventories | -3.790M | -1.421M | – |
GBPUSD
GBPUSD, H1: GBPUSD was traded lower prior breaking support level at 1.3450. MACD signal line that portrays weakness of bullish momentum would suggest the pair to extend its losses if breakout at the trend line of ascending triangle is successful.
Resistance level: 1.3450, 1.3510
Support level: 1.3400, 1.3330
EURUSD
EURUSD, H4: EURUSD was traded lower after retracement from resistance level at 1.1830. MACD signal line that is about to form a death-cross would suggest the pair to extend its losses if it successfully closes candlestick below the 38.2 Fibonacci level.
Resistance level: 1.1780, 1.1830
Support level: 1.1740, 1.1680
USDJPY
USDJPY, H4: USDJPY was traded lower after breaking support level at 111.00. MACD signal line that portrays continuous downside momentum would suggest the pair to extend its losses towards the support level at 110.40.
Resistance level: 111.00, 111.40
Support level: 110.40, 110.00
CrudeOIL
CrudeOIL, H4: Crude oil price was traded lower after breaking support level at 72.20. Death-cross as displayed by MACD signal line would suggest the commodity price to extend its losses towards the support level at 71.70.
Resistance level: 72.20, 72.80
Support level: 71.70, 71.20
GOLD
GOLD_, H4: Gold price was traded lower prior retracement from resistance level at 1295.20. MACD signal line that is about to form a death-cross would suggest the safe-haven asset price to extend its losses if candlestick successfully closes below its previous low.
Resistance level: 1295.20, 1300.40
Support level: 1285.30, 1275.90
220518 Daily Analysis
22 May 2018 Daily Analysis
Dollar-bull smitten as Euro rebounds sharply.
US dollar eased from its five-months peak as bullish support falters due to strong recovery of Euro from its multi-months low. The dollar index which measures its strength against a basket of six major currencies was down 0.15% to 93.40 as of writing. During yesterday’s Asian session, the greenback received some bullish support following US Treasury Steven Mnuchin call for a pause on the US-China trade war, triggering a short-term wave of buybacks on the dollar against the safe-haven Japanese yen. However, the dollar turned bearish as we entered into the North American session after investors returned to the Euro equity market which received a large selloff due to higher political risk which stemmed from Italy. The formation of coalition government between Five-Star Movement and League that proposes large sum of fiscal spending agitated investors which may jeopardize Italy’s sovereign credit rating. Pairing of EUR/USD was traded flat at around $1.1791 during Asian trading session.
Peering into the commodities market, crude oil price was down 0.19% to $72.42 per barrel as investors begin to cash in their profit after peaking at fresh three-and-a-half-years high of $72.65 on yesterday. The bullish momentum was evoked after last weekend’s election in Venezuela is viewed as illegitimate while raising the prospect of US sanctions to be imposed on the country’s oil export. Otherwise, gold price extended gains by 0.03% to $1,292.61 a troy ounce over the backdrop of a weaker dollar.
Today’s Holiday Market Close
Time Market Event
All Day HKD Hong Kong – The Birthday of the Buddha
Today’s Highlight Events
Time Market Event
16:15 GBP BoE Gov Carney Speaks
17:00 GBP Inflation Report Hearings
Today’s Highlight Economy Data
| Time | Nation & Data | Previous | Forecast | Actual |
| 18:00 | GBP – CBI Industrial Trends Orders (May) | 4 | 2 | – |
| 20:30 | CAD – Wholesale Sales (MoM) (Mar) | -0.8% | 0.9% | – |
| 04:30 | CrudeOIL – API Weekly Crude Oil Stock | 4.854M | – | – |
GBPUSD
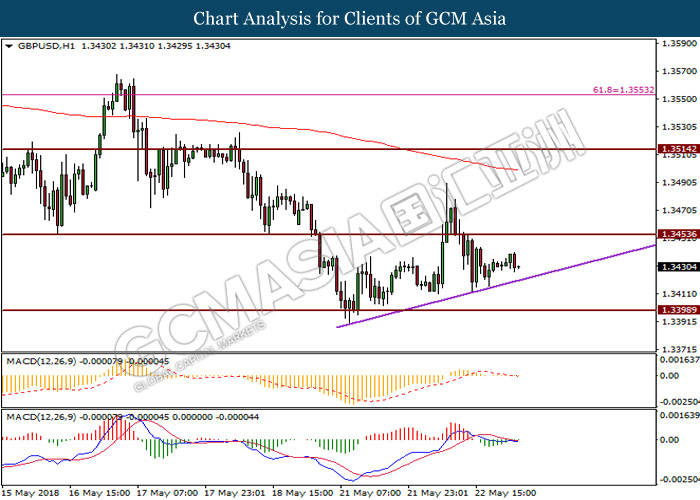
GBPUSD, H4: GBPUSD was traded higher following prior rebound from the psychological support of 1.3400. MACD histogram which illustrate diminishing downward momentum may suggests the pair to be traded higher in short-term as technical correction before extending its losses in tandem with the current major downward trendline.
Resistance level: 1.3505, 1.3600
Support level: 1.3400, 1.3245
EURUSD
EURUSD, H4: EURUSD was traded higher following prior rebound from the support level of 1.1725. Recent formation of upward signal from the MACD histogram may suggest the pair to extend its gains in short-term after successfully breaking the resistance level at 1.1790. Otherwise, long-term trend direction is still skewed towards bearish.
Resistance level: 1.1790, 1.1870
Support level: 1.1725, 1.1665
USDJPY
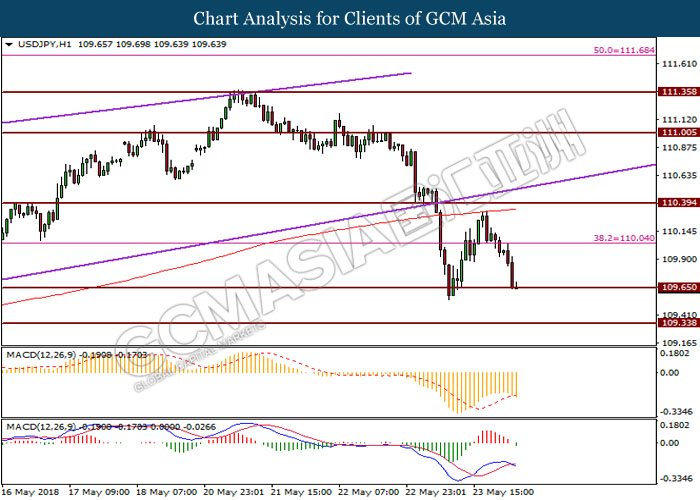
USDJPY, H4: USDJPY was traded lower following prior retracement and closure below the threshold of 111.00. Recent formation of negative divergence signal from MACD histogram may suggest the pair to extend its losses after successfully closing below the 20-MA line (red).
Resistance level: 111.00, 111.65
Support level: 110.55, 109.90
CrudeOIL
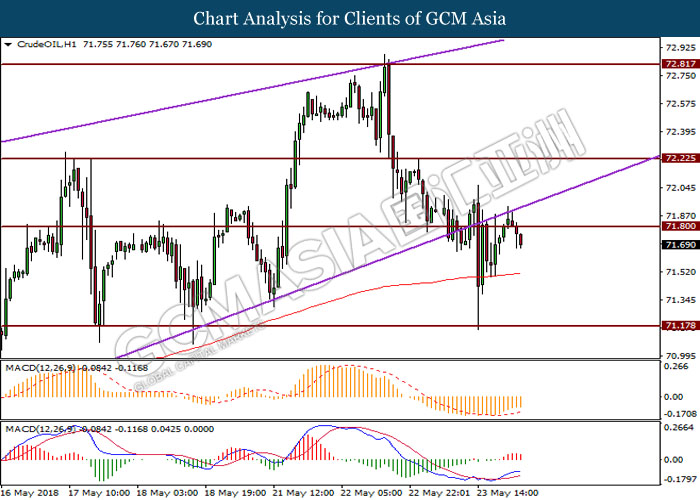
CrudeOIL, Daily: Crude oil price extended its major bullish trending following prior rebound from the 20-MA line (red). Both MA line which continues to expand upwards suggests the commodity price to advance further up, towards the target of resistance level near 73.80.
Resistance level: 73.80, 77.75
Support level: 68.60, 66.10
GOLD
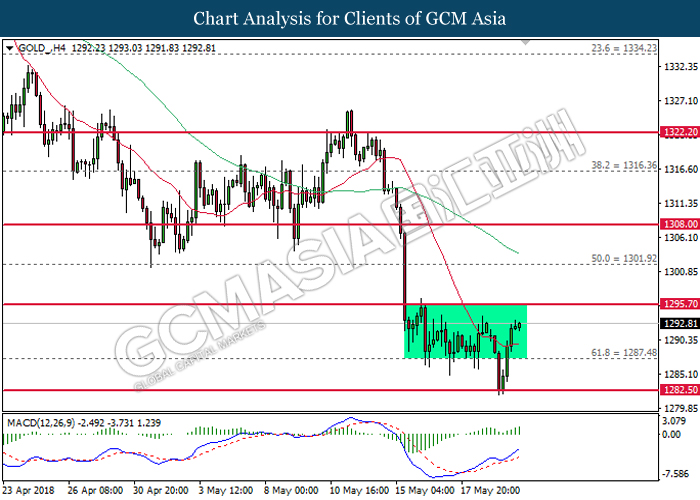
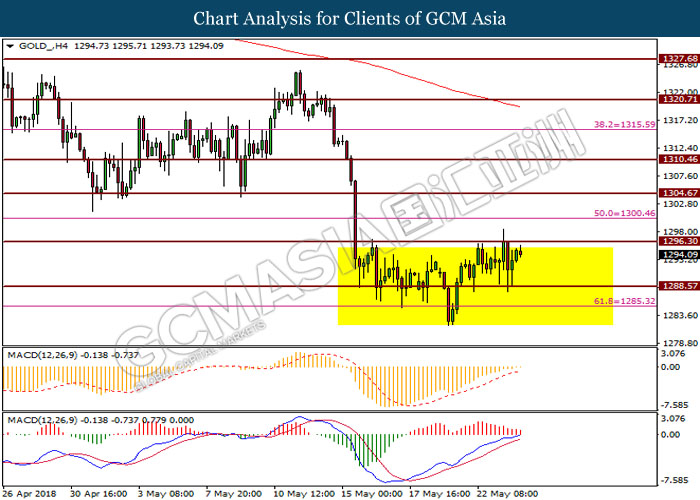
GOLD_, H4: Gold price re-entered into the sideways channel following prior rebound from the support level of 1282.50. Recent formation of upward signal from MACD histogram may suggests the commodity price to advance further up in short-term, towards the direction of resistance level near 1295.70.
Resistance level: 1295.70, 1301.90
Support level: 1287.50, 1282.50