091017 Weekly Analysis
9 October 2017 Weekly Analysis
GCMAsia Weekly Report: October 9 – 13
Market Review (Forex): October 2 – 6
U.S. Dollar
Greenback retreats slightly during late Friday trading amid fresh worries over the tension between United States and North Korea; shadowing a rather optimistic jobs report outlook for the month of September. The dollar index depreciated by 0.16% while ended the week at 93.62 after touching two-months high of 94.10.
The currency received some selling pressure amid fresh reports that North Korea may be preparing to test a long-range missile during their Party Foundation Day which lands on 10th October. Such escalation in geopolitical risk has lead the greenback to give up some gains after last month’s jobs data was seen as a potential driver for higher inflation in the coming period.
Although US economy has lost 33,000 jobs last month, Labor Department reiterated that the decline was mainly propelled by the effects of Hurricanes Irma and Harvey. In a rather positive note, national unemployment rate ticked down by 0.2% to its lowest level since 2001 with only 4.2%. Furthermore, average hourly earnings break the silence from its previous subdued performance with an increase of 2.9% while comparing year-over-year.
The uptick in wage inflation has lifted market sentiment that the Federal Reserve would follow through their place with another rate hike by year, thus limiting any losses caused rising risk from the Korean Peninsula.
US Nonfarm Payrolls
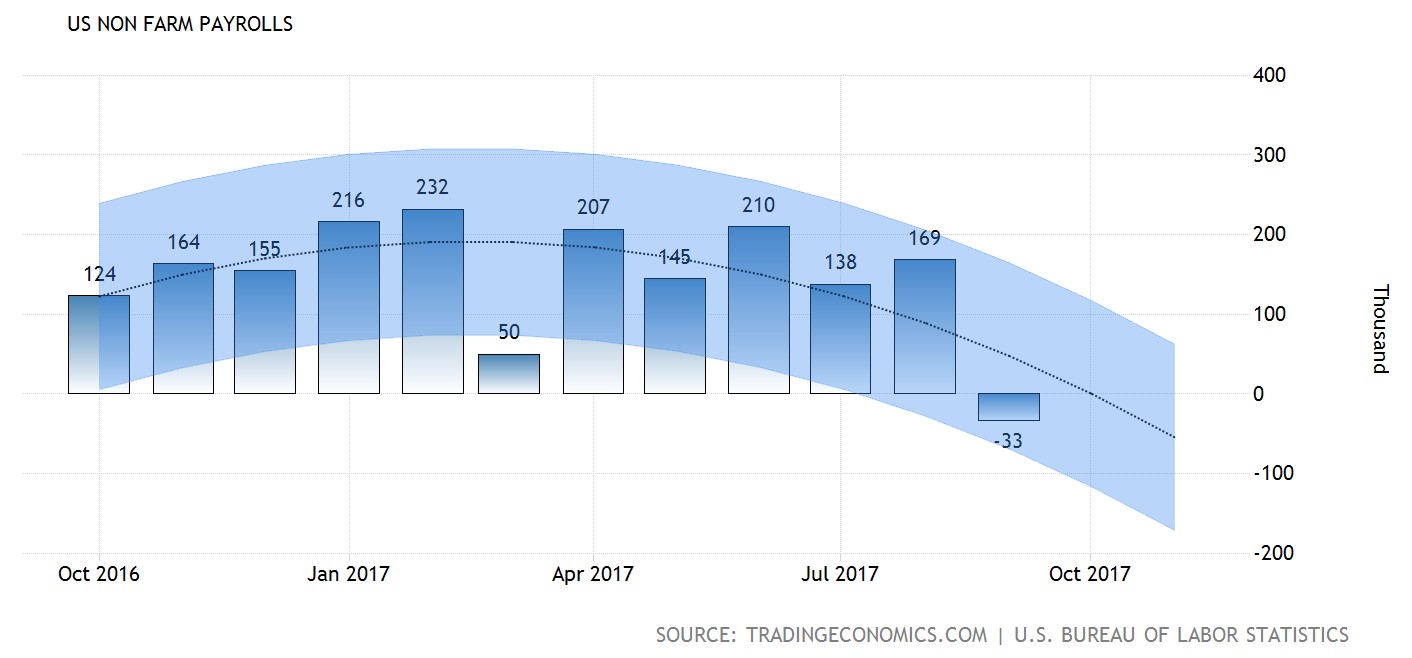
—– Forecast
US Nonfarm Payrolls for the month of September recorded a loss of 33,000 jobs due to tropical storm in the south coast.
US Unemployment Rate
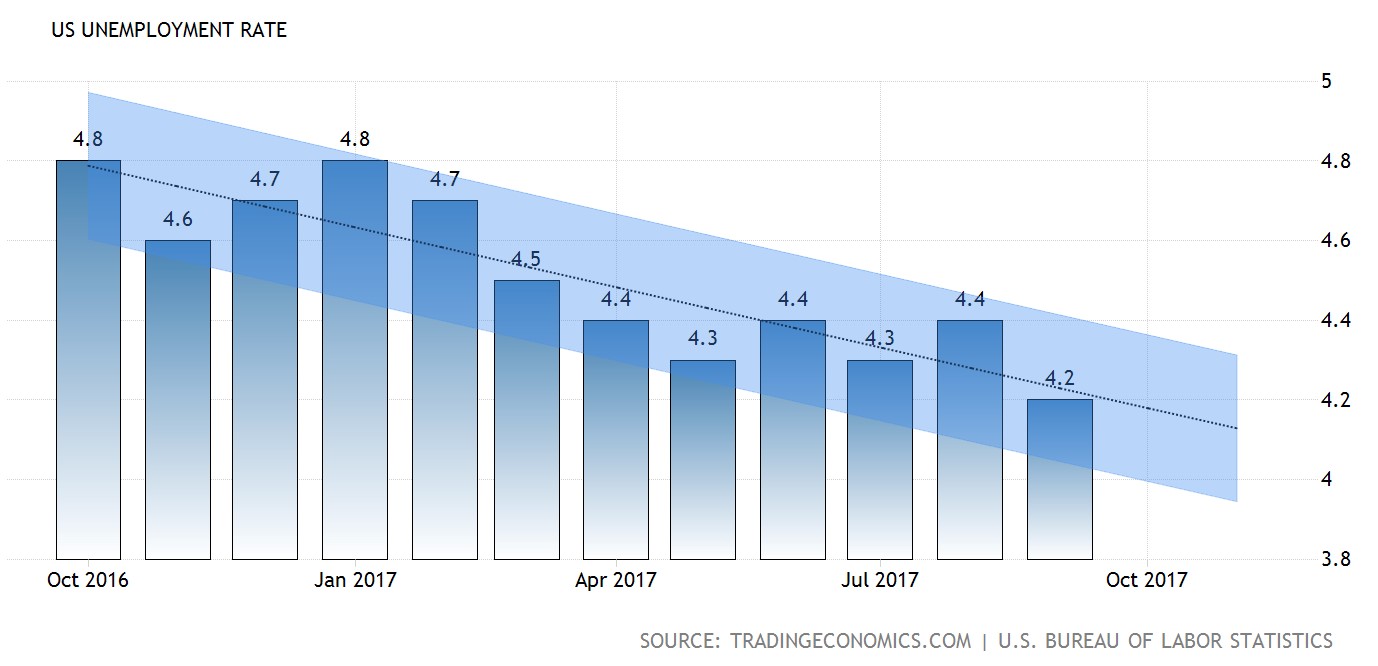
—– Forecast
US Unemployment rate ticked down to 4.2%, its lowest since 2001.
US Average Hourly Earnings
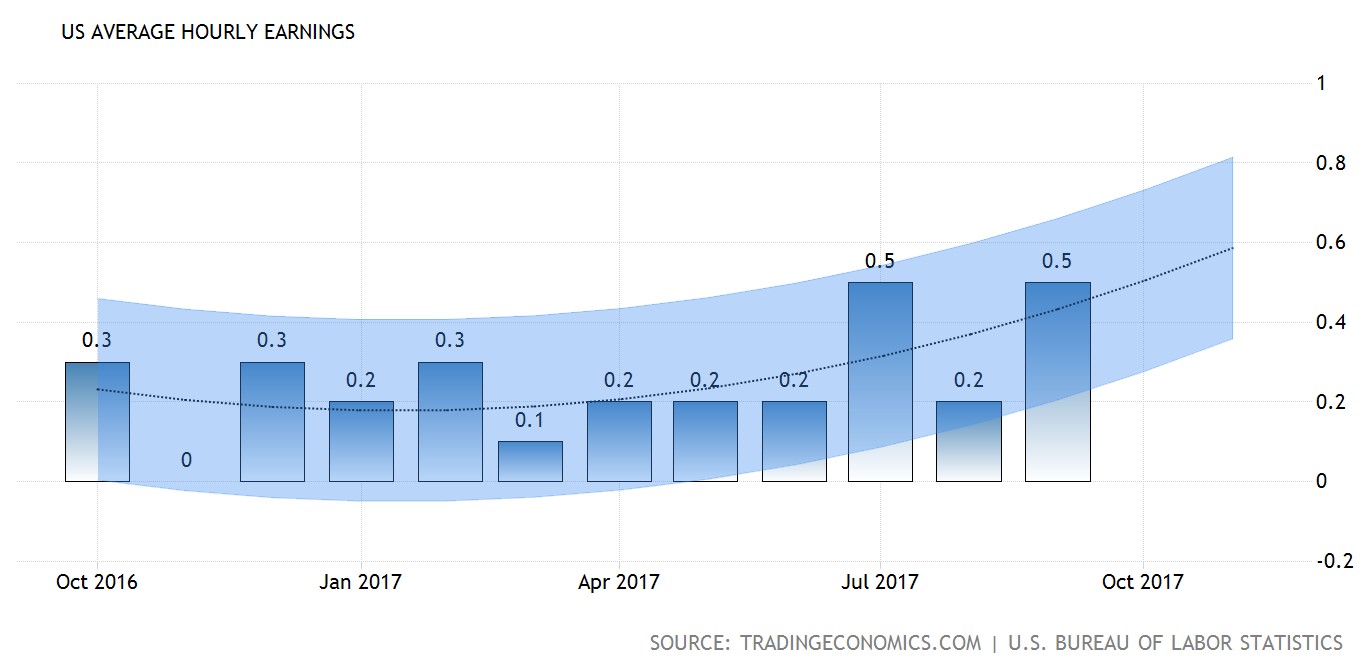
—– Forecast
US Average Hourly Earnings rose 0.5%, raising overall expectation for an interest rate hike by year end.
USD/JPY
Pair of USD/JPY pared its gains by 0.17% to 112.62 in a late trading session.
EUR/USD
Euro recovers by 0.18% to $1.1732 against the greenback, while snapping off some losses due to lack of signal from the European Central Bank regarding their future monetary policy view.
GBP/USD
Pound sterling extended its losses by 0.4% to $1.3056 against the US dollar while recorded its largest weekly decline in more than a year due to onset Brexit risk.
Market Review (Commodities): October 2 – 6
GOLD
Gold prices rebounds from its two months’ low on Friday amid fresh risk at the Korean Peninsula which has spooked off some investors to safe-haven assets. Price of the yellow metal rose 0.48% while ended the week around $1,279.26. However, gains that were achieved by the safe-haven assets remained limited as majority of the market participants expects for an interest rate hike by December.
According to the Fed Rate Monitor Tool, investors are currently pricing in at 87.8% chance for a 25 basis points hike in December as the labor market extends its path towards full employment status. Gold prices are highly sensitive to rising rates as it could lift the opportunity cost for holding non-yielding assets while boosting the dollar which it is priced in.
Crude Oil
Crude oil price plunged on Friday while snapping its multi-week bullish recovery amid renewed oversupply concern in the market. Its prices declined by more than $1.50 or 3% and ended the week below the $50 threshold of $49.29. Otherwise, investors will now shift their focus towards a potential disruption in crude oil production and refinery activities as Tropical Storm Nate approaches the Gulf of Mexico.
In an original deal struck nearly a year ago, OPEC and 10 other non-members has decided to cut their production collectively by 1.8 million barrels a day for six months. The agreement was then extended in May for a period of nine months until March next year in an effort to rebalance global supply and demand which were hindered by rising output from non-participating countries such as US, Nigeria and Libya. The cartel and its non-members will be meeting again in Vienna at November 30th over possibility to extend the agreement beyond 2018 if necessary.
Weekly Outlook: October 9 – 13
For the week, investors will be looking forward for FOMC Meeting Minutes which were due on Wednesday for fresh clues regarding the timing of next interest rate hike Friday’s US data on inflation and retail sales will also be in focus. For the European region, speech given by ECB President Mario Draghi will be scrutinized for signals on when the central bank would shift away from its ultra-loose policy and taper its bond purchasing program.
As for oil traders, they will be eyeing on US inventories level reported by API and EIA to gauge the strength of crude demand for world’s largest oil consumer. In addition, market participants will also be waiting on US President Donald Trump’s decision on Thursday with regards to Iran’s violation to the international nuclear deal. The nation is one of the key OPEC member and Middle Eastern oil producer.
Highlighted economy data and events for the week: October 9 – 13
| Monday, October 9 |
Data CNY – Caixin Services PMI (Sep) EUR – German Industrial Production (MoM) (Aug)
Events N/A
|
| Tuesday, October 10 |
Data AUD – NAB Business Confidence (Sep) EUR – German Trade Balance (Aug) CNY – New Loans GBP – Manufacturing Production (MoM) (Aug) GBP – Trade Balance (Aug) CAD – Housing Starts (Sep) CAD – Building Permits (MoM) (Aug)
Events USD – FOMC Member Kashkari Speaks
|
| Wednesday, October 11 |
Data USD – JOLTs Job Openings (Aug)
Events CrudeOIL – OPEC Monthly Report USD – FOMC Meeting Minutes USD – FOMC Member Williams Speaks
|
| Thursday, October 12 |
Data CrudeOIL – API Weekly Crude Oil Stock EUR – Industrial Production (MoM) (Aug) USD – Initial Jobless Claims USD – PPI (MoM) (Sep) CAD – New Housing Price Index (MoM) (Aug) CrudeOIL – Crude Oil Inventories
Events CrudeOIL – IEA Monthly Report USD – FOMC Member Brainard Speaks USD – FOMC Member Powell Speaks EUR – ECB President Draghi Speaks
|
|
Friday, October 13
|
Data CNY – Trade Balance (USD) (Sep) EUR – German CPI (MoM) (Sep) USD – Core CPI (MoM) (Sep) USD – Core Retail Sales (MoM) (Sep) USD – Retail Sales (MoM) (Sep) USD – Michigan Consumer Sentiment (Oct) CrudeOIL – US Baker Hughes Oil Rig Count
Events N/A
|
Technical weekly outlook: October 9 – 13
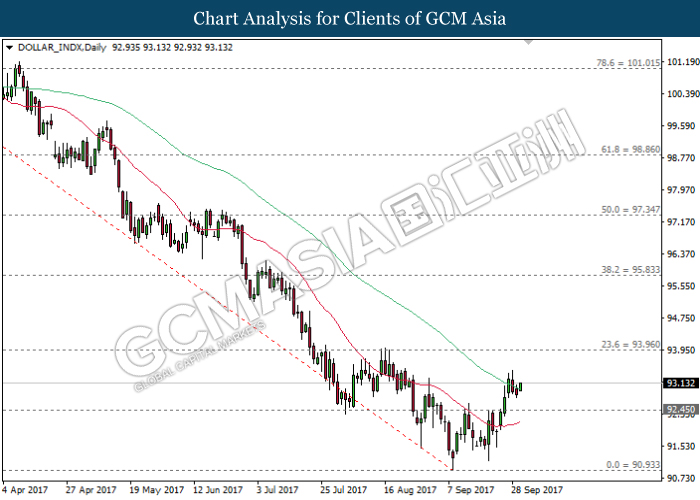
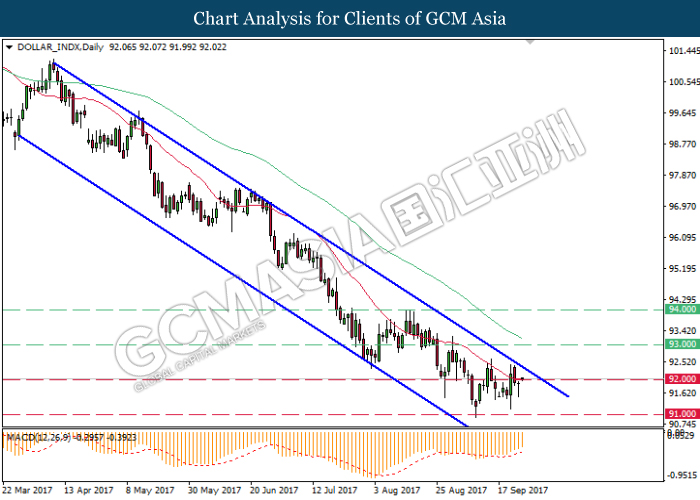
Dollar Index
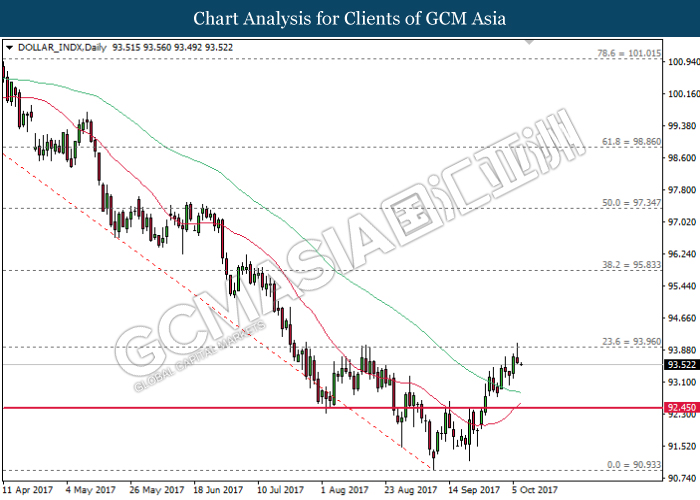
DOLLAR_INDX, Daily: Dollar index was traded lower following prior retracement from the 23.6 Fibonacci level of 93.95. Such price action suggests short-term retracement for the dollar index while the upward narrowing of both MA lines advocates for further upside bias after closing above the level of 93.95.
Resistance level: 93.95, 95.85
Support level: 92.45, 90.95
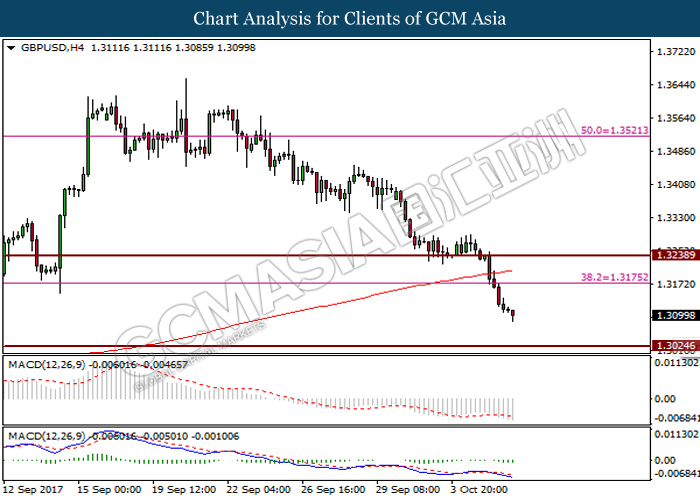
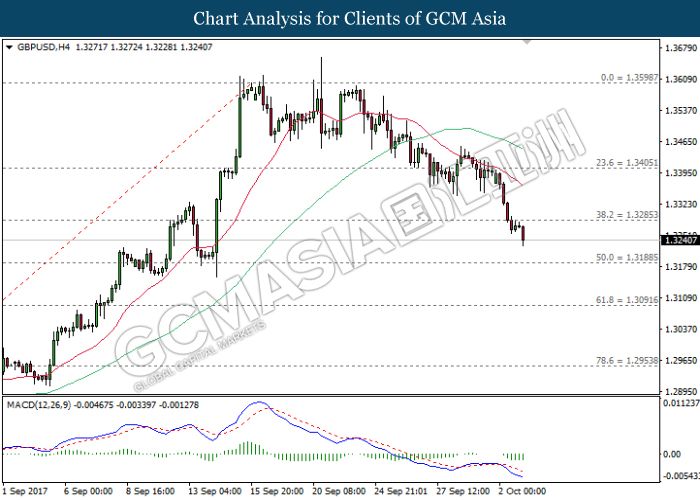
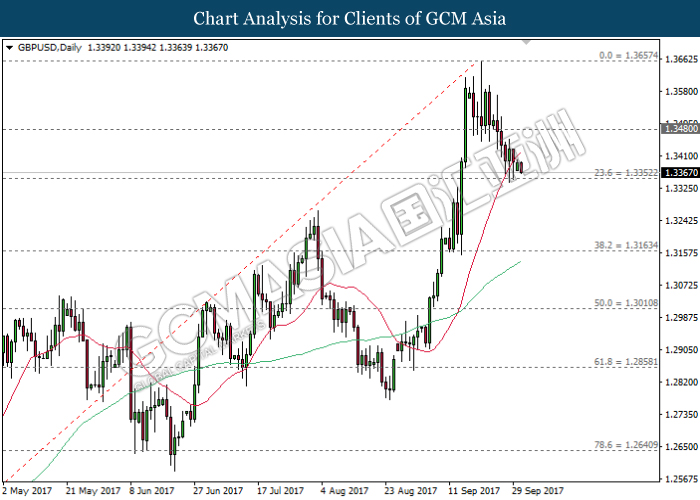
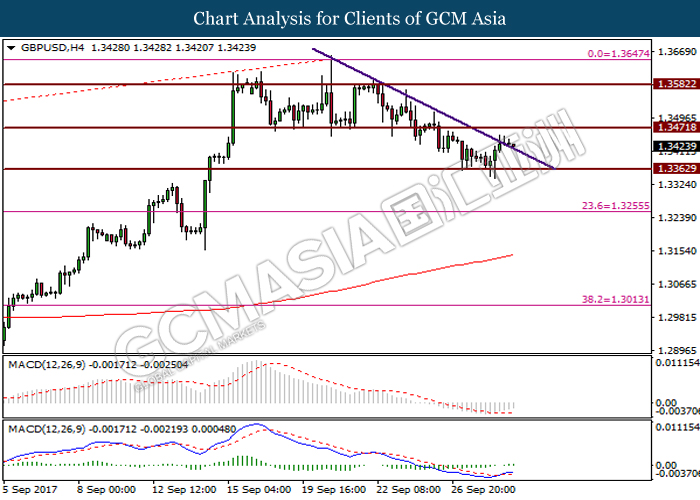
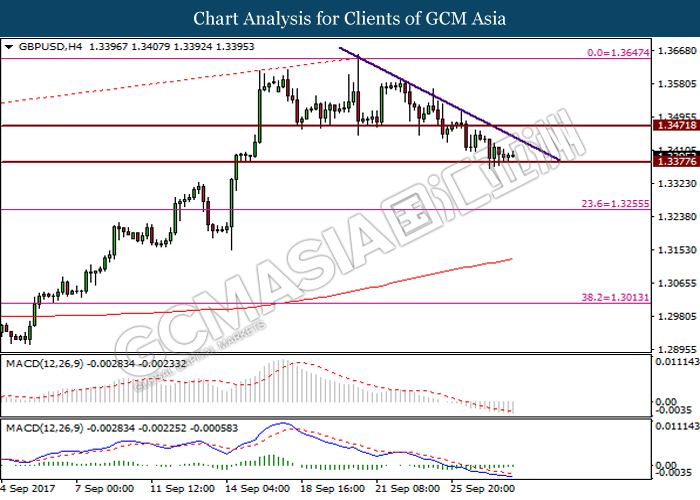
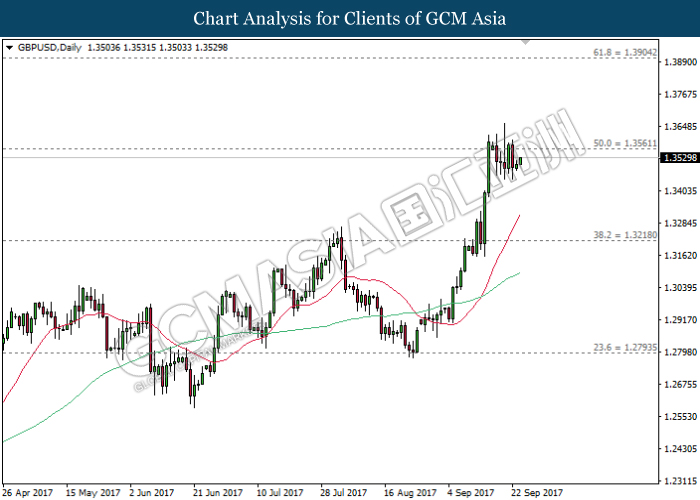
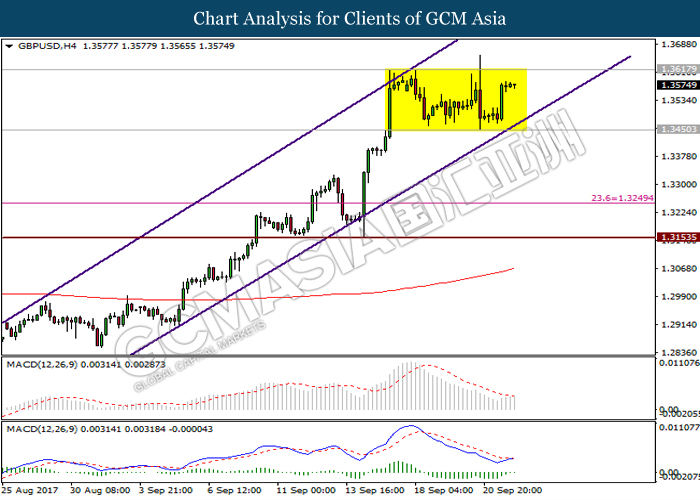
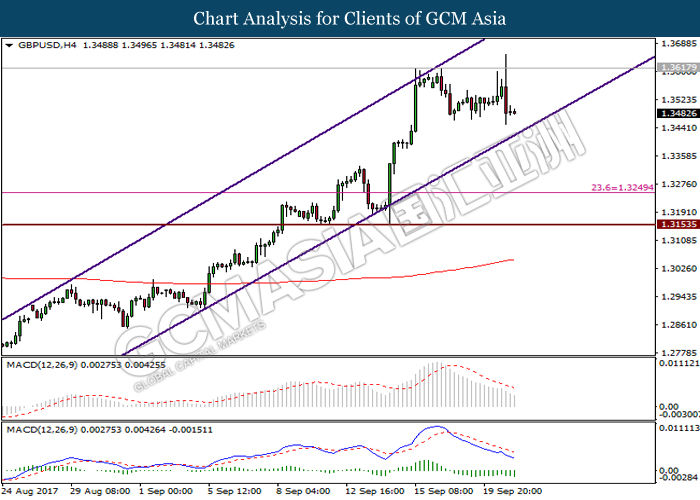
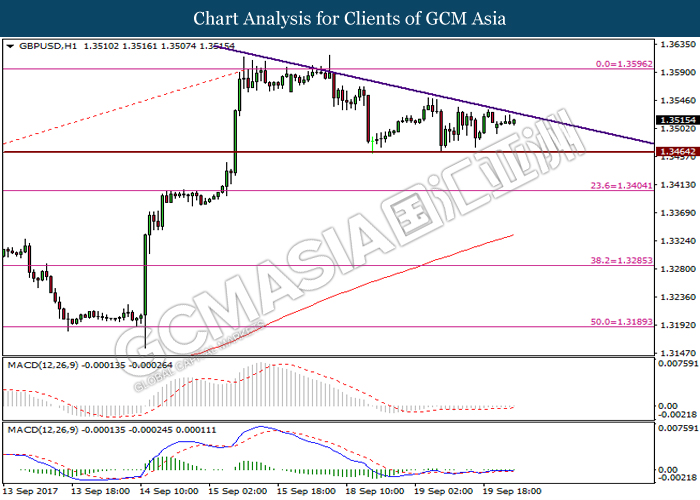
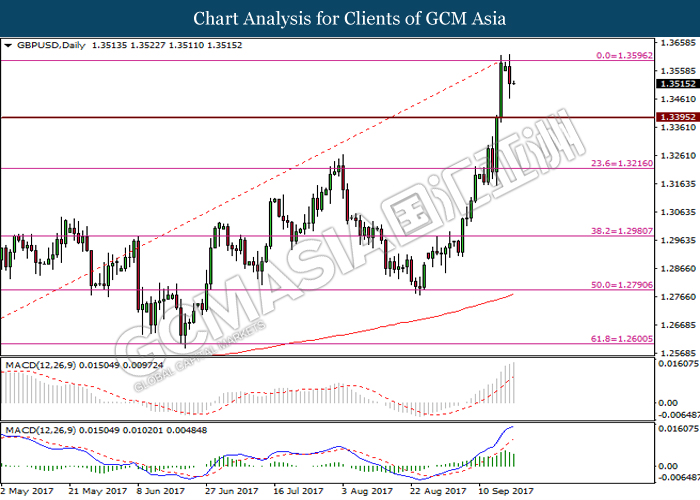
GBPUSD
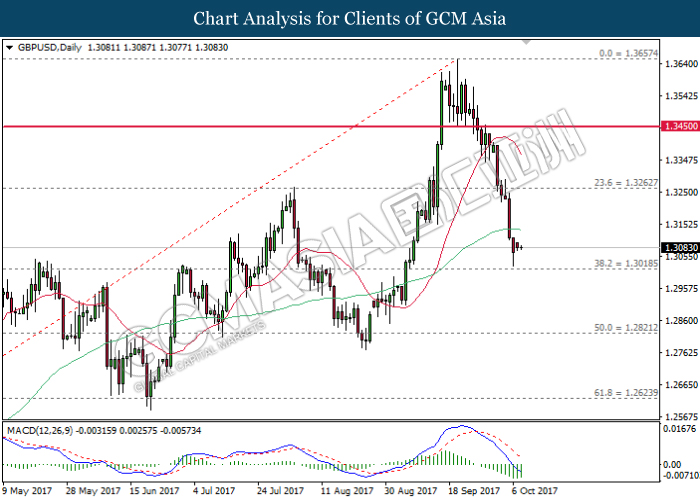
GBPUSD, Daily: GBPUSD extended its losses following prior closure below the 20-MA line (red). Signal line from MACD histogram which continues to expand downwards suggests the pair to advance further down and retest at the support level of 1.3020.
Resistance level: 1.3260, 1.3450
Support level: 1.3020, 1.2820
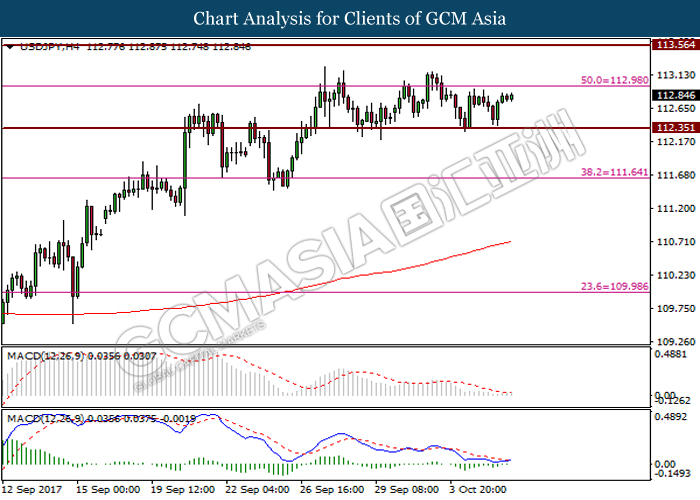
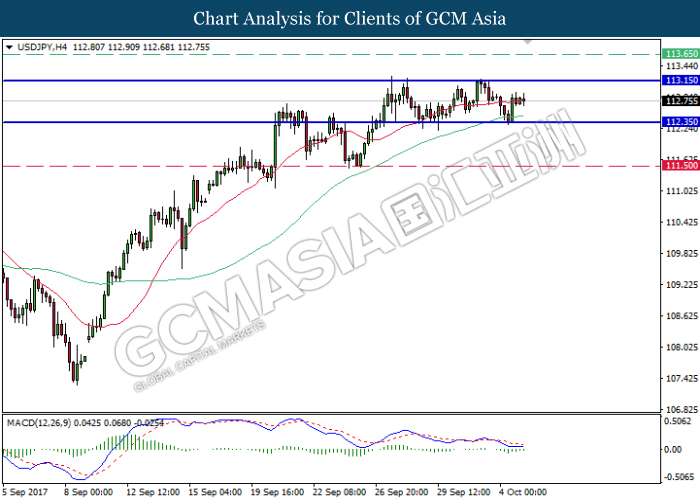
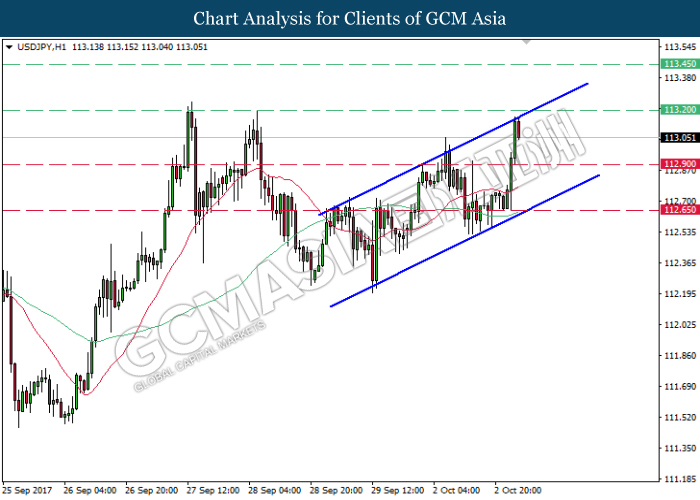
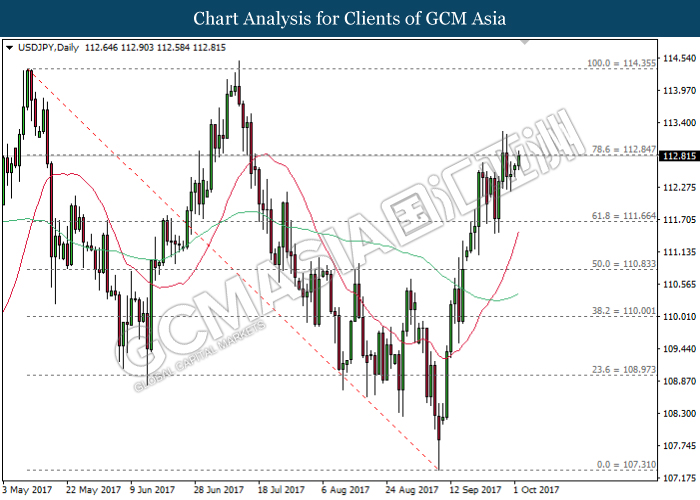
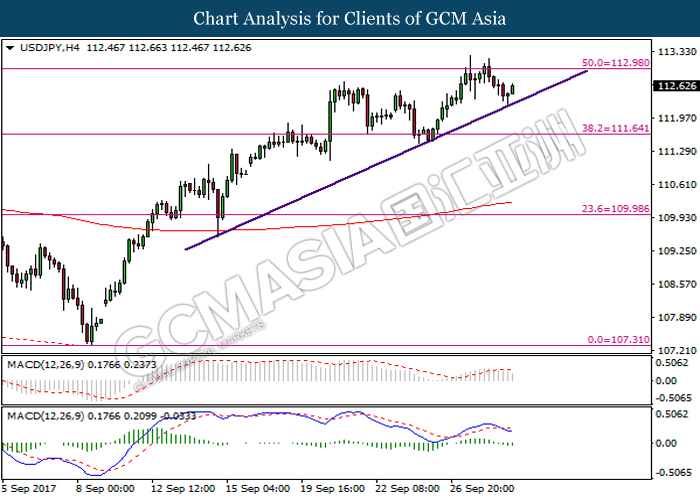
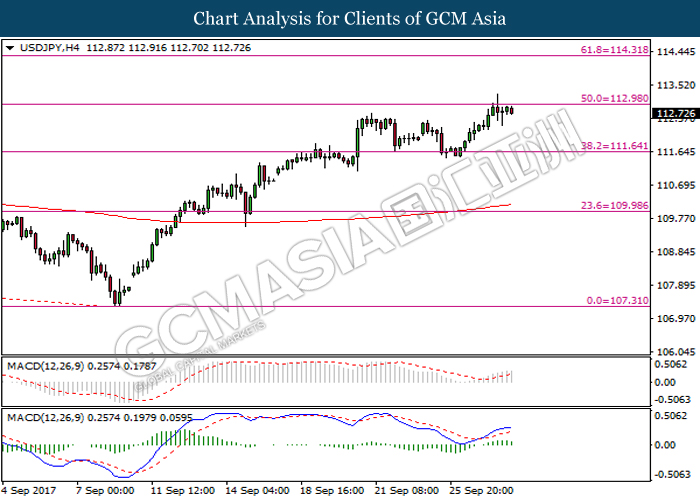
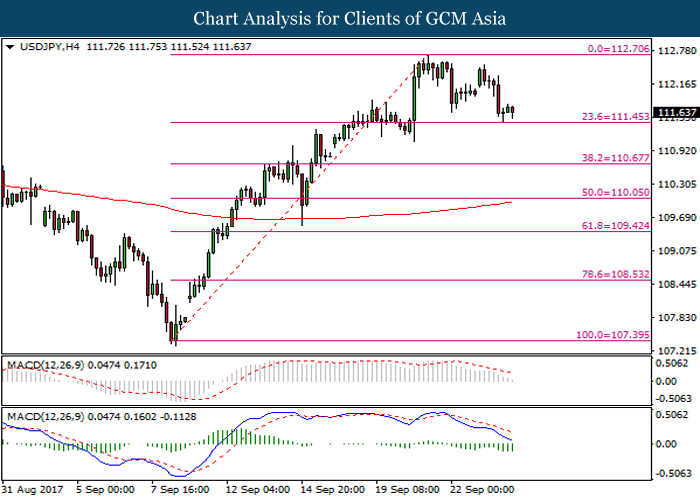
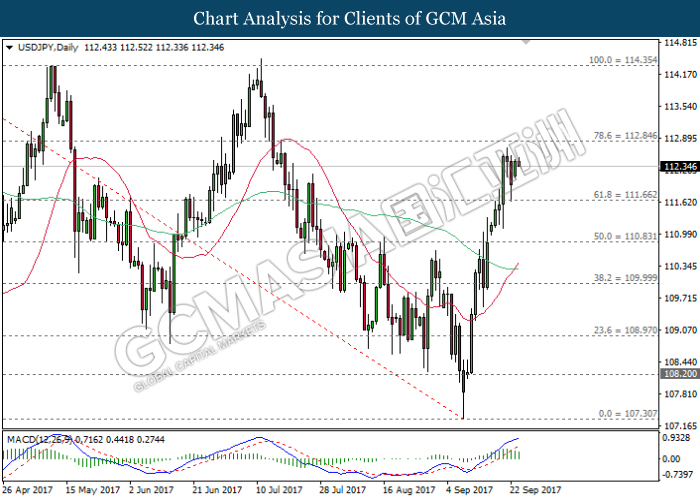
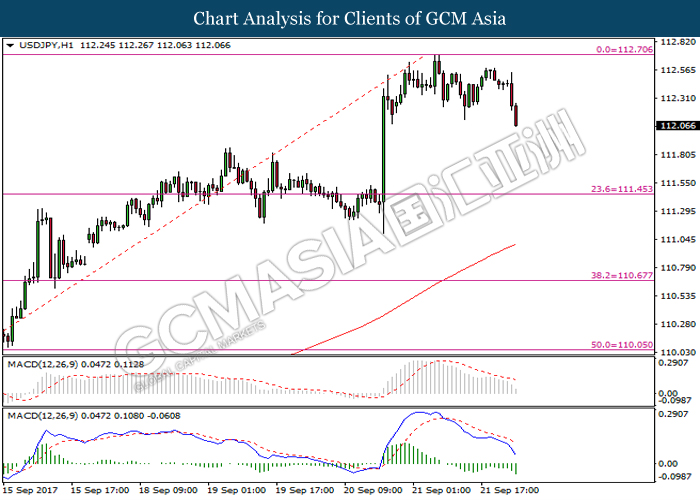
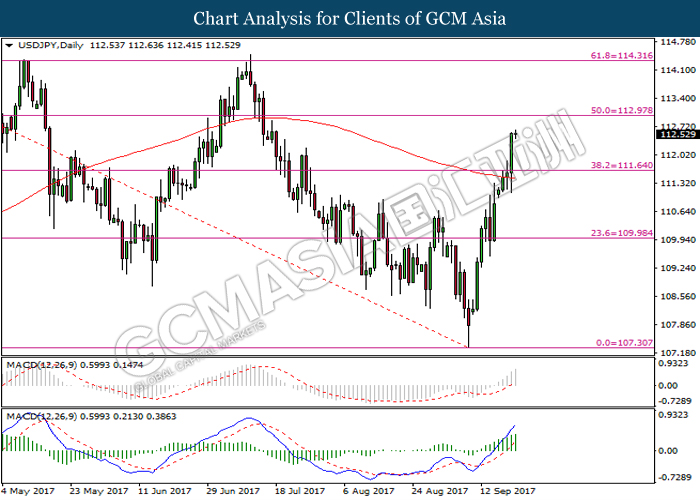
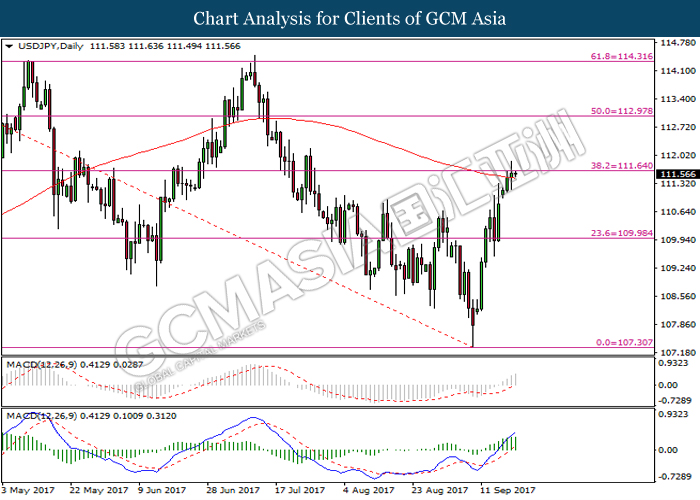
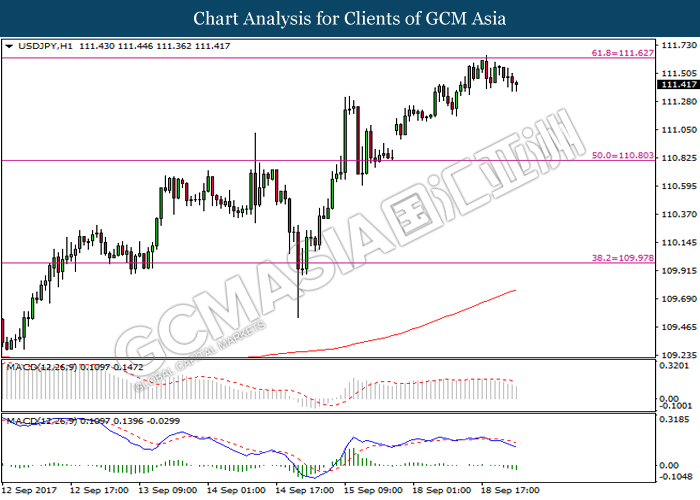
USDJPY
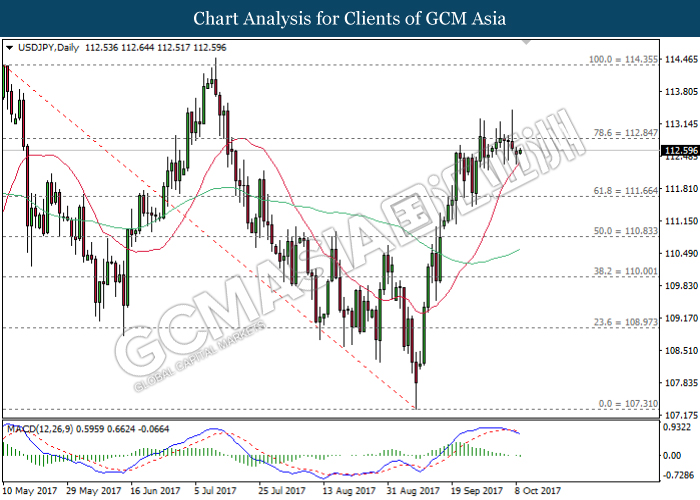
USDJPY, Daily: USDJPY remained seesawed near the strong resistance level of 112.85 due to prior attempts to close above this level. MACD histogram which begins to form a downward signal suggest further downside bias for the pair if it closes below the 20-MA line (red).
Resistance level: 112.85, 114.35
Support level: 111.65, 110.85
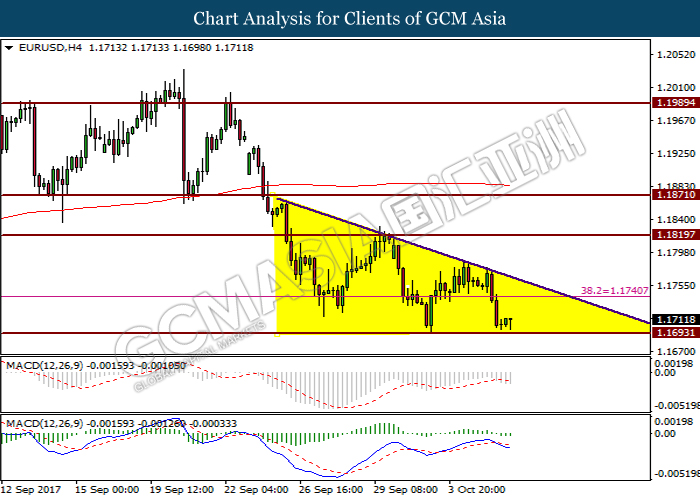
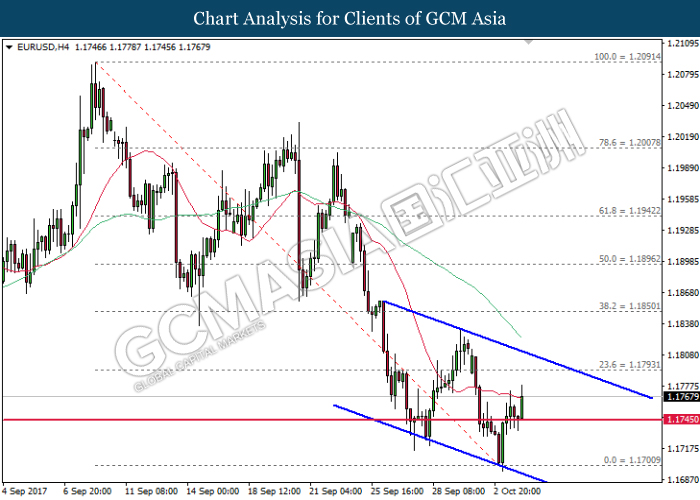
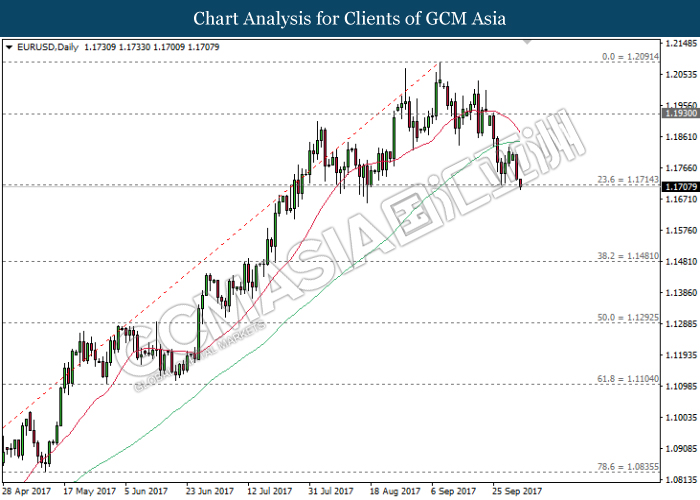
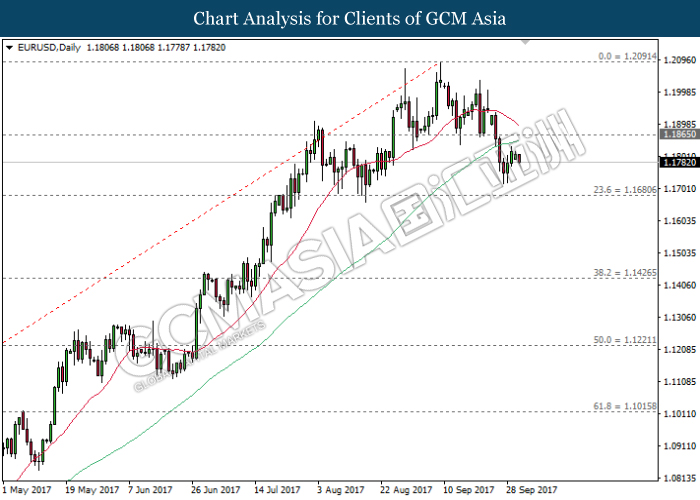
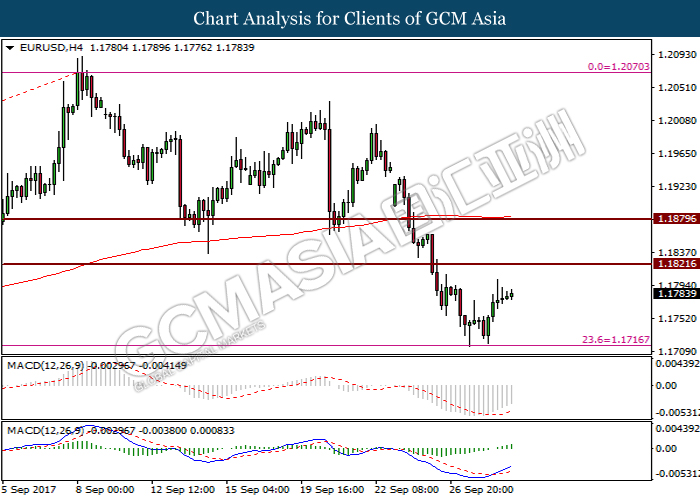
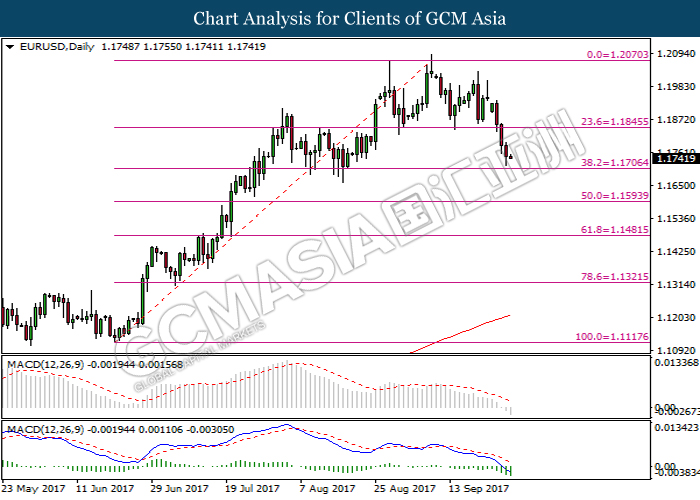
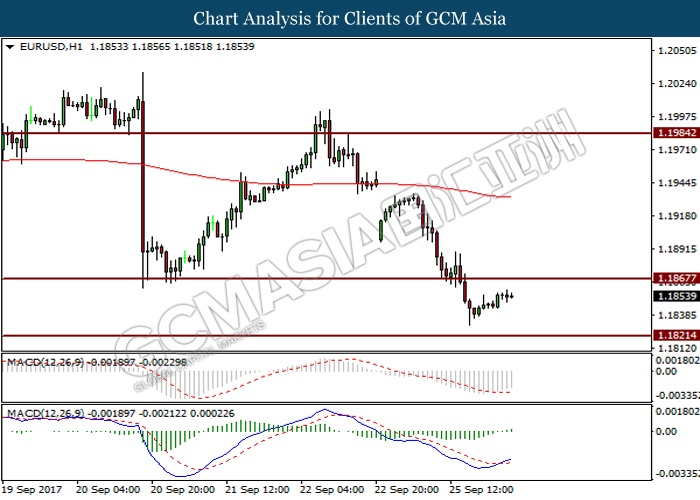
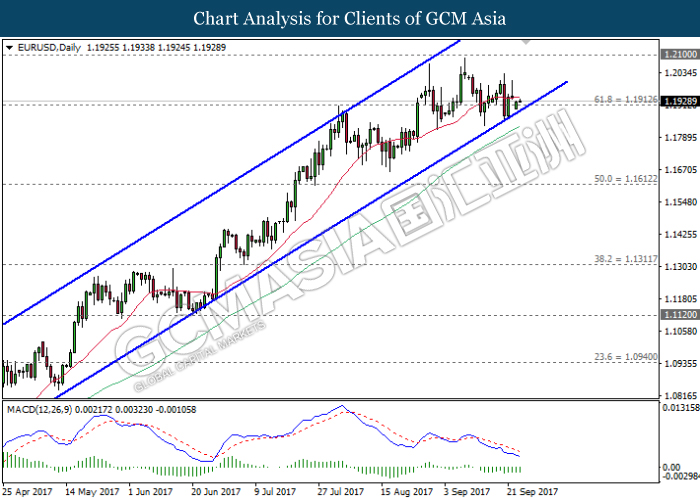
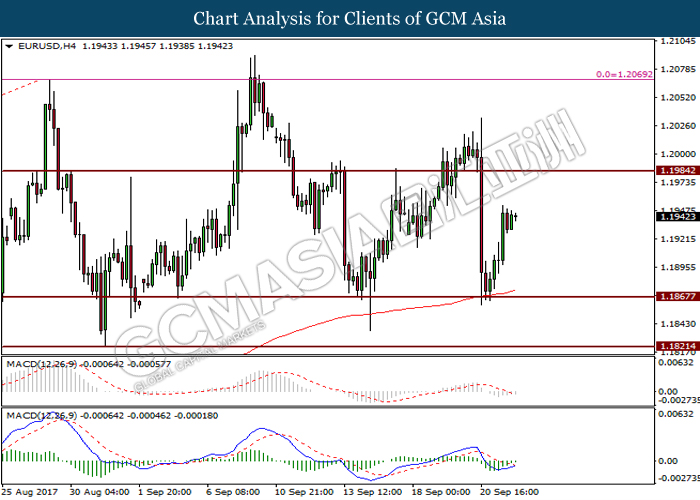
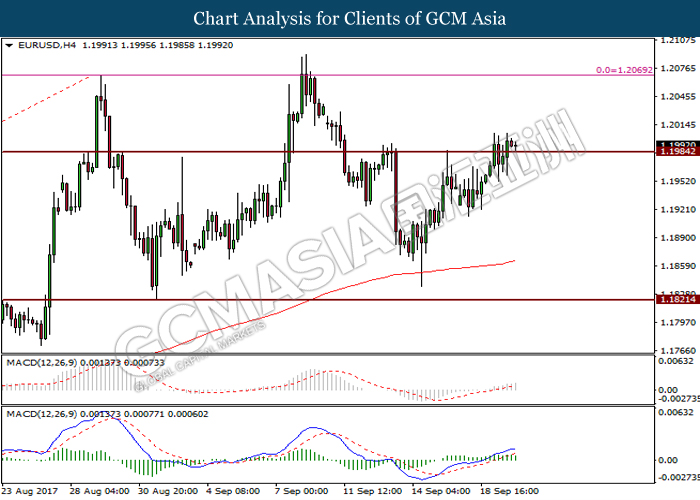
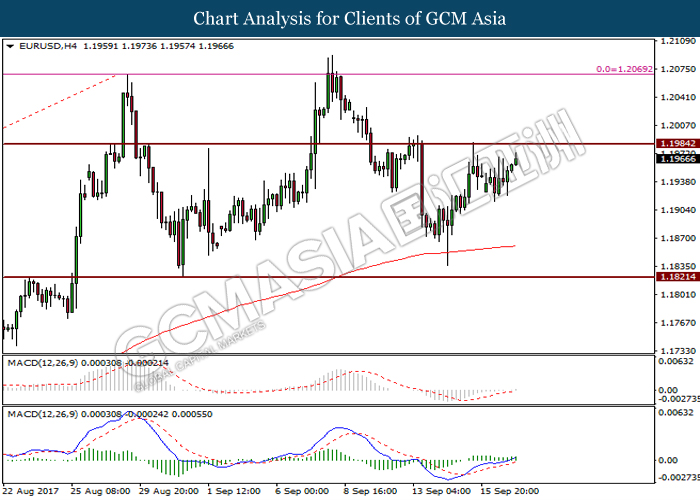
EURUSD
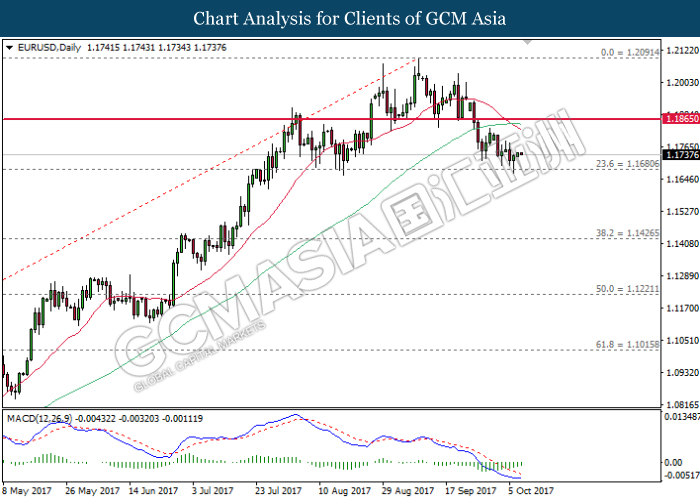
EURUSD, Daily: EURUSD was traded higher following prior rebound from the strong support level at 1.1680. Such price action while coupled with diminishing downward momentum from MACD histogram suggests further upside bias for the pair to advance towards the target of resistance level at 1.1865.
Resistance level: 1.1865, 1.2090
Support level: 1.1680, 1.1425
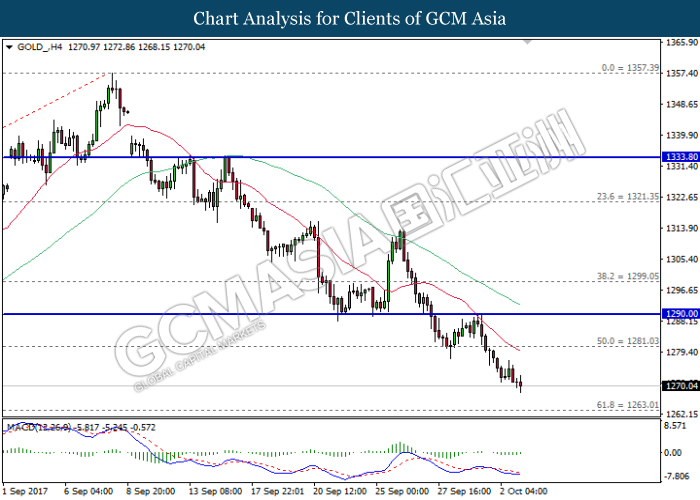
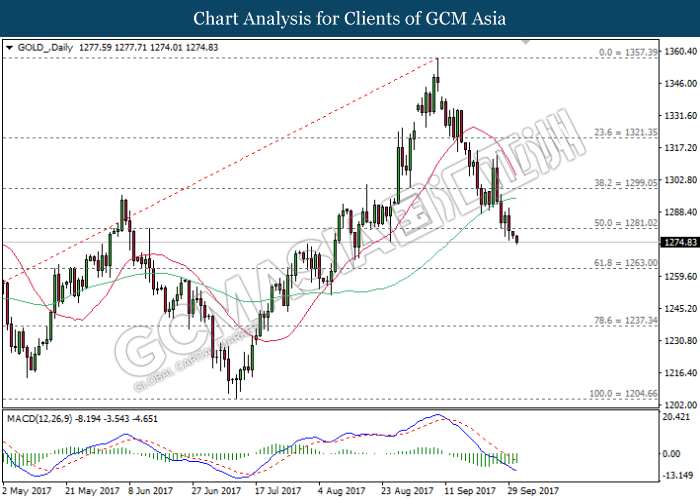
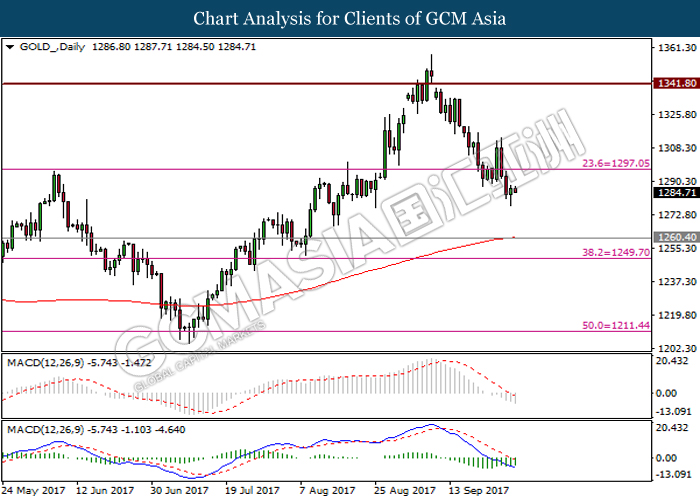
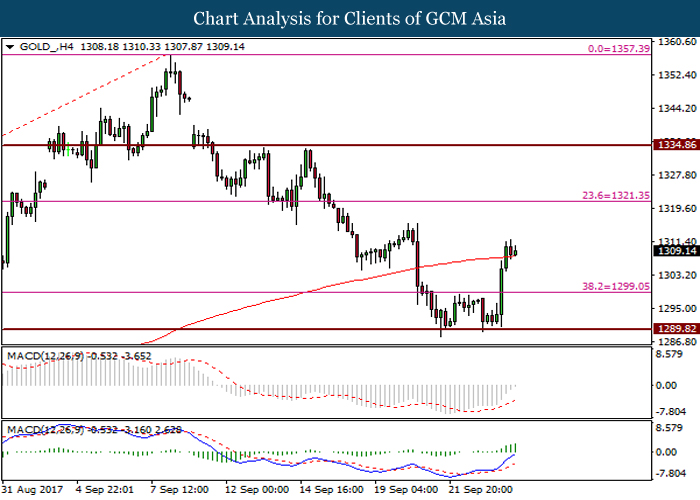
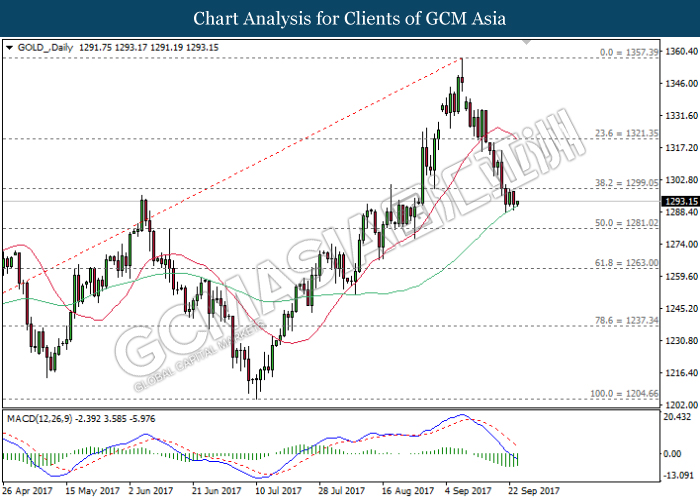
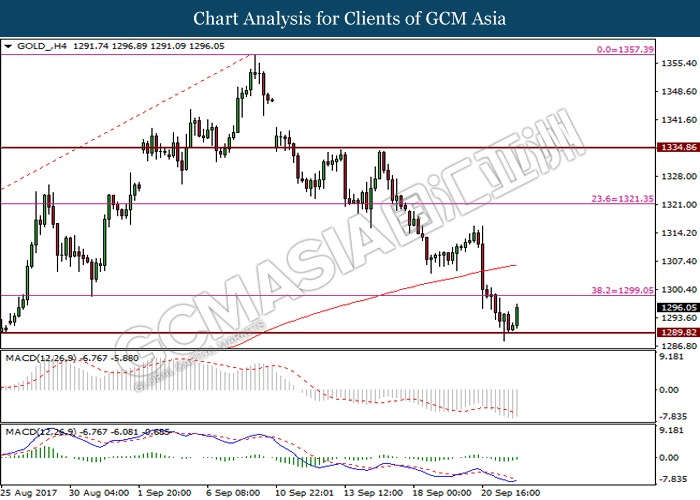
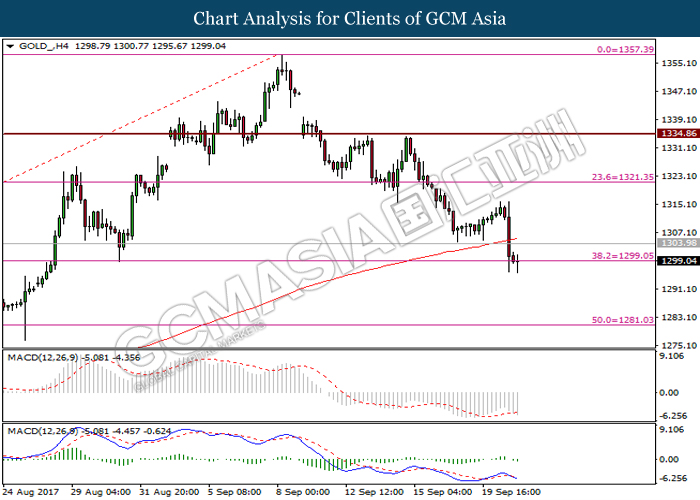
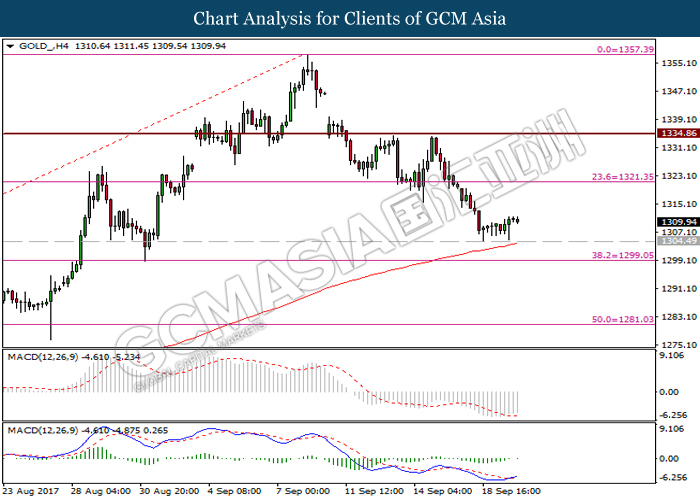
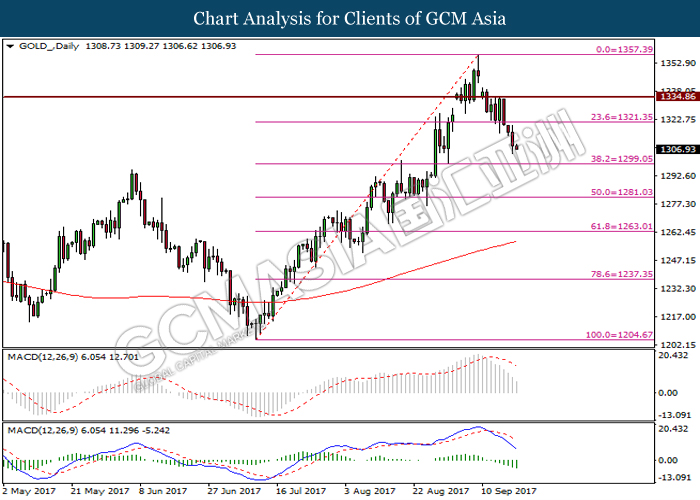
GOLD
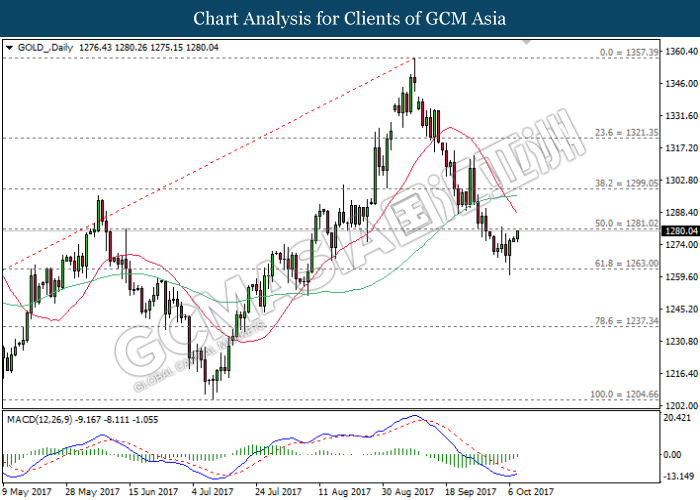
GOLD_, Daily: Gold price sheds its prior losses following a rebound from the support level at 1263.00. Both signal line from MACD histogram which continues to narrow upwards suggest the gold price to extend its upward momentum after closing above the level of 1281.00.
Resistance level: 1281.00, 1299.05
Support level: 1263.00, 1237.35
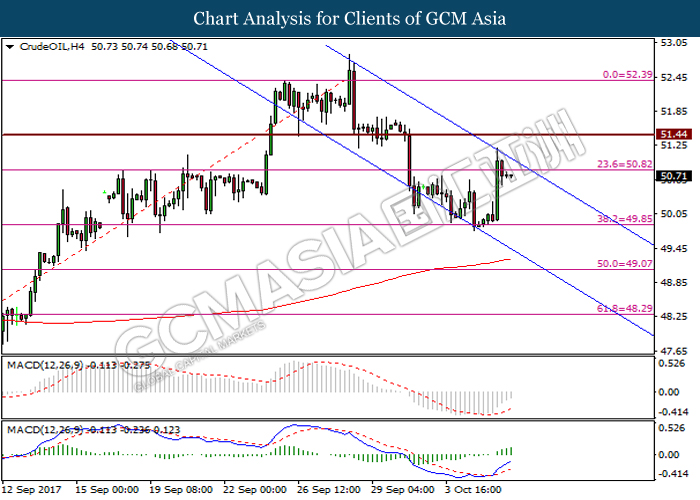
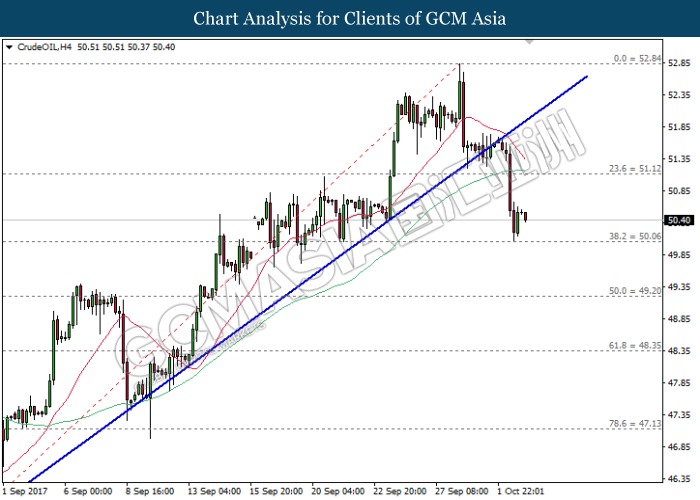
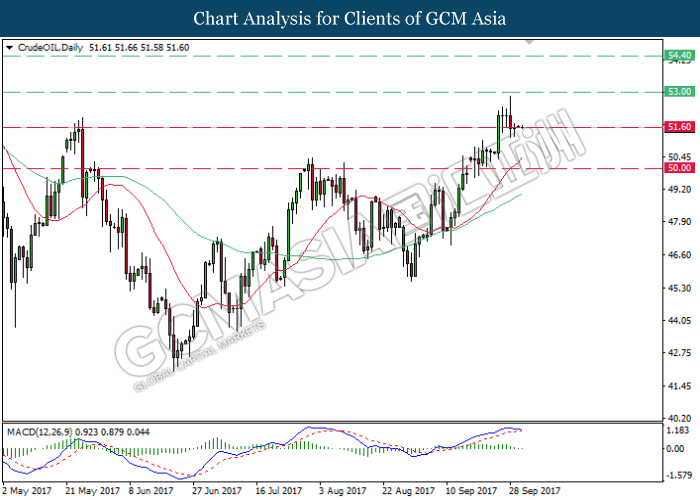
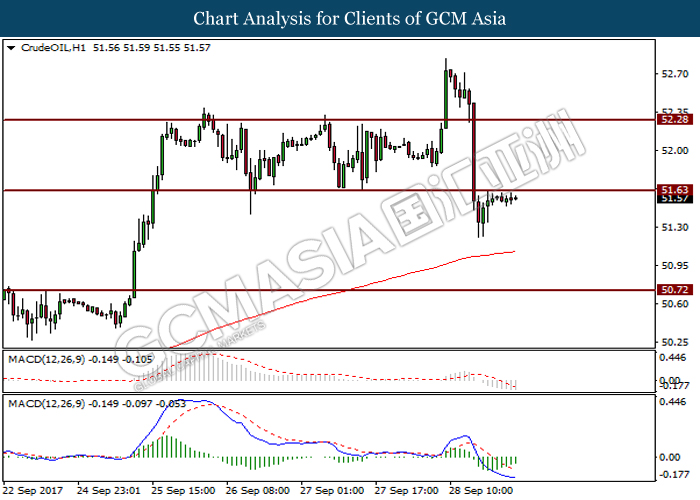
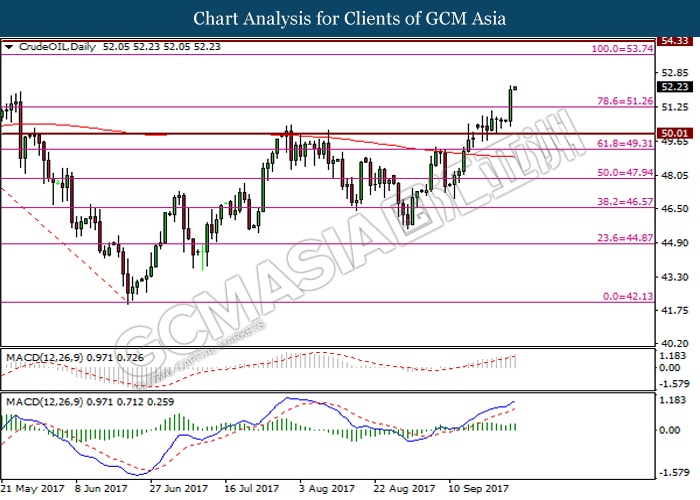
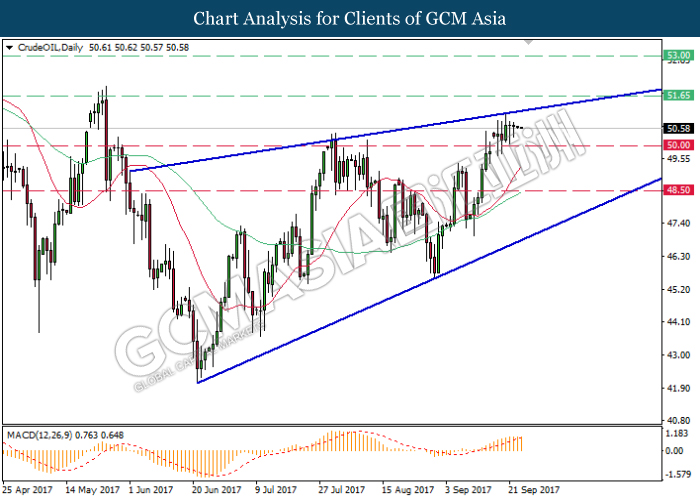
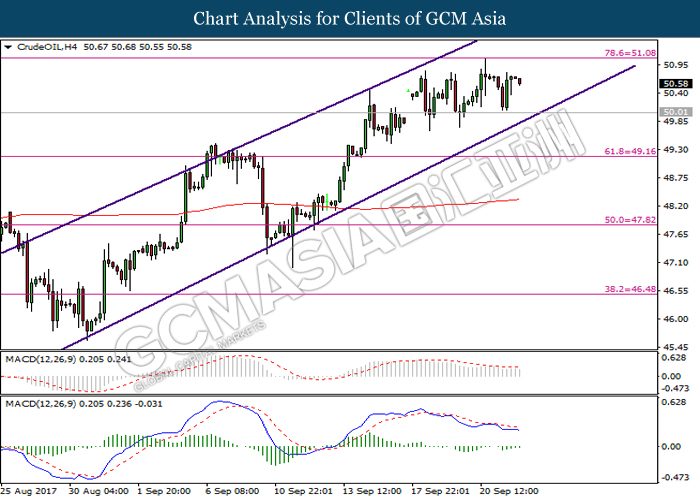
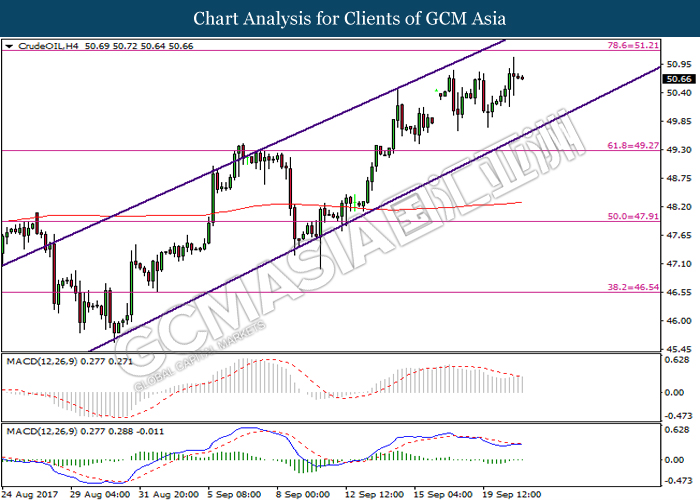
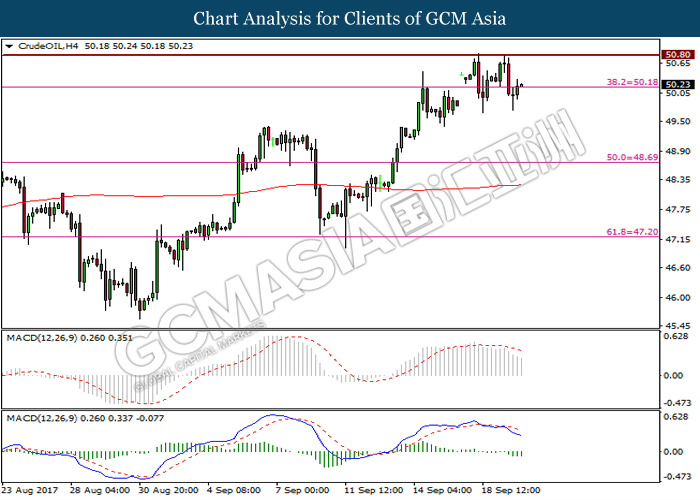
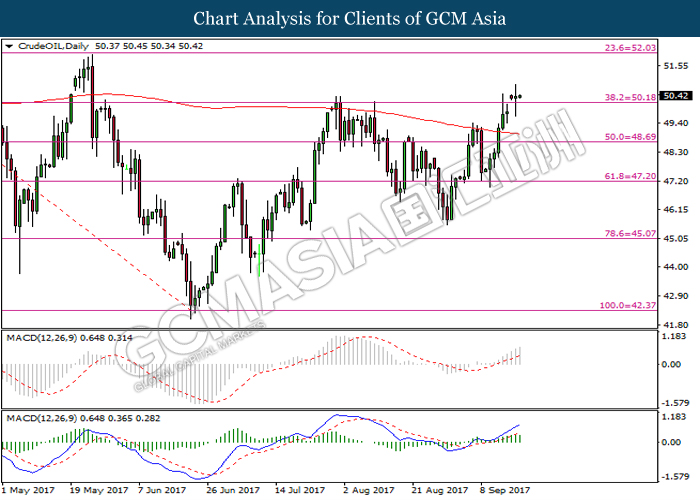
Crude Oil
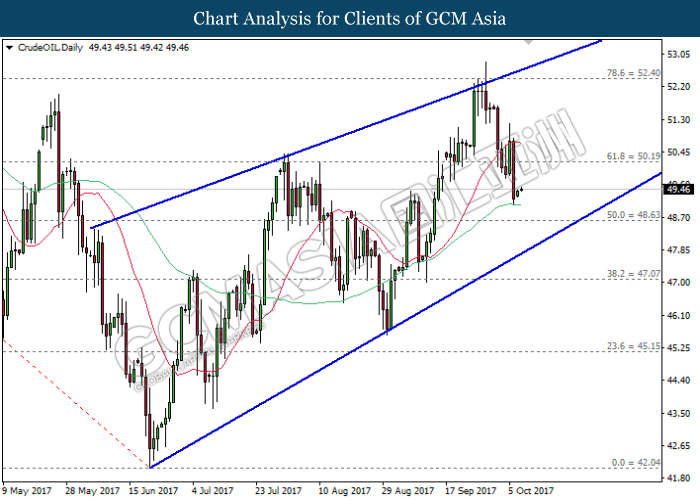
CrudeOIL, Daily: Crude oil price remained traded within a rising wedge while recently rebounded from the 60-MA line (green). Such price action suggests the commodity price to be traded higher in short-term towards the target of resistance level at 50.20.
Resistance level: 50.20, 52.40
Support level: 48.65, 47.05
061017 Daily Analysis
06 October 2017 Daily Analysis
Strong data supports Greenback ahead Non-farm Payroll.
Dollar index was traded higher against the other major currencies by 0.49%, last quoted at 93.77. The bullish momentum gained was due to a string of upbeat U.S. data recently, with initial jobless claims decreased by 260,000 last week more than the expected figures, narrowing of U.S. trade deficit in August when exporting activity in U.S. climbed to a two-and-a-half year high, as well as factory orders increased by 1.2%, much higher than the expected 1.0% increase. In addition, the dollar was further catalyzed after Philadelphia Federal Reserve Bank President Patrick Harker mentioned that he is still planning to increase interest rate this year and three times more in the next year. On the other hand, pound sterling received further bearish pressure after reports showing negative sentiment toward current political uncertainty and Brexit’s progression in United Kingdom. According to research done by German BDI, their report mentioned that UK government did not have a proper Brexit plan until today after a few negotiations have been made with the European zone. They also warned businesses to be prepared for higher risks as exposed by Brexit due to possibility of major banks and large firms shifting their operations to Frankfurt, Germany if Britain lose its access to the bloc.
In the commodity market, crude oil price increased by 2% to $50.73 after Russian President Vladimir Putin stated a pledge by Organization of the Petroleum Exporting Countries (OPEC) and other non-OPEC including Russia to reduce oil output could be postponed to the end of the 2018 instead of the previous expiration date standing in March 2018. Otherwise, gold price extended its losses by 0.06%, traded at $1269.10 a troy ounce, as a consequence of recent strengthening of the Greenback.
Today’s Holiday Market Close
Time Market Event
All day CNY China – National Day
Today’s Highlight Events
Time Market Event
21:15 USD FOMC Member Bostic Speaks
23:45 USD FOMC Member Rosengren Speaks
00:15 USD FOMC Member Dudley Speaks
00:45 USD FOMC Member Kaplan Speaks
01:00 USD FOMC Member Bullard Speaks
Today’s Highlight Economy Data
| Time | Nation & Data | Previous | Forecast | Actual |
| 14:00 | EUR – German Factory Orders (MoM) (Aug) | -0.7% | 0.7% | – |
| 15:30 | GBP – Halifax House Price Index (MoM) (Sep) | 1.1% | 0.1% | – |
| 20:30 | USD – Average Hourly Earnings (MoM) (Sep) | 0.1% | 0.3% | – |
| 20:30 | USD – Nonfarm Payrolls (Sep) | 156K | 90K | – |
| 20:30 | USD – Unemployment Rate (Sep) | 4.4% | 4.4% | – |
| 20:30 | CAD – Building Permits (MoM) (Aug) | -3.5% | – | – |
| 20:30 | CAD – Employment Change (Sep) | 22.2K | 14.5K | – |
| 22:00 | CAD – Ivey PMI (Sep) | 56.3 | 57.2 | – |
| 01:00 | CrudeOIL – US Baker Hughes Oil Rig Count | 750 | – | – |
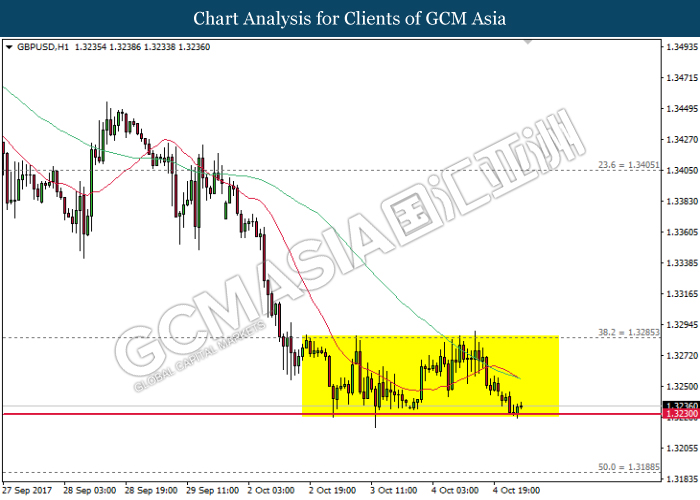
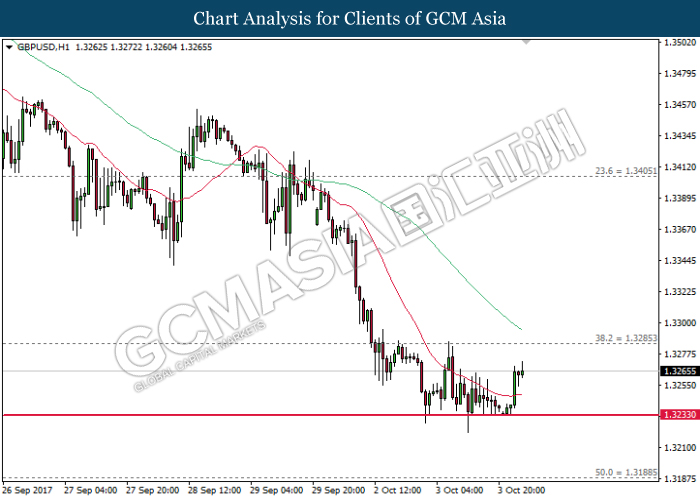
GBPUSD
GBPUSD, H4: GBPUSD was traded lower prior breaking below 200-MA line and support level at 1.3175. Downward slope of MACD signal line suggests further increasing momentum for the pair to trade lower toward the next support level at 1.3025.
Resistance level: 1.3175, 1.3240
Support level: 1.3025, 1.2940
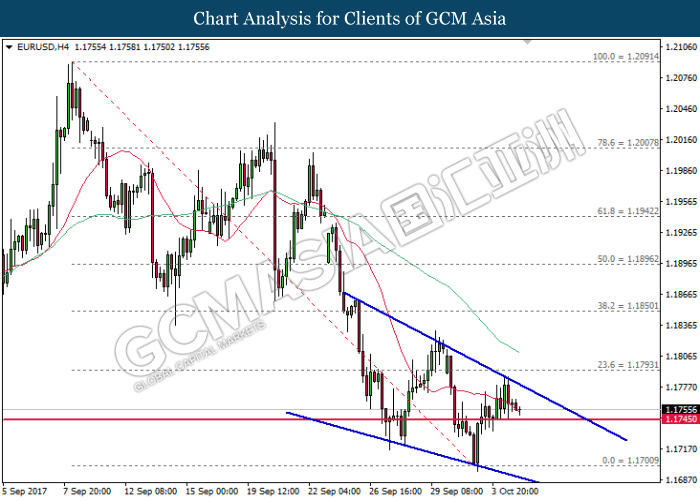
EURUSD
EURUSD, H4: EURUSD was traded in consolidation within descending triangle. Continuous upward trough as formed by MACD histogram suggests diminishing selling pressure and it indicates possible short-term momentum for the pair to trade higher toward resistance level at 1.1740.
Resistance level: 1.1740, 1.1820
Support level: 1.1690, 1.1615
USDJPY
USDJPY, H4: USDJPY was traded within consolidation prior its retracement from resistance level at 113.00. Golden cross as formed by MACD signal line suggests upward bias for the pair. However, a breakout above the said resistance level is required for the pair to further increasing bullish momentum to trade higher.
Resistance level: 113.00, 113.55
Support level: 112.35, 111.65
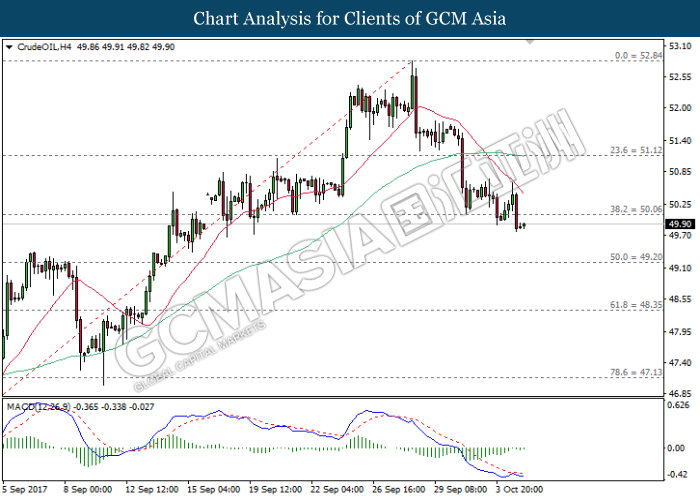
CrudeOIL
CrudeOIL, H4: Crude oil price was traded higher prior its rebound from support level at 49.85. Formation of bearish hammer suggests possible downward bias, however, upward slope of MACD signal line does not support evidence for crude oil to trade lower at the mean time. It is advised to wait for further confirmation signal to trade the commodity.
Resistance level: 50.80, 51.45
Support level: 49.85, 49.10
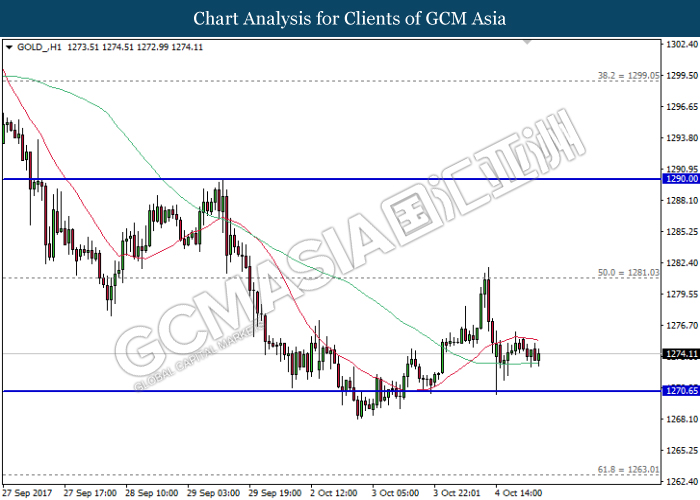
GOLD
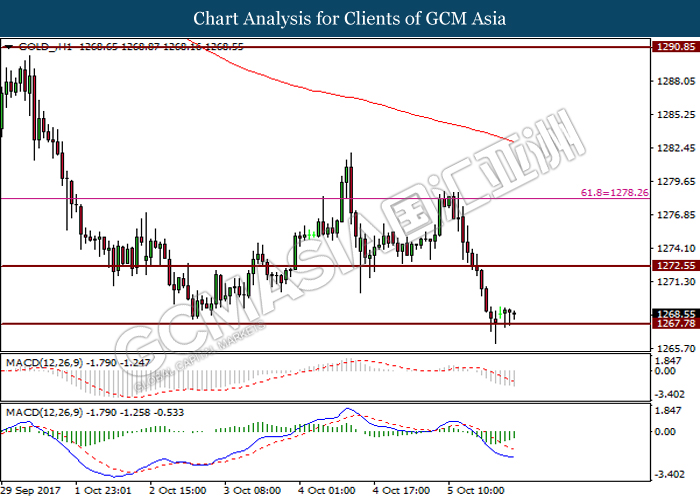
GOLD_, H1: Gold price was traded higher prior its rebound from support level at 1267.75. Formation of hammer price pattern and MACD signal line which diverts upward suggests possible short-term bullish momentum for the price to trade higher toward the resistance level at 1272.55.
Resistance level: 1272.55, 1278.25
Support level: 1267.75, 1258.30
051017 Daily Analysis
5 October 2017 Daily Analysis
Yellen mums the word, greenback awaits NFP.
Australian dollar dipped during early Asian trading on Thursday, ensuing from a pessimistic retail sales performance while market participants look ahead for the latest reading of US jobless claims prior to highly anticipated Nonfarm Payrolls report. Selling pressure was invoked upon the Aussie after Bureau of Statistics reported a decline in retail sales by -0.6% versus forecast of 0.3%. The data reflects some sluggishness in consumer spending which may hinder the progression of national inflationary pressure. As such, pair of AUD/USD tumbles 0.37% to $0.7833.
In the US region, the dollar index extended overnight gains by 0.07% to 93.32 over the backdrop of optimistic economic data. With regards to private payrolls, ADP reported an addition of 135,000 jobs in the month of September, beating economist forecast of only 125,000. Similarly, Institute for Supply Management (ISM) reported an uptick in national non-manufacturing sector activity to 59.8, its highest level since August 2005. The services sector is one of the main component for the US economy which accounts roughly 80% of US private sector GDP while an optimistic outcome has spurred expectation for more economic growth in the third quarter. However, dollar gains were remained capped after Fed Chair Janet Yellen avoided to comment on future economic outlook while leaving investors in limbo regarding her successor.
In the commodities front, crude oil price was down 0.20% to $49.88 a barrel following a surprise jump in US crude export. Although EIA reported a larger than expected draw in crude inventories, US crude exports rose to an all-time high of 2 million barrels per day, fanning for more concern upon the already oversupplied oil market. Otherwise, gold price was traded flat around $1,274.55 following reports that a dovish Federal Reserve Chair may be appointed next year.
Today’s Holiday Market Close
Time Market Event
All Day CNY China – National Day
All Day HKD Hong Kong – Following day of Chinese Mid-Autumn Festival
Today’s Highlight Events
Time Market Event
19:30 EUR ECB Publishes Account of Monetary Policy Meeting
21:10 USD FOMC Member Powell Speaks
21:15 USD FOMC Member Williams Speaks
22:00 USD FOMC Member Harker Speaks
Today’s Highlight Economy Data
| Time | Nation & Data | Previous | Forecast | Actual |
| 08:30 | AUD – Retail Sales (MoM) (Aug) | 0.0% | 0.3% | -0.6% |
| 20:30 | USD – Initial Jobless Claims | 272K | 265K | – |
| 20:30 | USD – Trade Balance (Aug) | -43.70B | -42.70B | – |
| 20:30 | CAD – Trade Balance (Aug) | -3.04B | -2.60B | – |
| 22:00 | USD – Factory Orders (MoM) (Aug) | -3.35 | 1.0% | – |
GBPUSD
GBPUSD, H1: GBPUSD remains traded within a sideways formation following prior rebound from the strong support level near 1.3230. Such price action suggests short-term upside bias for the pair to extend its gains towards the 20-MA line (red). Otherwise, a clearer long-term direction would require a breakout from either side of the formation.
Resistance level: 1.3285, 1.3405
Support level: 1.3230, 1.3190
EURUSD
EURUSD, H4: EURUSD remains traded within a downward wedge following prior retracement from the top level. Its upside which compromises higher bearish pressure may suggest the pair to extend its downward momentum after closing below the support level of 1.1745.
Resistance level: 1.1795, 1.1850
Support level: 1.1745, 1.1700
USDJPY
USDJPY, H4: USDJPY remains traded within a sideways formation following prior rebound from the strong support level of 112.35. MACD histogram which illustrate diminishing downward signal may suggest the pair to be traded higher in short-term. Otherwise, a breakout from either side is required for clearer long-term direction.
Resistance level: 113.15, 113.65
Support level: 112.35, 111.50
CrudeOIL
CrudeOIL, H4: Crude oil price extended its losses following prior breakout from the support level of 50.05. However, MACD histogram which illustrate diminishing downward momentum suggest the price to be traded higher in short-term as technical correction. Long-term trend direction still skew towards downside bias.
Resistance level: 50.05, 51.10
Support level: 49.20, 48.35
GOLD
GOLD_, H1: Gold price remains under pressure following prior retracement from the 20-MA line (red). A higher selling pressure from the upside may suggest its prices to extend its downward momentum after successfully closing below the 60-MA line (green).
Resistance level: 1281.05, 1290.00
Support level: 1270.65, 1263.00
041017 Daily Analysis
4 October 2017 Daily Analysis
Greenback tumbles, eyes on major data.
US dollar tumbles lower during Wednesday’s Asian trading hours due to lack of top tier economic data while losses remained cap as investors placed higher prospect for an imminent interest rate hike by year-end. The dollar index sheds its gains by 0.14% while trading at 93.21 against a basket of six major currencies. In somewhat a quiet day on the economic calendar, US dollar stages its technical correction from prior seven-weeks high as investors held off from initiating large trade ahead of a busy week which includes speech by Federal Reserve Chair Janet Yellen and the release of highly anticipated Nonfarm Payrolls report. Investors will be scrutinizing on Yellen’s remark, whom is bound to speak at the Community Banking in the 21st Century Conference for further signals regarding future monetary policy and the next successor of Fed Chair. On the other hand, pair of GBP/USD recovered its losses by 0.25% to $1.3268 amid data showing that the UK construction sector contracted for the first time since August last year. Market participants will be focusing on today’s UK Services PMI to gauge the impending risk from last year’s Brexit vote.
As for commodities, crude oil price fell by 0.67% to $50.08 a barrel following mixed results from API weekly report. According to API, crude oil inventories fell by 4.08 million barrels last week. However, gasoline supplies gained 4.91 million barrels, shadowing the optimistic reading from crude inventories. As API and EIA figures often diverge, most investors will be waiting for official inventory report form EIA for further market indication. On the other hand, gold price stages its recovery by 0.26% to $1,275.17 following US dollar’s correction since yesterday.
Today’s Holiday Market Close
Time Market Event
All Day CNY China – National Day
Today’s Highlight Events
Time Market Event
01:15 EUR ECB President Draghi Speaks
03:00 USD FOMC Member Bullard Speaks
03:15 USD Fed Chair Yellen Speaks
Today’s Highlight Economy Data
| Time | Nation & Data | Previous | Forecast | Actual |
| 04:30 | CrudeOIL – API Weekly Crude Oil Stock | -0.761M | – | -4.079M |
| 16:00 | EUR – Markit Composite PMI (Sep) | 56.7 | 56.7 | – |
| 16:00 | EUR – Services PMI (Sep) | 55.6 | 55.6 | – |
| 16:30 | GBP – Services PMI (Sep) | 53.2 | 53.2 | – |
| 17:00 | EUR – Retail Sales (MoM) (Aug) | -0.3% | 0.3% | – |
| 20:15 | USD – ADP Nonfarm Employment Change (Sep) | 237K | 125K | – |
| 21:45 | USD – Markit Composite PMI (Sep) | 54.6 | – | – |
| 21:45 | USD – Services PMI (Sep) | 55.1 | 55.1 | – |
| 22:00 | USD – ISM Non-Manufacturing PMI (Sep) | 55.3 | 55.5 | – |
| 22:30 | CrudeOIL – Crude Oil Inventories | -1.846M | -0.756M | – |
GBPUSD
GBPUSD, H1: GBPUSD was traded higher following prior rebound near the support level of 1.3230. Recent bullish closure above the 20-MA line (red) suggests short-term bias for the pair to be traded higher and head towards the resistance level of 1.3285.
Resistance level: 1.3285, 1.3405
Support level: 1.3230, 1.3190
EURUSD
EURUSD, H4: EURUSD remains traded within a downward channel following prior rebound from the bottom level of the channel. A closure above the 20-MA line (red) may suggest the pair to advance further up in short-term, towards the target of 1.1795.
Resistance level: 1.1795, 1.1850
Support level: 1.1745, 1.1700
USDJPY
USDJPY, H4: USDJPY remains under pressure following prior retracement while currently testing at the upward trend line. MACD indicator which shows diminishing upward momentum suggests that a breakout from the upward trend line will suggest a change in trend direction to extend its losses thereafter.
Resistance level: 113.00, 114.30
Support level: 111.65, 110.00
CrudeOIL
CrudeOIL, H4: Crude oil price extended its losses following prior formation of death cross by both moving average line. MACD indicator which illustrate substantial downward momentum suggests crude oil price to extend its losses towards the next target at 49.20.
Resistance level: 50.05, 51.10
Support level: 49.20, 48.35
GOLD
GOLD_, H1: Gold price was traded higher following prior rebound from the support level of 1270.65. MACD indicator which illustrate substantial upward signal suggests gold price to extend its short-term upside bias towards the next target at 1281.05.
Resistance level: 1281.05, 1290.00
Support level: 1270.65, 1263.00
031017 Daily Analysis
3 October 2017 Daily Analysis
Catalonia drags down Euro, dollar-bull unscathed.
US dollar extended its gains during Asian trading hours on Tuesday following optimistic manufacturing data which has reinforced market sentiment towards an interest rate hike by year-end. The dollar index added up 0.10% while last quoted at 93.45 as of writing. According to the Institute for Supply Management (ISM), the index of national factory activity for the month of September tacks in at 60.8, versus forecast for a depreciation to 58.0. The data achieved its highest level since May 2004, spurring more expectation for a solid third quarter economic growth and performance. Greenback has risen in the recent weeks following Fed Chair Janet Yellen’s hawkish signal while coupled with US President Donald Trump’s tax reformation which could help escalate the country’s economic growth in the future. On the other hand, EUR/USD was down 0.02% while exchanged hands at $1.1731 amid renewed Eurozone geopolitical risk. The single common currency came under pressure following the initiation of disputed independence referendum in Catalonia from Spain which could spark further uncertainty for the country and economic bloc.
In the commodities market, crude oil price sheds 0.26% while traded at $50.45 per barrel following report that shows an uptick in OPEC’s oil production last month. According to recent Reuters poll, the output among OPEC members rose by 50,000 per barrel a day in September as the cartel’s compliance with its production cut agreement fell to 86%. Otherwise, spot gold price was down 0.05% to $1,270.32 amid stronger dollar and higher expectation towards rising borrowing cost in the future.
Today’s Holiday Market Close
Time Market Event
All Day EUR Germany – Unification Day
All Day CNY China – National Day
Today’s Highlight Events
Time Market Event
11:30 AUD RBA Rate Statement
20:30 USD FOMC Member Powell Speaks
Today’s Highlight Economic Data
| Time | Nation & Data | Previous | Forecast | Actual |
| 11:30 | AUD – RBA Interest Rate Decision (Oct) | 1.50% | 1.50% | – |
| 16:30 | GBP – Construction PMI (Sep) | 51.1 | 51.0 | – |
GBPUSD
GBPUSD, H4: GBPUSD was traded lower following prior closure below the support level of 1.3285. Both MA line which continues to expand downwards, in tandem with MACD histogram which illustrate downward signal suggest the pair to advance towards the next target at 1.3190.
Resistance level: 1.3285, 1.3405
Support level: 1.3190, 1.3090
EURUSD
EURUSD, Daily: EURUSD remains under pressure following prior retracement before the 60-MA line (green). Both MA lines which continues to narrow downwards suggest the pair to extend its losses after successfully closing below the strong support level of 1.1715.
Resistance level: 1.1930, 1.2090
Support level: 1.1715, 1.1480
USDJPY
USDJPY, H1: USDJPY remains traded within an upward channel while currently testing at the top level near the strong resistance of 113.20. As the selling pressure from the top is relatively substantial, thus a retracement may suggest short-term downside bias for the pair to extend its losses towards the lower level of the channel.
Resistance level: 113.20, 113.45
Support level: 112.90, 112.65
CrudeOIL
CrudeOIL, H4: Crude oil price extended its losses following prior breakout from the upward trend line. Both MA lines which continues to narrow downwards suggest the commodity price to advance further down and retest at the strong support level near 50.05.
Resistance level: 51.10, 52.85
Support level: 50.05, 49.20
GOLD
GOLD_, H4: Gold price extended its losses following prior retracement while closing below the support level of 1281.05. However, downward signal from MACD histogram which continues to diminish may suggest gold price to be traded higher in short-term as retracement before continue its major downside bias.
Resistance level: 1281.05, 1290.00
Support level: 1263.00, 1237.35
021017 Weekly Analysis
2 October 2017 Weekly Analysis
GCMAsia Weekly Report: October 2 – 6
Market Review (Forex): September 25 – 29
U.S. Dollar
Greenback was a little changed against other major peers last Friday following the release of mixed US economic data. However, it has ended September with first monthly gain for the first time in seven months. The dollar index was thinly traded at around 92.91 during late Friday trade while ended the week with 0.99% of gains.
US dollar slipped last Friday after data showed that Federal Reserve’s inflation preferred measure – the Core Personal Consumption Expenditure (PCE) Price Index missed economist expectations with only 0.1% for the month of August. However, the data failed to temper market sentiment towards US interest rate hike as Fed Chair Janet Yellen signaled that the central bank is still on track for a third rate hike this year and three in the year 2018.
Likewise, US dollar was further supported after US President Donald Trump’s tax reform which suggested to cut corporate tax rate from 39% to around 20%. The Republicans aimed to have the tax reform signed into law before January and it may be enacted sometime within the first half of 2018.
US Core PCE Price Index
US Core Personal Consumption Expenditure came in at only 0.1% versus forecast of 0.2%.
USD/JPY
Pair of USD/JPY rose 0.18% and ended the week around 112.49. It has recorded a monthly gain of up to 2.02%.
EUR/USD
Euro extended its gains by 0.26% to $1.1818 against the US dollar. It has recovered from Thursday’s five-weeks low of $1.1716 amid political uncertainty in Germany which could falter Eurozone economy and make close integration more difficult.
GBP/USD
GBP/USD extended its losses by 0.33% to $1.3397 after second quarter GDP missed economist forecast with only 1.5% versus 1.7%.
Market Review (Commodities): September 25 – 29
GOLD
Gold prices extended its losses on Friday although US economic data pose a threat to the upcoming interest rate hike by US Federal Reserve. Price of the yellow metal settled down by 0.41% and ended the week around $1,283.47 a troy ounce. It has posted the largest monthly loss for the year with 2.83% as the US dollar stages its bottom recovery.
Greenback has risen in the recent weeks as investors grow more optimistic about the prospect for US interest rate hikes while tax cuts proposed by Trump may help to boost the US economy in the future. Gold prices are highly sensitive to rising rates as it could lift the opportunity cost for holding non-yielding assets while boosting the dollar which it is priced in.
Crude Oil
Oil prices extended its gains on Friday while recording its largest gains for the week, month and quarter amid higher optimism towards the market as the market points towards rebalancing of supply and demand. Crude oil price was up by 11 cents or around 0.2% and ended the week at $51.67 per barrel. For the week, it has notched in 2% of gains while roughly 9.5% for the month and 12% for the quarter. Its prices have gained more than 20% since June lows following bullish market data which showed strong compliance among other major producers within the OPEC plan to freeze their daily production level.
On the other hand, mounting fears over the potential fallout from the independence referendum in the oil-rich Kurdish region of Iraq has provided further support for its prices. Previously, Kurdish voters overwhelmingly cast their ballot in favor of independence from Iraq has sparked strong opposition from around the world while neighboring country such as Turkey and Iran threatened to disrupt the flow of crude oil from the country as much as 500,000 barrels per day. A significant reduction of supply in the market may help to reduce the global oil supply glut which has linger for three years.
Weekly Outlook: October 2 – 6
For the week ahead, comments from the US Fed Chair Janet Yellen will be closely monitored for further clues regarding the timing of next rate hike. In addition, the highly anticipated US jobs report will also be in focus.
In the European region, investors will be focusing on remarks by ECB President Mario Draghi on Wednesday and UK PMI data for further clues regarding their economic performance ahead of Brexit cut-off.
As for oil traders, they will be eyeing on US inventories level reported by API and EIA to gauge the strength of crude demand for world’s largest oil consumer.
Highlighted economy data and events for the week: October 2 – 6
| Monday, October 2 |
Data JPY – Tankan Large Manufacturers Index (Q3) JPY – Tankan Large Non-Manufacturers Index (Q3) GBP – Manufacturing PMI (Sep) USD – ISM Manufacturing PMI (Sep)
Events USD – FOMC Member Kaplan Speaks
|
| Tuesday, October 3 |
Data AUD – RBA Interest Rate Decision (Oct) GBP – Construction PMI (Sep)
Events AUD – RBA Rate Statement USD – FOMC Member Powell Speaks
|
| Wednesday, October 4 |
Data CrudeOIL – API Weekly Crude Oil Stock GBP – Services PMI (Sep) EUR – Retail Sales (MoM) (Aug) USD – ADP Nonfarm Employment Change (Sep) USD – ISM Non-Manufacturing PMI (Sep) CrudeOIL – Crude Oil Inventories
Events EUR – ECB President Draghi Speaks USD – FOMC Member Bullard Speaks USD – Fed Chair Yellen Speaks
|
| Thursday, October 5 |
Data AUD – Retail Sales (MoM) (Aug) USD – Initial Jobless Claims USD – Trade Balance (Aug) CAD – Trade Balance (Aug) USD – Factory Orders (MoM) (Aug)
Events EUR – ECB Publishes Account of Monetary Policy Meeting USD – FOMC Member Powell Speaks USD – FOMC Member Williams Speaks USD – FOMC Member Harker Speaks
|
|
Friday, October 6
|
Data EUR – German Factory Orders (MoM) (Aug) GBP – Halifax House Price Index (MoM) (Sep) USD – Average Hourly Earnings (MoM) (Sep) USD – Nonfarm Payrolls (Sep) USD – Unemployment Rate (Sep) CAD – Building Permits (MoM) (Aug) CAD – Employment Change (Sep) CAD – Ivey PMI (Sep) CrudeOIL – US Baker Hughes Oil Rig Count
Events USD – FOMC Member Dudley Speaks USD – FOMC Member Kaplan Speaks USD – FOMC Member Bullard Speaks
|
Technical weekly outlook: October 2 – 6
Dollar Index
DOLLAR_INDX, Daily: Dollar index extended its gains following prior rebound from the bottom of 90.95. Both MA lines which begins to narrow upwards suggest further upside bias, first target will be focused at 93.95.
Resistance level: 93.95, 95.85
Support level: 92.45, 90.95
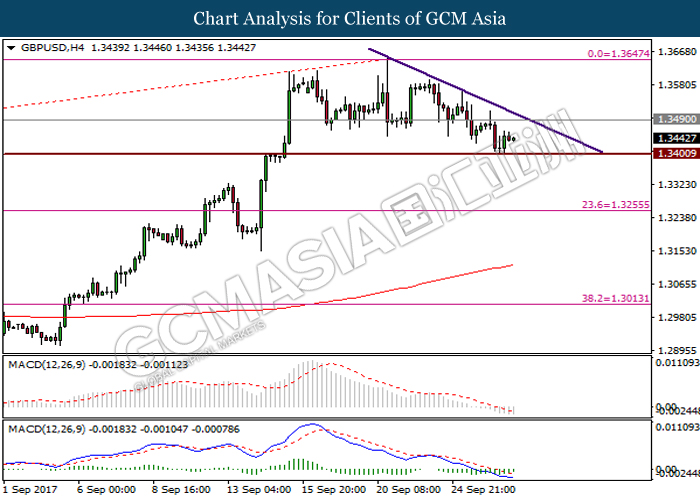
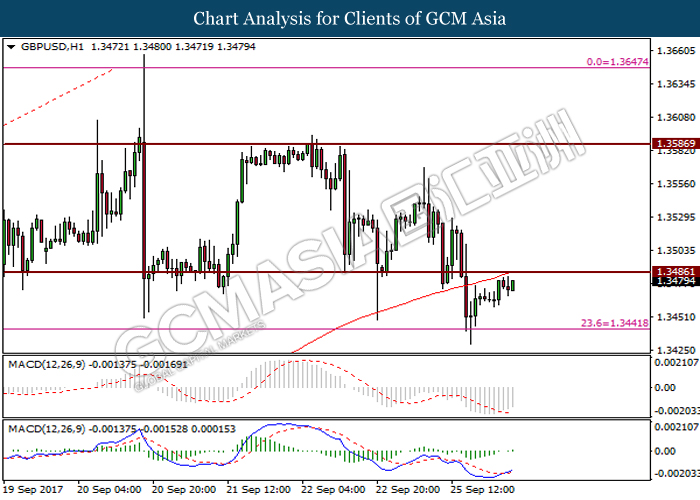
GBPUSD
GBPUSD, Daily: GBPUSD was traded lower following prior retracement while closing below the 20-MA line (red). A successful closure below the support level of 1.3350 would suggest the pair to extend its losses towards the next target at 1.3165.
Resistance level: 1.3480, 1.3660
Support level: 1.3350, 1.3165
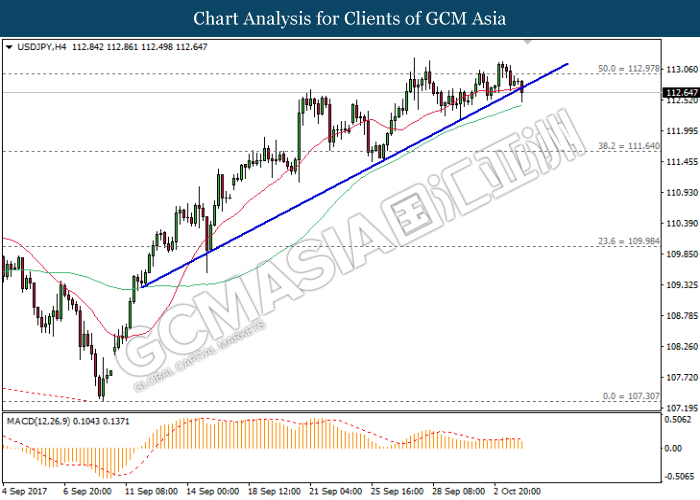
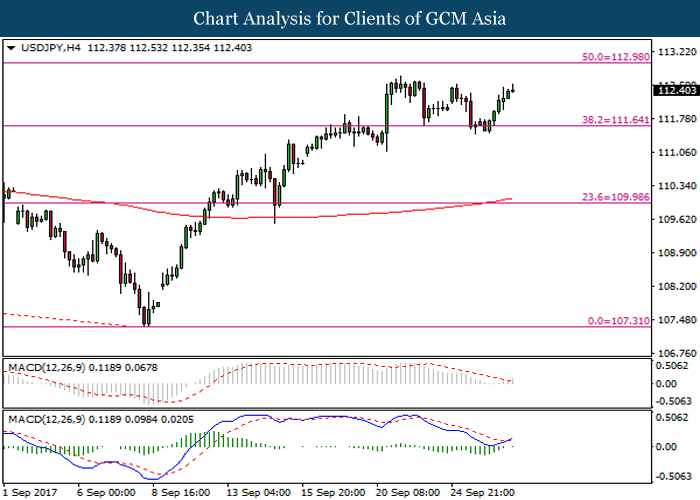
USDJPY
USDJPY, Daily: USDJPY advance further upwards following previous rebound from the strong support level near 111.65. Both MA lines which continues to expand upwards suggests the pair to extend its upward momentum after closing above the resistance level of 112.85.
Resistance level: 112.85, 114.35
Support level: 111.65, 110.85
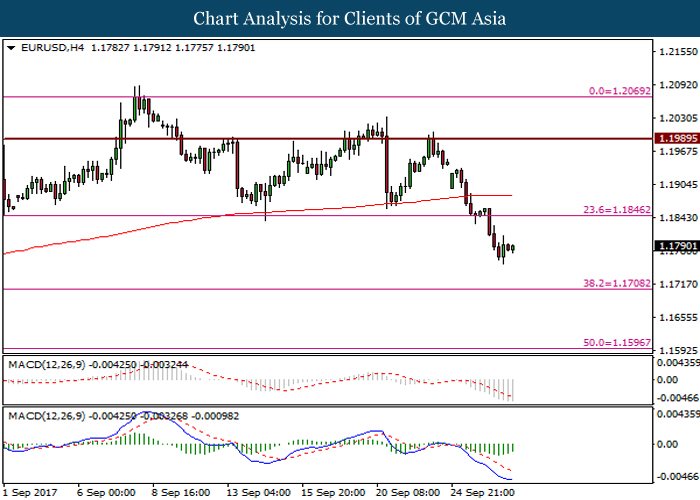
EURUSD
EURUSD, Daily: EURUSD was traded higher following prior rebound while remained pressured below both MA lines. Both lines which continues to narrow downwards suggests further downside bias for the pair to extend its losses towards the support level of 1.1680.
Resistance level: 1.1865, 1.2090
Support level: 1.1680, 1.1425
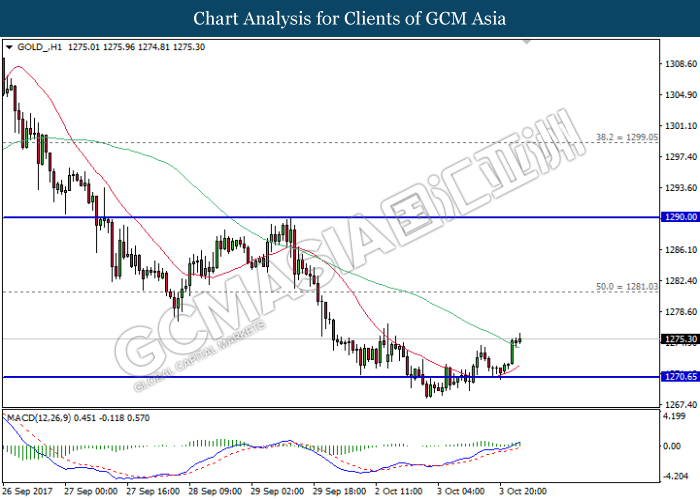
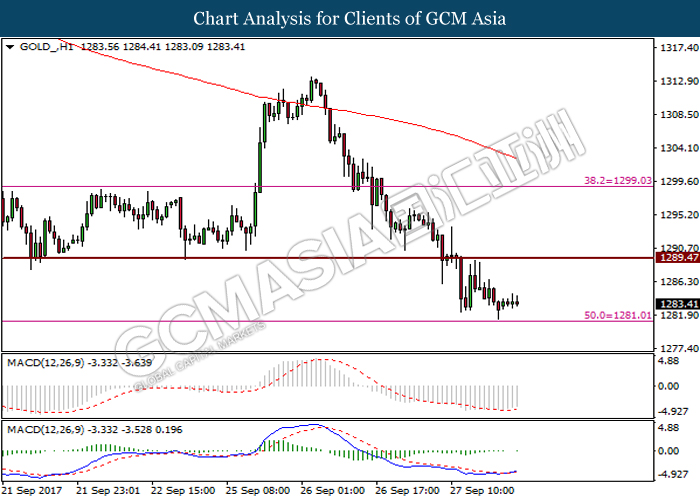
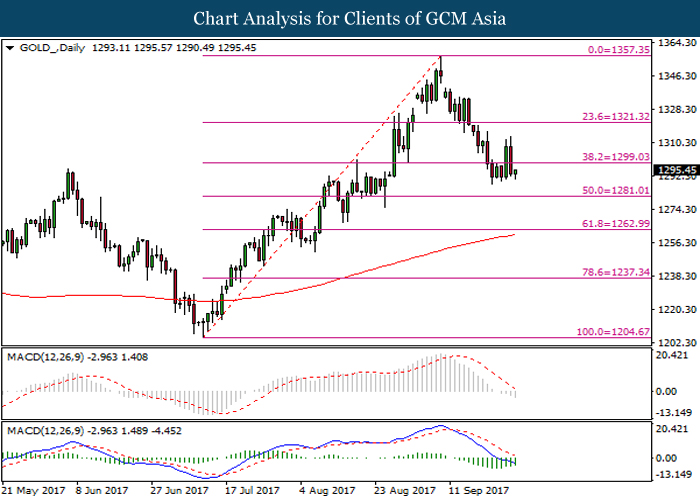
GOLD
GOLD_, Daily: Gold price extended its losses following previous closure below the strong support level near 1281.00. Such price action while coupled with ongoing downward signal from MACD histogram suggests gold price to advance further down, towards the first target at 1263.00.
Resistance level: 1281.00, 1299.05
Support level: 1263.00, 1237.35
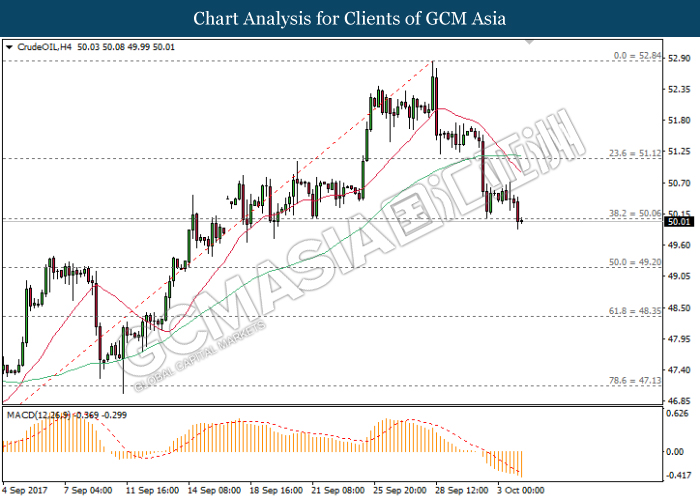
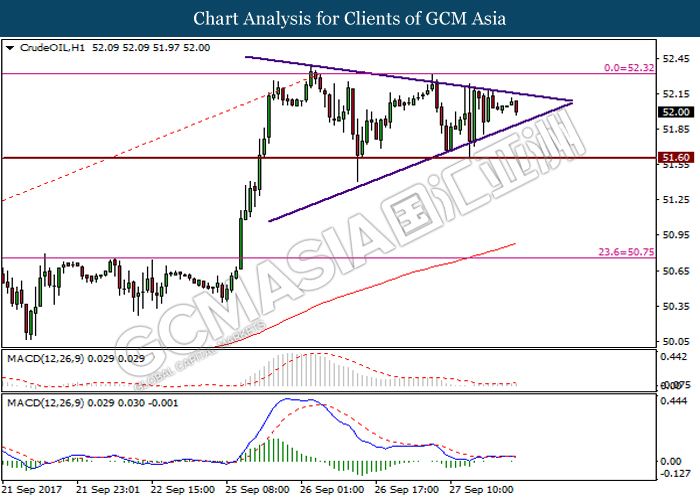
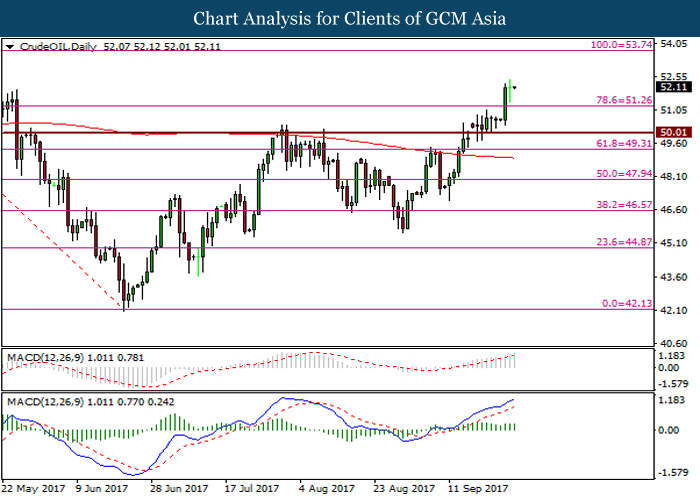
Crude Oil
CrudeOIL, Daily: Crude oil price was traded lower following prior retrace while currently testing at the support level of 51.60. Upward signal from MACD histogram which continues to diminish suggests further downside bias and its price is expected to advance further downwards after closing below the level of 51.60.
Resistance level: 53.00, 54.40
Support level: 51.60, 50.00
290917 Daily Analysis
29 September 2017 Daily Analysis
U.S. administration uncertainty, Greenback’s bull on hold.
Dollar index languished by 0.1% below its highest level since August 18th of 93.666 to 93.155, as a result of investors pondered upon Trump administration’s tax plan and the outlook for Federal Reserve policy. According to statements by market strategists, they explained the current retracement of dollar index was probably due to traders taking profits in the wake of the dollar’s rally as well as fading market sentiment into a realization that the progress of tax reform may not be easy. Later tonight, market focus will be directed to U.S. economic data including the personal consumption expenditures (PCE) price index for August. On the other hand, EUR/USD held steady at $1.1780, down 0.06%; GBP/USD eased 0.16% to $1.3419, USD/JPY traded at 112.56, up 0.23%.
In the commodity market, crude oil prices settled higher by 0.06% at $51.59, following threats from Turkey to restrict oil trading with Iraqi Kurds after they backed independence from Baghdad. Otherwise, gold prices remained flat, trading at $1285.97 with a slight increase of 0.04%. Its previous downside momentum was limited following overnight dollar weakness.
Today’s Holiday Market Close
Time Market Event
N/A
Today’s Highlight Events
Time Market Event
22:15 EUR ECB President Draghi Speaks
22:45 GBP BoE Gov Carney Speaks
23:00 USD FOMC Member Harker Speaks
Today’s Highlight Economy Data
| Time | Nation & Data | Previous | Forecast | Actual |
| 09:45 | CNY – Caixin Manufacturing PMI (Sep) | 51.6 | 51.5 | * |
| 15:55 | EUR – German Unemployment Change (Sep) | -5K | -5K | – |
| 16:30 | GBP – GDP (QoQ) (Q2) | 0.3% | 0.3% | – |
| 17:00 | EUR –CPI (YoY) (Sep) | 1.5% | 1.6% | – |
| 20:30 | USD – Core PCE Price Index (MoM) (Aug) | 0.1% | 0.2% | – |
| 20:30 | USD – Personal Spending (MoM) (Aug) | 0.3% | 0.1% | – |
| 20:30 | CAD – GDP (MoM) (Jul) | 0.3% | 0.1% | – |
| 21:45 | USD – Chicago PMI (Sep) | 58.9 | 58.5 | – |
| 01:00 | CrudeOIL – US Baker Hughes Oil Rig Count | 744 | – | – |
GBPUSD
GBPUSD, H4: GBPUSD was traded higher prior breaking above the top of the descending triangle. Upward slope of MACD histogram suggests GBPUSD to continue its bullish momentum toward the resistance level at 1.3470.
Resistance level: 1.3470, 1.3580
Support level: 1.3360, 1.3255
EURUSD
EURUSD, H4: EURUSD was traded higher after its rebound from support level at 1.1715. Upward slope of MACD histogram suggests the pair to undergo technical correction to trade higher toward the resistance level at 1.1820.
Resistance level: 1.1820, 1.1880
Support level: 1.1715, 1.1660
USDJPY
USDJPY, H4: USDJPY was traded higher prior its rebound from the bottom level of ascending triangle. Formation of pin bar at the bottom level of the ascending triangle suggests the pair is still on bullish momentum to trade higher, testing the resistance level at 113.00
Resistance level: 113.00, 114.30
Support level: 111.65, 110.00
CrudeOIL
CrudeOIL, H1: Crude oil price was traded lower following prior retracement while currently testing at the resistance level of 51.65. A breakout of the said resistance level is required for the price of crude oil to gain its bullish momentum.
Resistance level: 51.65, 52.30
Support level: 50.70, 49.60
GOLD
GOLD_, Daily: Gold price was traded lower prior breaking below support level at 1297.05. Downward slope of MACD signal line suggests gold price to further its losses toward the resistance by 200-MA line around 1260.40.
Resistance level: 1297.05, 1341.80
Support level: 1260.40, 1249.70
280917 Daily Analysis
28 September 2017 Daily Analysis
Dollar soared higher, U.S. data under further examination.
Dollar index was traded higher against a basket of currencies near its one-month high at 93.40, with a total of 1.3% gains this week due to positive market sentiment toward U.S. President Donald Trump’s proposal to cut taxes for most Americans. However, criticism were catalyzed around the plan as it may benefit only to the rich and companies, as well as it could cause a deficit of trillions of dollars in the future. In addition, an upbeat data on U.S. durable goods orders added further support to the Greenback, which indirectly benefited U.S. 10-year treasury yield to reach to its highest since August 1st at 2.316 percent. However, based on views by market strategists, the greenback is still far from being a “strong rebound”. A couple of U.S. data will be on-eyed such as the personal consumption expenditures (PCE) price index for August and U.S. jobs data to further gauge the strength of the Greenback.
In the commodity market, crude oil prices slipped by 0.33%, traded at $51.97 after U.S crude inventories shown a surprise fall albeit a sharp rise in US crude production. Likewise, gold prices fell sharply by 1.02% to $1284.45 a troy ounce amid an increase in the strength of the Greenback as fuelled by rising expectations for a year-end rate hike and Trump’s tax reform.
Today’s Holiday Market Close
Time Market Event
N/A
Today’s Highlight Events
Time Market Event
04:00 NZD RBNZ Rate Statement
07:00 USD FOMC Member Rosengren Speaks
14:35 JPY BoJ Govenor Kuroda Speaks
16:15 GBP BoE Govenor Carner Speaks
21:45 USD FOMC Member George Speaks
22:15 USD FOMC Member Stanley Fischer Speaks
Today’s Highlight Economy Data
| Time | Nation & Data | Previous | Forecast | Actual |
| 04:00 | NZD – RBNZ Interest Rate Decision | 1.75% | 1.75% | 1.75% |
| 20:00 | EUR – German CPI (MoM) (Sep) | 0.1% | 0.1% | – |
| 20:30 | USD – GDP (QoQ) (Q2) | 3.0% | 3.0% | – |
| 20:30 | USD – Initial Jobless Claims | 259K | 270K | – |
GBPUSD
GBPUSD, H4: GBPUSD was traded within descending triangle and is currently testing the support level at 1.3375. Successful breakout below the said support level would suggest further downside bias for the pair, heading toward the next support level at 1.3255.
Resistance level: 1.3470, 1.3645
Support level: 1.3375, 1.3255
EURUSD
EURUSD, Daily: EURUSD was traded lower prior successful breakout below support level at 1.1845. Death cross as formed by MACD histogram suggests the pair to continue its bearish momentum, heading toward the next support level at 1.1705.
Resistance level: 1.1845, 1.2070
Support level: 1.1705, 1.1595
USDJPY
USDJPY, H4: USDJPY was traded higher its rebound from support level at 111.65. The pair is currently testing the resistance level at 113.00. Successful breakout above the said resistance level suggests the pair to continue its bullish momentum toward the next resistance level at 114.30.
Resistance level: 113.00, 114.30
Support level: 111.65, 110.00
CrudeOIL
Crude OIL, H1: Crude oil prices was traded within symmetry triangle. A breakout above the top or below the bottom of the triangle is required to determine a clearer indication for the price movement.
Resistance level: 52.30, 52.80
Support level: 51.60, 50.75
GOLD
GOLD_, H1: Gold prices was traded higher prior its rebound from support level at 1281.00. Formation of pin bar and upward slope of MACD histogram suggests gold prices to undergo short-term technical correction, trading higher toward the resistance level at 1289.45.
Resistance level: 1289.45, 1299.00
Support level: 1281.00, 1272.00
270917 Daily Analysis
27 September 2017 Daily Analysis
Yellen reaffirms raising rates, greenback remains stronger.
Dollar index grew stronger against a basket of major currencies with an increase of 0.11%, traded around 92.91 as of written. Overnight, Fed Chair Janet Yellen’s reaffirmation regarding central bank’s view to increasing rates gradually is the most suitable policy measure. Her statement has led investors to mull over that the slowing pace of inflation could keep interest rates to remain lower for a longer time, thereby decreasing the central bank’s ability to ease monetary policy during market distress. On the other hand, dollar-bull remains limited as duo economic reports namely consumer confidence and the housing sector did not perform well; with new home sales decreased 3.4% to its lowest level since December 2016 with a seasonally adjusted annual rate of 560,000 units in August, as compared to a forecast of an increase of 3.3% to a pace of 588,000 units last month. Next, a report from the Conference Board stated that index of consumer confidence decreased from a reading of 120.4 in August to 119.8 this month.
In the commodity market, crude oil prices settled higher at $52.09 per barrel with an increase of 21 cents following American Petroleum Institute (API) data that shows a surprise draw of U.S. crude oil inventories by 761,000 barrels as compared with a 2.296 million barrels build expected. Otherwise, gold prices decreased by 0.13% to $1295.31 per troy ounce, after market sentiment toward Fed to increase interest rates heightened following Fed Chair Janet Yellen’s speech.
Today’s Holiday Market Close
Time Market Event
N/A
Today’s Highlight Events
Time Market Event
23:45 CAD BoC Gov Poloz Speaks
00:55 CAD BoC Gov Poloz Speaks
01:30 USD FOMC Member Bullard Speaks
02:00 USD FOMC Member Brainard Speaks
Today’s Highlight Economy Data
| Time | Nation & Data | Previous | Forecast | Actual |
| 20:30 | USD – Core Durable Goods Orders (MoM) (Aug) | 0.6% | 0.2% | – |
| 22:00 | USD – Pending Home Sales (MoM) (Aug) | -0.8% | -0.5% | – |
| 22:30 | CrudeOIL – Crude Oil Inventories | 4.591M | – | – |
GBPUSD
GBPUSD, H4: GBPUSD was traded higher prior its rebound from support level at 1.3400. The pair is currently traded within descending triangle. Upward slope of MACD histogram suggests GBPUSD to be on bias to move higher, testing the top of the descending triangle around level 1.3490.
Resistance level: 1.3490, 1.3645
Support level: 1.3400, 1.3255
EURUSD
EURUSD, H4: EURUSD was traded lower prior breaking below support level at 1.1845. Downward slope of MACD signal line suggests the pair to continue its bearish momentum toward the next support level at 1.1710.
Resistance level: 1.1845, 1.1990
Support level: 1.1710, 1.1595
USDJPY
USDJPY, H4: USDJPY was traded higher after its rebound from support level at 111.65. Golden cross as formed by MACD signal line suggests the pair to continue trading higher toward the next resistance level at 113.00.
Resistance level: 113.00, 114.30
Support level: 111.65, 110.00
CrudeOIL
Crude OIL, Daily: Crude oil price was traded higher after breaking resistance level at 51.25. Upward slope of MACD signal line suggests crude oil price to extend its gains toward the next resistance level at 53.75.
Resistance level: 53.75, 54.35
Support level: 51.25, 50.00
GOLD
GOLD_, Daily: Gold price was traded lower prior breaking below support level at 1299.00. Formation of dark cloud cover candlestick pattern and death cross as shown by MACD histogram suggests gold price to extend its losses toward the next support level at 1281.00
Resistance level: 1299.00, 1321.30
Support level: 1281.00, 1263.00
260917 Daily Analysis
26 September 2017 Daily Analysis
Greenback and Pound Sterling on strong bullish support.
Dollar index was last traded at 92.44 with an increase of 0.53%. The spike increase of Greenback was due to Dudley’s speech by mentioning that the Fed is on track to increasing interest rates gradually following factors suppressing inflation are fading and the fundamentals of U.S. economy are overall positive. In consequence, his speech has sparked fresh hopes within investors to expect a rate hike by the Fed before the end of the year. On the other hand, GBP/USD held steady around 1.3479 with a slight gains of 0.10%. Pound Sterling has recovered from its moderate losses after UK Prime Minister Theresa May’s proposed a transition period of around two years after Brexit, in which access to the single market will continue on current terms. However, rating agency Moody’s downgraded Britain’s credit rating to Aa2 after May made her speech, emphasizing that the government’s debt-reducing plan had been knocked off course and that Brexit would continue to pressure on the economy.
In the commodity market, crude oil price soared to its highest level in 5-months with an increase of 2.95%, traded at $52.12 per barrel. The boost in the crude oil price was due to positive results from the OPEC and Russia’s intentions to decrease the global supply, as well as a warning from Turkish President Tayyip Erdogan that Turkey could cut off the pipeline that carries oil from northern Iraq to the outside world. Likewise, gold prices increased sharply by 1.08% to $1310.98 a troy ounce, following warning by the North Korean Foreign Minister Ri Yong Ho that Pyongyang has the privilege to “shoot down U.S. bombers”, further escalating geopolitical tensions.
Today’s Holiday Market Close
Time Market Event
N/A
Today’s Highlight Events
Time Market Event
06:30 USD FOMC Member Kashkari Speaks
21:30 USD FOMC Member Mester Speaks
22:30 USD FOMC Member Brainard Speaks
00:45 USD Fed Chair Yellen Speaks
Today’s Highlight Economy Data
| Time | Nation & Data | Previous | Forecast | Actual |
| 09:00 | NZD – ANZ Business Confidence (Sep) | 18.3 | – | 0 |
| 22:00 | USD – CB Consumer Confidence (Sep) | 122.9 | 120.0 | – |
| 22:00 | USD – New Home Sales (Aug) | 571K | 585K | – |
| 04:30 | CrudeOIL – API Weekly Crude Oil Stock | 1.443M | – | – |
GBPUSD
GBPUSD, H1: GBPUSD was traded higher prior its rebound from support level at 1.3440. Formation of positive divergence as shown by MACD histogram suggests the pair to trade higher, testing resistance by 200-MA line around 1.3485.
Resistance level: 1.3485, 1.3585
Support level: 1.3440, 1.3315
EURUSD
EURUSD, H1: EURUSD was traded lower after breaking below support level at 1.1865. Golden-cross as formed by MACD signal line suggests the pair to undergo short-term technical correction, trading higher toward current resistance level at 1.1865.
Resistance level: 1.1865, 1.1985
Support level: 1.1820, 1.1715
USDJPY
USDJPY, H4: USDJPY was traded higher after recent rebound from support level at 111.45. A long bearish engulfing candlestick coupled with downward slope of MACD histogram suggests the pair on bias to further its losses, testing back the said support level.
Resistance level: 112.70, 114.00
Support level: 111.45, 110.70
CrudeOIL
Crude OIL, Daily: Crude oil price was traded higher after breaking resistance level at 51.25. Formation of long bullish candlestick and upward slope of MACD signal line suggests crude oil price to extend its gains toward the next resistance level at 53.75.
Resistance level: 53.75, 54.35
Support level: 50.00, 49.30
GOLD
GOLD_, H4: Gold price was traded higher prior breaking above resistance level at 1299.05 and 200-MA line. Upward slope of MACD histogram suggests gold price to continue its momentum to trade higher toward the next resistance level at 1321.35.
Resistance level: 1321.35, 1334.85
Support level: 1299.05, 1289.80
250917 Weekly Analysis
25 September 2017 Weekly Analysis
GCMAsia Weekly Report: September 25 – 29
Market Review (Forex): September 18 – 22
U.S. Dollar
US dollar slipped against other major currencies on Friday following fresh tension between the United States and North Korea. The dollar index lost 0.12% while last quoted around 92.14.
Investors flock to safe haven instruments such as Japanese Yen and Swiss Franc after North Korea stated that they could test a hydrogen bomb at the Pacific Ocean. Such provocation came after US President Donald Trump threatened to “totally destroy” the country in front of the United Nations if North Korea continues to pursue their nuclear weapon ambition.
Prior to this, the dollar hit its highest level since mid-July against the Yen on Thursday after the Bank of Japan kept their interest rate unchanged. Likewise, overall losses posted on the greenback were suppressed after US Federal Reserve signaled to raise their interest rate for the third time by year-end.
USD/JPY
Pair of USD/JPY sheds 0.43% to 111.98 during late Friday trading.
EUR/USD
Euro edged further up against the greenback, posting gains of 0.13% to $1.1957.
GBP/USD
GBP/USD tumbled 0.53% to $1.3510 during late Friday trading session. The pound sterling received higher selling pressure after credit rating agency Moody downgraded United Kingdom’s credit rating to Aa2 from Aa1.
Market Review (Commodities): September 18 – 22
GOLD
Gold prices pushed higher on Friday, shedding its prior losses as risk aversion escalates due to heightened geopolitical risk at the Korean Peninsula. Price of the yellow metal rose 0.51% and settled the week at $1,301.45.
Market demand for the safe haven assets were invigorated after North Korea sparks possibilities to detonate a hydrogen bomb over the Pacific Ocean, in a retaliation towards US President Donald Trump’s speech in front of the United Nations. Investors would flock to safe-havens in the event of higher risk in the market in order to secure their capital value.
Crude Oil
Crude oil price edged higher on Friday, hovering near its highest close in several months due to optimistic outlook for a rebalancing in the global market. Its prices were up 11 cents or 0.2% to $50.66 a barrel. For the week, its prices have gained around 1.5%, cashing in profit for third consecutive week thus far.
Such optimism was sparked after a major meeting between members and non-members of OPEC on Friday boasted record compliance level with their production-cut agreement. The cartel and other major producers has successfully curb their output with a compliance rate of 116% for the month of August, a strong increase from previous month with only 94%.
In the United States, market participants cheered over industrial data which shows a decline pattern in active drilling rigs, suggesting a possible tightening in domestic production. Oilfield services provider Baker Hughes reported that its weekly count of oil rigs was down by 5 to a total of 744, marking its third weekly decline in a row.
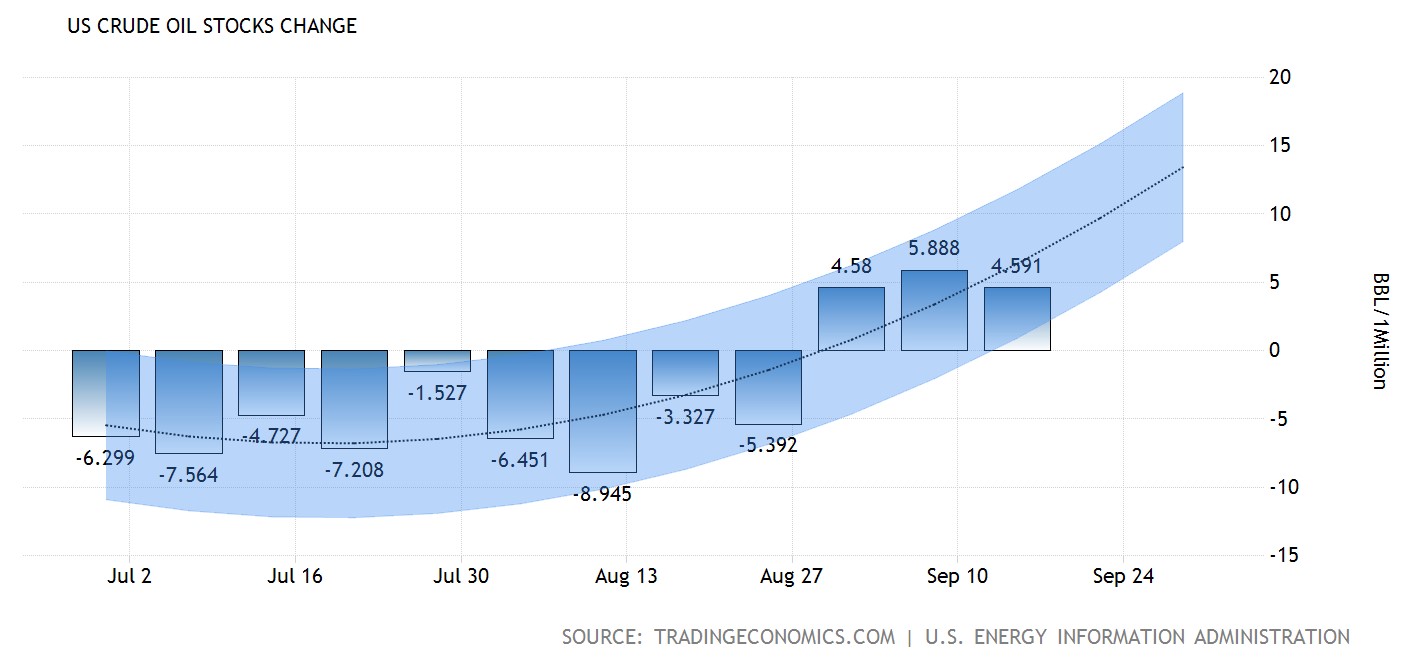
However, gains on the crude oil price were remained limited due to ongoing increase in the US crude inventories. According to the Energy Information Administration, crude oil stock increased for its third consecutive week by 4.591 million barrels last week, reflecting prior shutdown of oil refineries due to onset Hurricane Harvey.
U.S. Baker Hughes Oil Rig Count
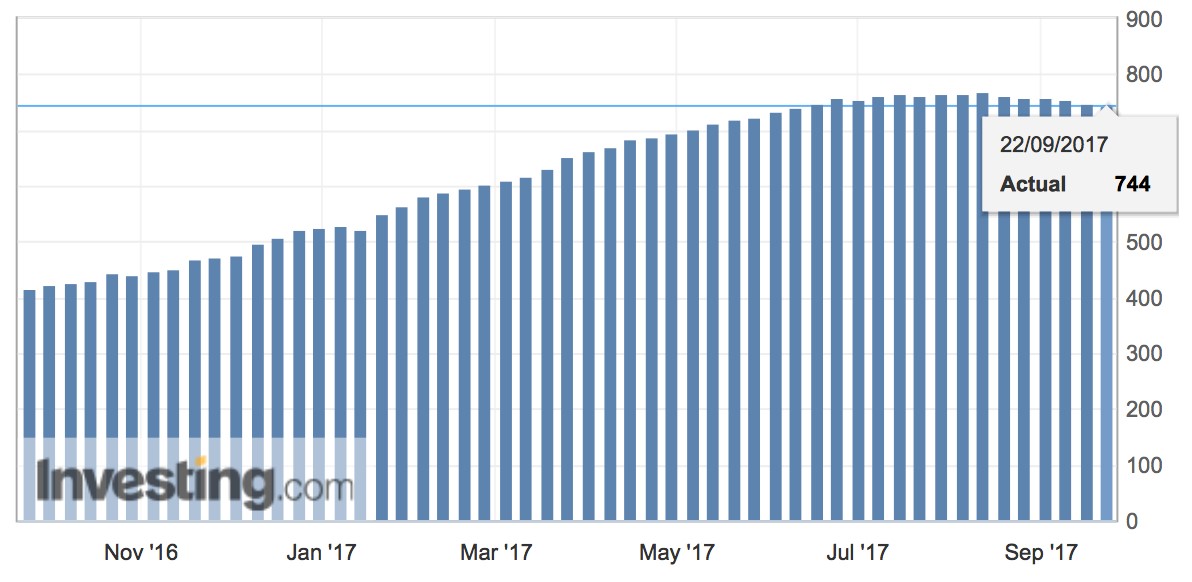
Active drilling rigs in the United States was down by 5 and the total count is currently at 744.
US Crude Oil Stocks Change
—– Forecast
US crude oil stock rose for its third consecutive week by 4.591 million barrels last week.
Weekly Outlook: September 25 – 29
For the week ahead, market participants will turn their attention to Fed Chair Janet Yellen whom will be giving her speech on Tuesday for further clues regarding the next rate hike. Likewise, a pair of speech by ECB President Mario Draghi will be scrutinized for further signals regarding their monetary policy tapering initiatives.
As for oil traders, they will be eyeing on US inventories level reported by API and EIA to gauge the strength of crude demand for world’s largest oil consumer.
Highlighted economy data and events for the week: September 25 – 29
| Monday, September 25 |
Data EUR – German Ifo Business Climate Index (Sep)
Events JPY – BoJ Governor Kuroda Speaks USD – FOMC Member Dudley Speaks EUR – ECB President Draghi Speaks
|
| Tuesday, September 26 |
Data NZD – ANZ Business Confidence (Sep) USD – CB Consumer Confidence (Sep) USD – New Home Sales (Aug)
Events USD – FOMC Member Kashkari Speaks USD – FOMC Member Mester Speaks USD – FOMC Member Brainard Speaks USD – Fed Chair Yellen Speaks
|
| Wednesday, September 27 |
Data CrudeOIL – API Weekly Crude Oil Stock USD – Core Durable Goods Orders (MoM) (Aug) USD – Pending Home Sales (MoM) (Aug) CrudeOIL – Crude Oil Inventories
Events CAD – BoC Gov Poloz Speaks USD – FOMC Member Bullard Speaks USD – FOMC Member Brainard Speaks
|
| Thursday, September 28 |
Data NZD – RBNZ Interest Rate Decision EUR – German CPI (YoY) (Sep) USD – GDP (QoQ) (Q2) USD – Initial Jobless Claims
Events NZD – RBNZ Rate Statement USD – FOMC Member Rosengren Speaks JPY – BoJ Governor Kuroda Speaks GBP – BoE Gov Carney Speaks USD – FOMC Member George Speaks USD – FOMC Member Stanley Fischer Speaks
|
|
Friday, September 29
|
Data CNY – Caixin Manufacturing PMI (Sep) EUR – German Unemployment Change (Sep) GBP – GDP (QoQ) (Q2) EUR – CPI (YoY) (Sep) USD – Core PCE Price Index (MoM) (Aug) USD – Personal Spending (MoM) (Aug) CAD – GDP (MoM) (Jul) USD – Chicago PMI (Sep) CrudeOIL – US Baker Hughes Oil Rig Count
Events EUR – ECB President Draghi Speaks GBP – BoE Gov Carney Speaks USD – FOMC Member Harker Speaks
|
Technical weekly outlook: September 25 – 29
Dollar Index
DOLLAR_INDX, Daily: The dollar index mends some losses following prior rebound while currently testing at the support level of 92.00. MACD indicator which illustrate diminishing downward momentum suggests the dollar index to extend further up and retest near the top level of downward channel.
Resistance level: 93.00, 94.00
Support level: 92.00, 91.00
GBPUSD
GBPUSD, Daily: GBPUSD was traded higher following prior rebound while currently testing near the resistance level of 1.3560. Both MA lines which continues to expand further up after the formation of golden cross suggest the pair to extend its gains after closing above the target of 1.3560.
Resistance level: 1.3560, 1.3905
Support level: 1.3220, 1.2795
USDJPY
USDJPY, Daily: USDJPY pared its prior losses following a rebound from the support level of 111.65. MACD histogram which illustrate diminishing upward signal may suggest USDJPY to be traded lower in short-term as technical correction. Otherwise, a close above the target of 112.85 would further validate its current upward momentum thereafter.
Resistance level: 112.85, 114.35
Support level: 111.65, 110.85
EURUSD
EURUSD, Daily: EURUSD remains traded within an upward channel while currently testing at the bottom level. MACD histogram which shows substantial downward momentum suggests possibility to occur a breakout and signal a change in trend direction to move further downwards thereafter.
Resistance level: 1.2100, 1.2340
Support level: 1.1910, 1.1610
GOLD
GOLD_, Daily: Gold price was traded lower following prior retracement from the resistance level of 1299.05. Both signal line from MACD histogram which continues to expand downwards suggests gold price to extend its downward momentum after closing below the 60-MA line (green).
Resistance level: 1299.05, 1321.35
Support level: 1281.00, 1263.00
CrudeOil
CrudeOIL, Daily: Crude oil price was traded within an upward wedge following prior retracement from the top level. MACD indicator which illustrate diminishing upward momentum suggests its prices to be traded lower in short-term, towards the support level of 50.00.
Resistance level: 51.65, 53.00
Support level: 50.00, 48.50
220917 Daily Analysis
22 September 2017 Daily Analysis
Greenback’s bull momentum faded despite positive data.
Dollar index was traded lower against a basket of major currencies after depreciating by 0.27% to 91.80 as of writing. Dollar bulls has seemingly gave up some of the post-Fed rally despite a better-than-expectation manufacturing and labor market activity reports. Manufacturing index in August shown an increase to its three-month high from 18.9 to 23.8. In addition, initial jobless claims decreased by 23,000 to 259,000, better than forecasts of 18,000 decline. According to Fed rate monitor tool, more than 70% traders shown positive outlook toward rate hiking by Fed in December. Furthermore, the “dot-plot” signaled that the central bank to see rates increasing to between 1.25% and 1.5% by the end of year 2017. On the other hand, USD/JPY traded at 112.13, down 0.31%; GBPUSD last quoted at 1.3586, up 0.03%; AUD/USD changed hands at 0.7918, down 0.16%; NZDUSD traded at 0.7291, down 0.22%.
In the commodity market, crude oil price increased by 0.12% to 50.57 as investors awaiting signals from OPEC meeting on supply cut extension due later today. Otherwise, gold price appreciates by 0.39% to 1295.65 following a dip of the Greenback.
Today’s Holiday Market Close
Time Market Event
N/A
Today’s Highlight Events
Time Market Event
17:30 EUR ECB President Draghi Speaks
18:00 USD FOMC Member Williams Speak
21:30 USD FOMC Member George Speaks
01:30 USD FOMC Member Kaplan Speaks
Tentative GBP UK Prime Minister May Speaks
Today’s Highlight Economy Data
| Time | Nation & Data | Previous | Forecast | Actual |
| 15:30 | EUR – German Manufacturing PMI (Sep) | 59.3 | 59.0 | – |
| 20:30 | CAD – Core CPI (MoM) (Aug) | -0.1% | – | – |
| 20:30 | CAD – Core Retail Sales (MoM)(Jul) | 0.7% | 0.4% | – |
| 21:45 | USD – Manufacturing PMI (Sep) | 52.8 | 53.0 | – |
| 21:45 | USD – Markit Composite PMI | 55.3 | – | – |
| 21:45 | USD – Services PMI (Sep) | 56.0 | 56.0 | – |
| 01:00 | CrudeOIL – US Baker Hughes Oil Rig Count | 749 | – | – |
GBPUSD
GBPUSD, H4: GBPUSD was consolidating within the box with resistance level 1.3618 and support level 1.3450. Upward slope of MACD histogram suggests the pair to gain further bull momentum to trade upward if breakout of the said resistance level is successful.
Resistance level: 1.3615, 1.3810
Support level: 1.3450, 1.3250
EURUSD
EURUSD, H4: EURUSD was traded higher prior its rebound from support level at 1.1870. Positive divergence as shown by MACD histogram suggests EURUSD to continue its momentum to trade higher toward the resistance level at 1.1985.
Resistance level: 1.1985, 1.2070
Support level: 1.1870, 1.1820
USDJPY
USDJPY, H1: USDJPY was traded lower prior its retracement from resistance level at 112.70. Formation of negative divergence as shown by MACD histogram suggests the pair to further its losses toward the support level at 111.45.
Resistance level: 112.70, 112.90
Support level: 111.45, 110.70
CrudeOIL
Crude OIL, H4: Crude oil price is consolidating in between resistance level at 51.10 and support level at 50.00 with no obvious momentum shown by MACD histogram. Crude oil price is to break either the said resistance level or support level for further clarification of the price movement.
Resistance level: 51.10, 51.90
Support level: 50.00, 49.15
GOLD
GOLD_, H4: Gold price was traded higher prior its rebound from support level at 1289.80. Formation of positive divergence as shown by MACD histogram suggests gold price to further its gains toward resistance level at 1299.05.
Resistance level: 1299.05, 1321.35
Support level: 1289.80, 1281.05
210917 Daily Analysis
21 September 2017 Daily Analysis
Fed to increase interest rate, dollar bulls in momentum.
Dollar index has regained its strength against the other major currencies after a rise of 0.15% to 92.36, after Fed took decision to paring back its balance sheet and its outlook for increasing interest rates. According to Federal Reserve, it would begin to unwind $4.5 trillion starting in the month of October and signaled to increase interest rates for the third time this year, further assuring investors by stating that economy expansion in United States would not be influenced by the recent hurricane damage. The policy makers kept interest rate unchanged within 1 percent to 1.25 percent, on par with expectation. “We continue to expect that the ongoing strength of the economy will warrant gradual increases in that rate to sustain a healthy labor market and stabilize inflation around our 2 percent longer-run objective,” stated Fed Chair Janet Yellen during a press conference. On the other hand, USD/JPY traded at 112.49, up 0.20%; AUD/USD traded at 0.8005, down 0.20%, NZD/USD fell 0.29% to 0.7333.
In the commodity market, crude oil price was traded flat at $50.69 per barrel while investors continue to assess recent developments in the oil market such as increasing crude inventories and hawkish signal from Iraq’s oil minister. Otherwise, gold prices extended its losses by 13%, trading around $1299.35 per troy ounce following a rise in dollar index due to positive FOMC outlook.
Today’s Holiday Market Close
Time Market Event
N/A
Today’s Highlight Events
Time Market Event
Tentative JPY BoJ Monetary Policy Statement (YoY)
Tentative JPY BoJ Press Conference
21:30 EUR ECB President Draghi Speaks
Today’s Highlight Economy Data
| Time | Nation & Data | Previous | Forecast | Actual |
| 06:45 | NZD – GDP (QoQ)(Q2) | 0.8% | 0.8% | 0.6% |
| 11:00 | JPY – BoJ Interest Rate Decision | -0.10% | -0.10% | – |
| 20:30 | USD – Initial Jobless Claims | 284K | 300K | – |
| 20:30 | USD – Philadelphia Fed Manufacturing Index (Sep) | 18.9 | 17.2 | – |
| 20:30 | CAD – Wholesale Sales (MoM) (Jul) | -0.5% | -0.9% | – |
GBPUSD
GBPUSD, H4: GBPUSD was traded lower prior its retracement from the top of ascending channel around level 1.36180. Downward slope of MACD histogram suggests the pair to continue its momentum to trade lower, testing the bottom of the ascending channel and support level at 1.3250.
Resistance level: 1.3615, 1.3810
Support level: 1.3250, 1.3155
EURUSD

EURUSD, H4: EURUSD was traded lower after breaking below support level at 1.1985. The pair is currently testing resistance by 200-MA line around level 1.1870. Successful breaking below the said moving level coupled with death cross of MACD signal line suggests further downward momentum for the pair to trade lower, testing the next support level at 1.1820.
Resistance level: 1.1985, 1.2070
Support level: 1.1870, 1.1820
USDJPY
USDJPY, Daily: USDJPY was traded higher prior its successful breakout above resistance by 200-MA line and resistance level at 111.65. Formation of long bullish candlestick and upward slope of MACD signal line suggests the pair to gain increasing momentum to trade higher, testing the next resistance level at 112.95.
Resistance level: 112.95, 114.30
Support level: 111.65, 110.00
CrudeOIL
CrudeOIL, H4: Crude oil price was traded in ascending channel and is currently consolidating in the range of resistance level at 51.20 and support level at 49.25. Hidden negative divergence as shown by MACD histogram suggests crude oil price on bias to trade lower, testing the bottom of the ascending channel and support level at 49.25.
Resistance level: 51.20, 53.70
Support level: 49.25, 47.90
GOLD
GOLD_, H4: Gold price was traded lower prior breaking below support by 200-MA around 1304.00. It is currently testing the support level at 1299.05. Successful breakout of the said support level would indicate gold price to further its losses toward the next support level at 1281.05.
Resistance level: 1304.00, 1321.35
Support level: 1299.05, 1281.05
200917 Daily Analysis
20 September 2017 Daily Analysis
Dollar index remained flat, FOMC meeting on-eyed.
Dollar index was last traded at 91.62 following a loss of 0.21%. The slowing pace of inflation in United States has garnered investors’ attention toward the Fed’s Summary of Economic Projections and dot-plot, as a measure tool to assess if the sluggish inflation rate has influenced the central bank’s longer-term prospect on its interest rates. Overnight, the Greenback remained unchanged against the other major currencies, factored by dissatisfying U.S. housing sector data with homebuilding reduced 0.8% to a seasonally adjusted annual rate of 1.18 million units in August, much against economists’ estimates of an increase of 1.7%. Meanwhile, losses of the Greenback was limited by an ease of geopolitical uncertainty. On the other hand, the other major currency pairs suffered minor losses as well, with USD/JPY traded at 111.57, down 0.02%; AUD/USD traded at 0.8007, down 0.01% ; NZD/USD traded at 0.7315 after a loss of 0.03%.
In the commodity market, crude oil prices settled lower at $49.48 a barrel, decreasing by 43 cents as data expected to portray an increase in U.S. crude stockpiles consecutively for the third week. Otherwise, gold prices was quoted around $1312.73 per troy ounce after adding up 0.5% despite Trump’s threat to “totally destroy” North Korea while investors placed their focus on the two-day Federal Open Market Committee meeting.
Today’s Holiday Market Close
Time Market Event
N/A
Today’s Highlight Events
Time Market Event
2:00 USD FOMC Economic Projections
2:00 USD FOMC Statement
2:30 USD FOMC Press Conference
Today’s Highlight Economy Data
| Time | Nation & Data | Previous | Forecast | Actual |
| 07:50 | JPY – Trade Balance | 419B | 94B | 114B |
| 16:30 | GBP – Retail Sales (MoM) (Aug) | 0.3% | 0.2% | – |
| 22:00 | USD – Existing Home Sales (Aug) | -1.3% | 0.1% | – |
| 22:30 | CrudeOIL – Crude Oil Inventories | 5.888M | – | – |
| 02:00 | USD – FOMC Interest Rate Decision | 1.25% | 1.25% | – |
GBPUSD
GBPUSD, H1: GBPUSD was traded within descending triangle. The pair is currently on consolidation with no obvious momentum as shown by MACD histogram. A breakout on either the top of the descending triangle or support level at 1.3405 is required for a clearer direction of the pair.
Resistance level: 1.3595, 1.3825
Support level: 1.3465, 1.3405
EURUSD
EURUSD, H4: EURUSD was traded higher prior its breakout above resistance level at 1.1985. Upward slope of MACD signal line suggests the pair to continue its momentum to trade higher toward the resistance level at 1.2070.
Resistance level: 1.2070, 1.2265
Support level: 1.1985, 1.1820
USDJPY
USDJPY, Daily: USDJPY was traded higher prior breaking above resistance by 200-MA line. The pair is currently testing resistance level at 111.65. Successful breakout of the resistance level would indicate the pair to further its upward momentum toward the next resistance level at 112.95.
Resistance level: 111.65, 112.95
Support level: 110.00, 107.30
CrudeOIL
CrudeOIL, H4: Price of crude oil was traded lower prior its retracement from resistance level at 50.80. Downward slope of MACD histogram indicates the price of crude oil to decrease, testing the support level at 50.15.
Resistance level: 50.80, 52.00
Support level: 50.15, 48.70
GOLD
GOLD_, H4: Gold price was traded higher prior its rebound from support level at 1304.50. Cross-over of MACD signal line suggests gold price to trade higher toward the resistance level at 1321.35.
Resistance level: 1321.35, 1334.85
Support level: 1304.50, 1299.05
190917 Daily Analysis
19 September 2017 Daily Analysis
Dollar recoup its losses, Pound Sterling remains sluggish.
Dollar index was last traded at 91.81 after its gains of 0.17%. Dollar grew stronger against a basket of major currencies amid a sharp increase in U.S. treasury yields, following positive market sentiment toward reaffirmation of the Federal Reserve (Fed) to increase interest rates at least once this year. Meanwhile, the central bank is also expected by investors to announce that it will start unwinding its $4.5tn bond portfolio. In addition, the Fed’s Summary of Economic Projections and dot-plot are expected to gain investors’ attention for further assessing if the decreasing pace of inflation has influenced the central bank’s prospect toward interest rates in longer term. On the other hand, GBP/USD was traded at 1.3500 after experiencing a drop of 0.5%, when Bank of England (BoE) Governor Mark Carney emphasized that an expectation is made that any rate hikes would be gradual and limited. Furthermore, a more hawkish tone from Carney is required to fuel another spike to the Pound Sterling which is currently in overbought situation.
In the commodity market, crude oil price remained stable at $50.00 per barrel with minor gain of 0.2%, due to increase in demand from the restart of many refineries previously destroyed by Hurricane Harvey, but capped by increase in U.S. crude supply. Otherwise, gold prices fell by 1.03% to 1306.90 per troy ounce following a strong gains in both the greenback and treasury yields.
Today’s Holiday Market Close
Time Market Event
N/A
Today’s Highlight Events
Time Market Event
09:30 AUD RBA Meeting Minutes
Today’s Highlight Economy Data
| Time | Nation & Data | Previous | Forecast | Actual |
| 06:00 | NZD – Westpac Consumer Sentiment (Q3) | 113.4 | – | 112.4 |
| 17:00 | EUR – German ZEQ Economic Sentiment (Sep) | 10.0 | 12.5 | – |
| 20:30 | USD – Building Permits (Aug) | 1.230M | 1.220M | – |
| 20:30 | USD – Housing Starts (MoM) (Aug) | 1.155M | 1.175M | – |
| 20:30 | CAD – Manufacturing Sales (MoM) (Jul) | -1.8% | -1.8% | – |
| 04:30 | USD – API Weekly Crude Oil Stock | 6.181M |
GBPUSD
GBPUSD, Daily: GBPUSD was traded lower prior its retracement from resistance level at 1.3595. Downward slope of MACD histogram suggests the pair to trade lower as a technical correction toward support level at 1.3395.
Resistance level: 1.3595, 1.4185
Support level: 1.3395, 1.3215
EURUSD
EURUSD, H4: EURUSD was traded lower prior its retracement from resistance level at 1.1985. However, upward slope of MACD signal line suggests the pair to continue its momentum to trade higher, testing again the said resistance level.
Resistance level: 1.1985, 1.2070
Support level: 1.1820, 1.1715
USDJPY
USDJPY, H1: USDJPY was traded lower prior its retracement from resistance level at 111.60. Downward slope of MACD histogram suggests the pair to further its losses toward the support level at 110.80.
Resistance level: 111.60, 112.80
Support level: 110.80, 109.95
CrudeOIL
CrudeOIL, Daily: Price of crude oil was traded higher prior its failure to break below support level at 50.20. Upward slope of MACD signal line suggests crude oil price to further its gains toward the resistance level at 52.00.
Resistance level: 52.00, 55.00
Support level: 50.20, 48.70
GOLD
GOLD_, Daily: Gold price was traded lower after breaking below support level at 1321.35. Downward slope of MACD histogram suggests gold price to further its losses toward the next support level at 1299.05.
Resistance level: 1321.35, 1334.85
Support level: 1299.05, 1281.05