240718 Daily Analysis
24 July 2018 Daily Analysis
Dollar recovers as Mnuchin clarifies.
Greenback recovered from its session low on yesterday after scaling back its losses against the Yen while market participants continue to eye on President Donald Trump’s remarks. The dollar index was up 0.19%, last seen around 94.36 during early Asian trading hours. Prior, Japanese Yen rallied sharply against the US dollar after Reuters report postulate that the Bank of Japan is in discussion to tweak its quantitative easing program. The changes will enable the central bank to offer and buy unlimited amount of bonds and may cause a rise in bond yields. However, the rally in safe-haven Yen was short-lived as market participants place higher prospect towards the United States in terms of economic progression and bullish rate hike stance from Fed Chair Jerome Powell. While Trump expressed his dissatisfaction towards the Fed in tightening their monetary policy, US Treasury Secretary Steven Mnuchin clarified that “no interference was intended to be made with Fed’s decision and the administration supports its independence”. Against other major peers, pair of USD/JPY was up 0.08% to 111.43 while EUR/USD slumped 0.02% to $1.1690.
In the commodities market, crude oil price settled down by 2% to $67.76 per barrel following higher concern towards diminishing demand in the global market due to recent trade war spat. Trump threatened last Friday to impose tariffs upon $500 billion Chinese exports which may downplay global economic growth and leads to slower demand for crude oil in the long-run. Otherwise, gold price was down 0.04% to $1,224.09 a troy ounce following substantial recovery in the US dollar.
Today’s Holiday Market Close
Time Market Event
N/A
Today’s Highlight Events
Time Market Event
N/A
Today’s Highlight Economy Data
| Time | Nation & Data | Previous | Forecast | Actual |
| 15:30 | EUR – German Manufacturing PMI (Jul) | 55.9 | 55.5 | – |
| 16:00 | EUR – Manufacturing PMI (Jul) | 54.9 | 54.7 | – |
| 16:00 | EUR – Markit Composite PMI (Jul) | 54.9 | 54.8 | – |
| 16:00 | EUR – Services PMI (Jul) | 55.2 | 55.0 | – |
| 21:45 | USD – Manufacturing PMI (Jul) | 55.4 | 55.1 | – |
| 21:45 | USD – Services PMI (Jul) | 56.5 | 56.5 | – |
| 04:30 | CrudeOIL – API Weekly Crude Oil Stock | 0.629M | – | – |
GBPUSD
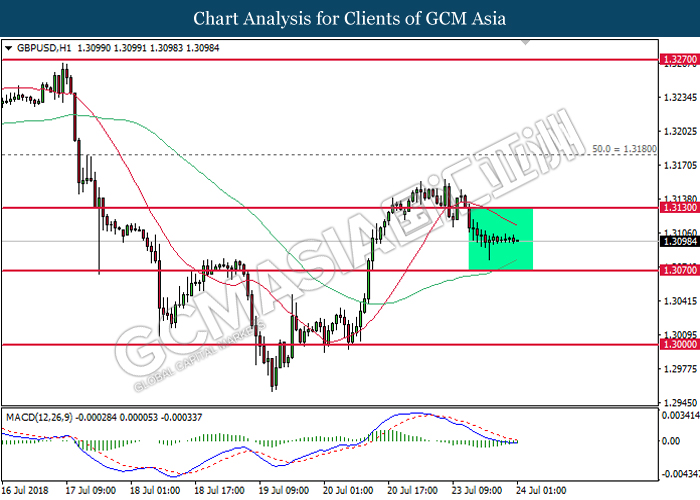
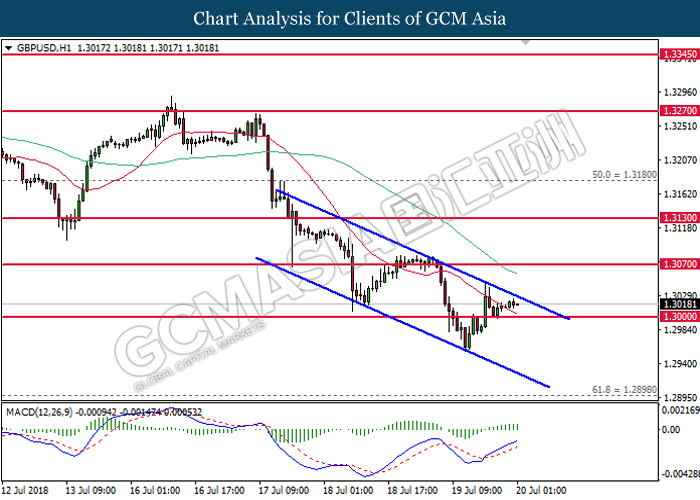
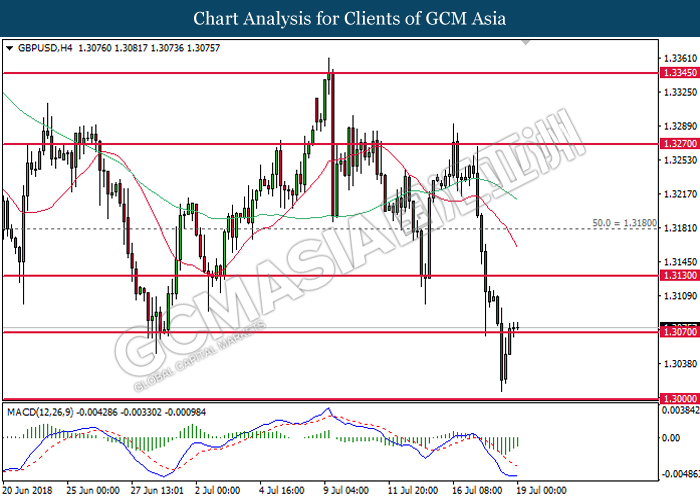
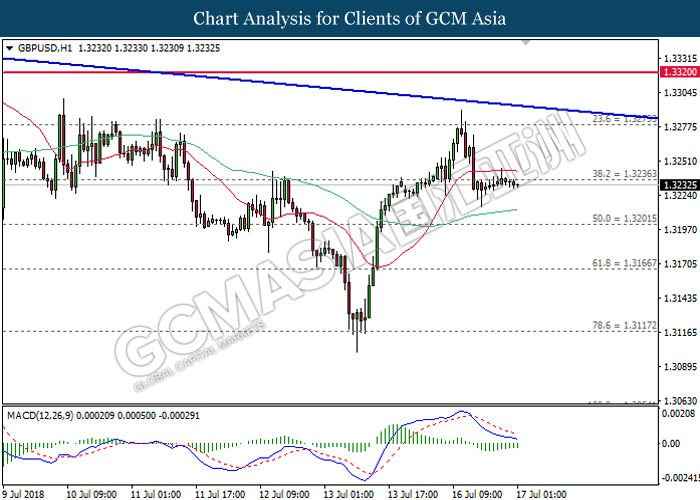
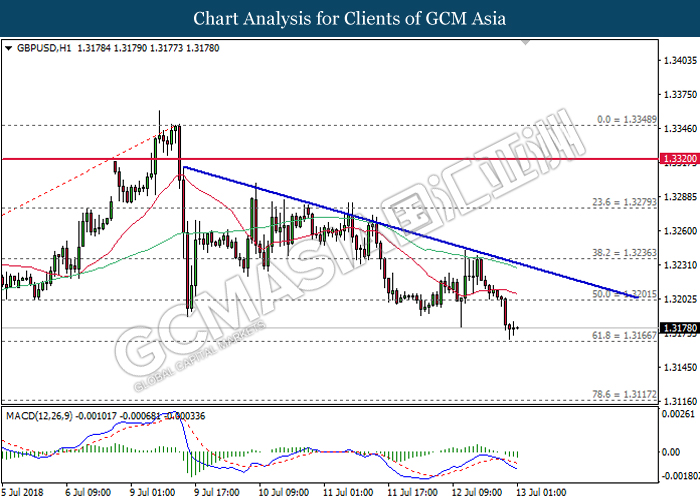
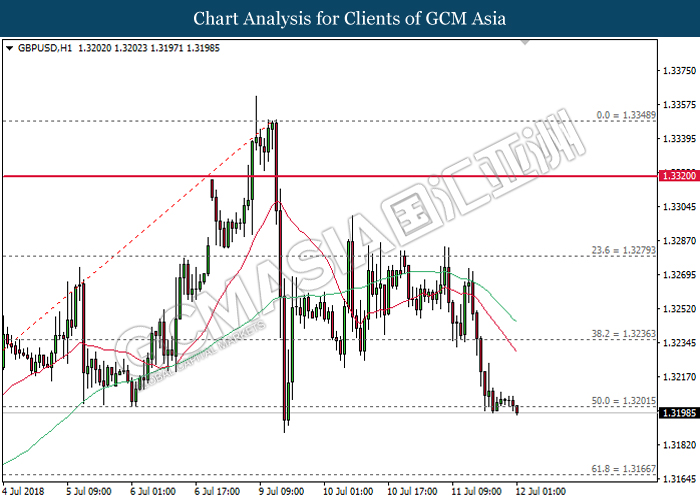
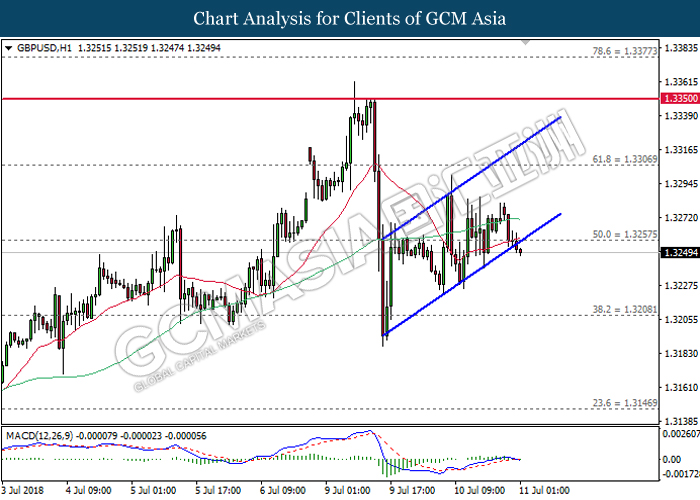
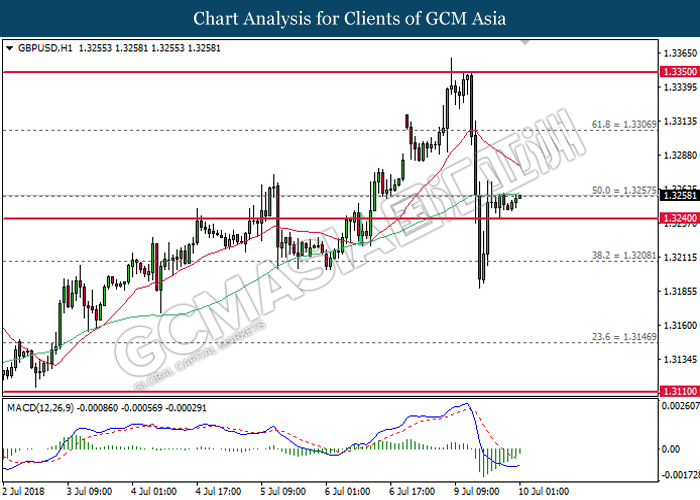
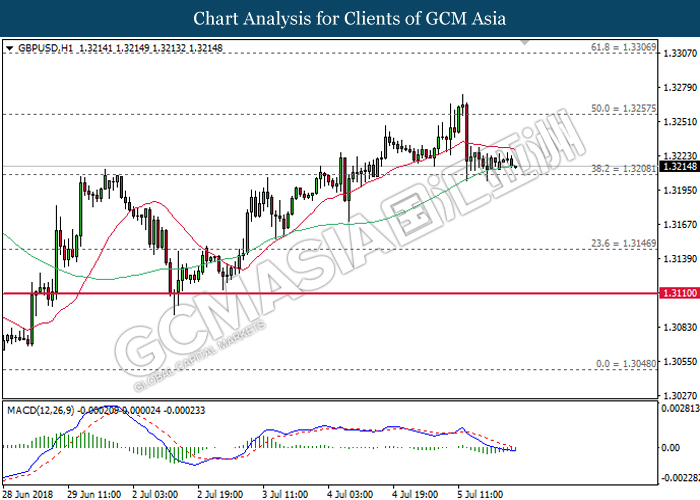
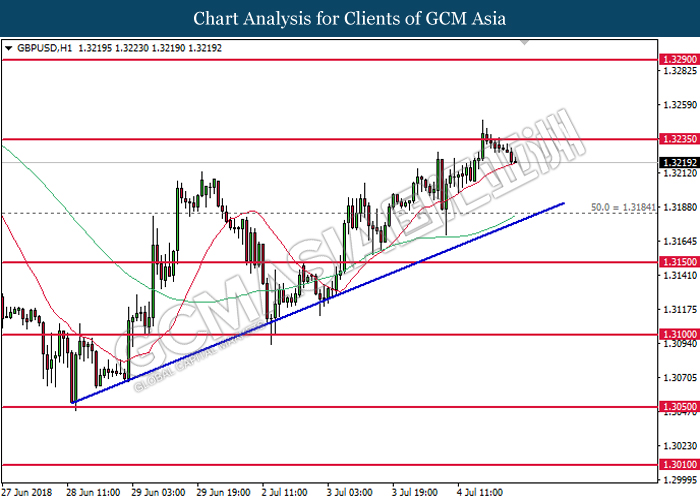
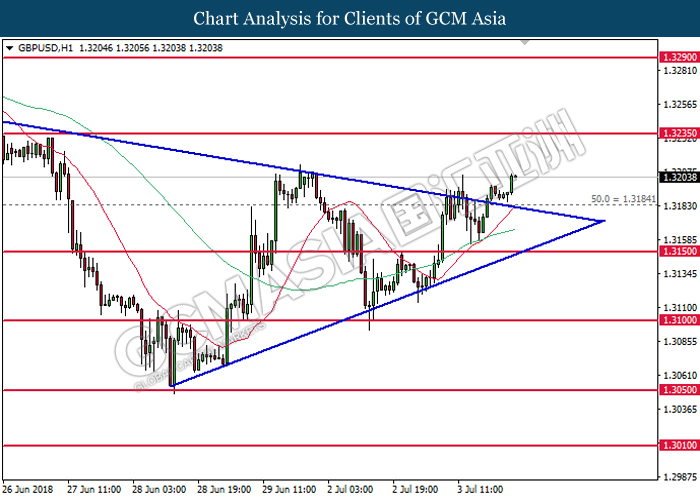
GBPUSD, H1: GBPUSD was traded lower following prior retracement and closure below the 20-MA line (red). Although MACD illustrate bearish signal, recent price action which portrays consolidation suggests to wait for a breakout at 1.3070 to further confirm the downward bias.
Resistance level: 1.3130, 1.3180
Support level: 1.3070, 1.3000
EURUSD
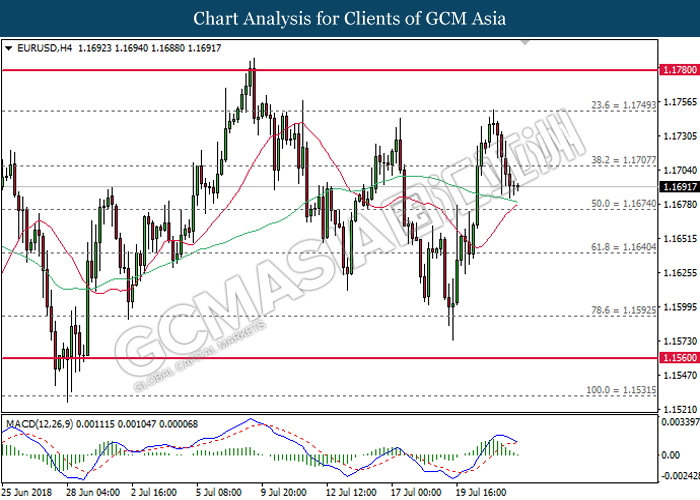
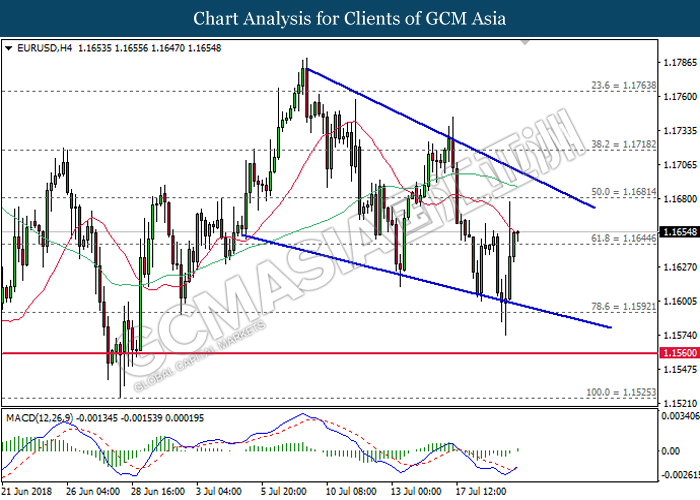
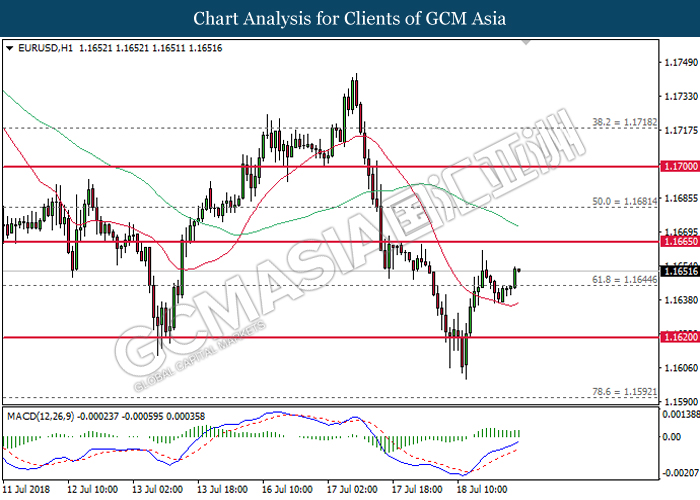
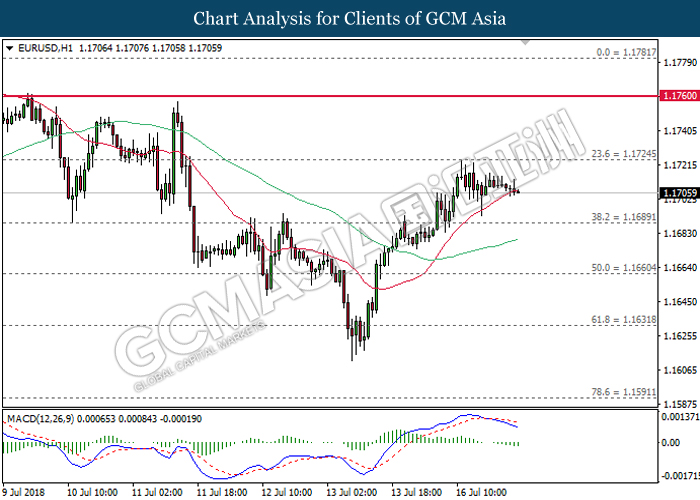
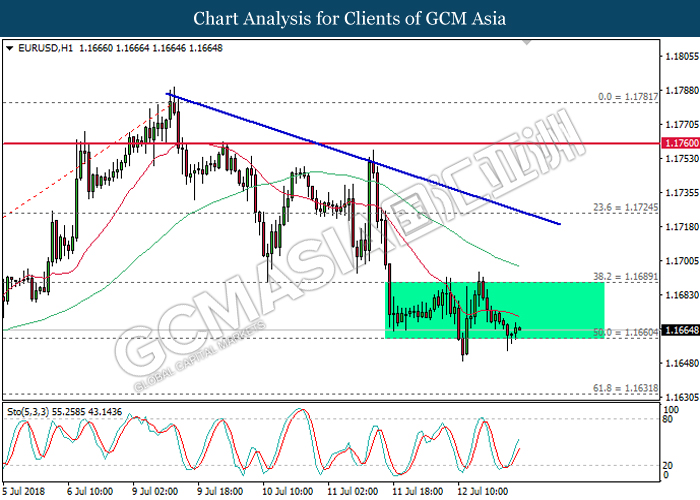
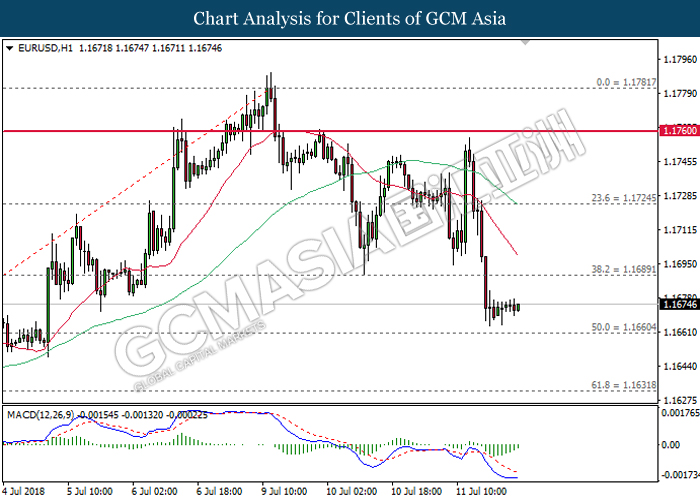
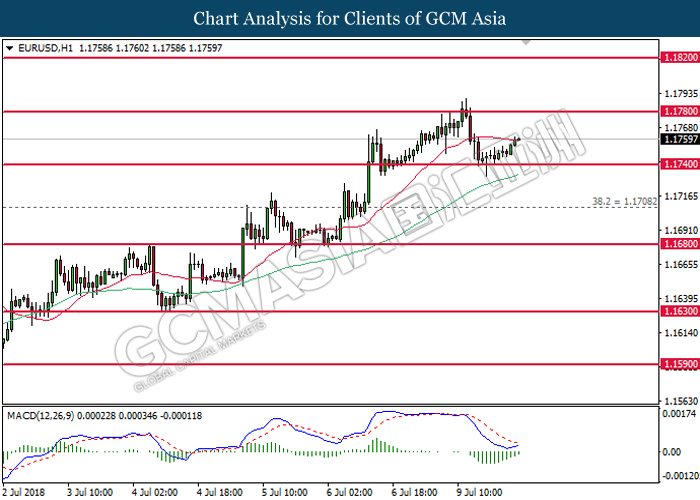
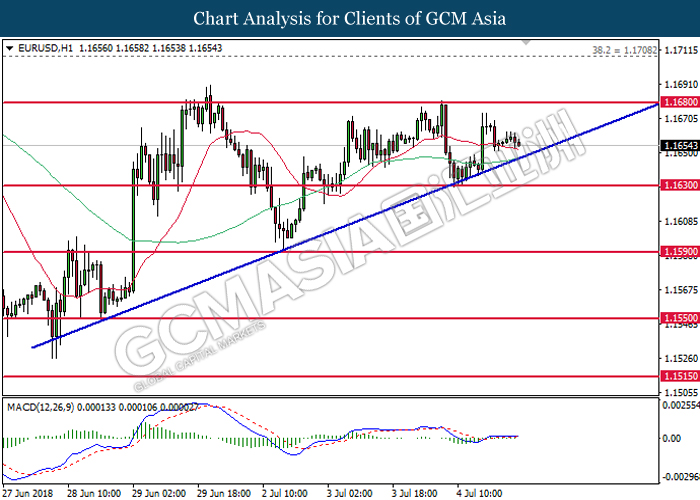
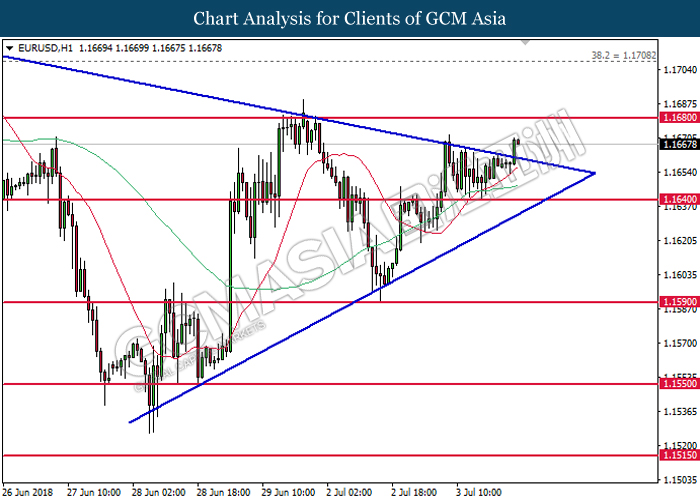
EURUSD. H4: EURUSD was traded lower following prior retracement from the strong resistance near 1.1750. MACD histogram which begins to form a bearish signal suggests further downside bias. However, a close below 1.1675 is required to attain further confirmation.
Resistance level: 1.1710, 1.1750
Support level: 1.1675, 1.1640
USDJPY
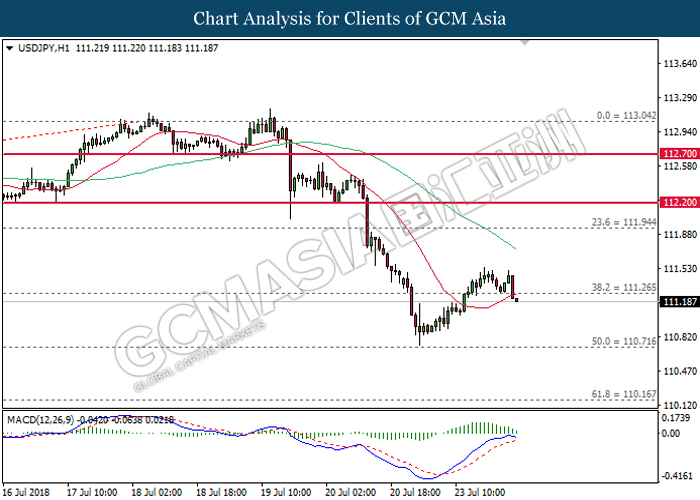
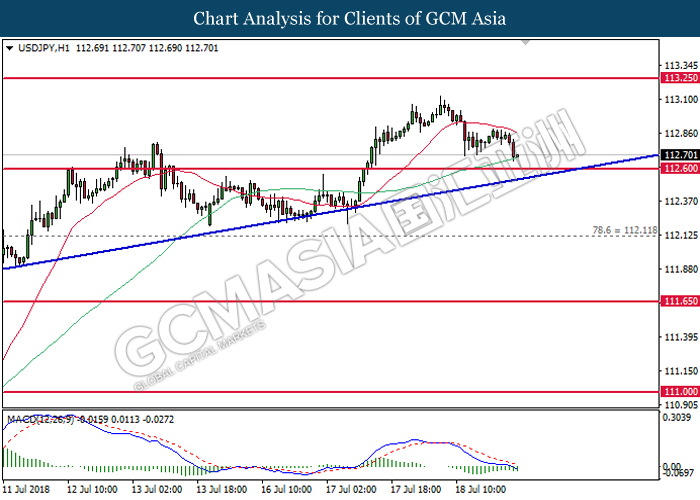
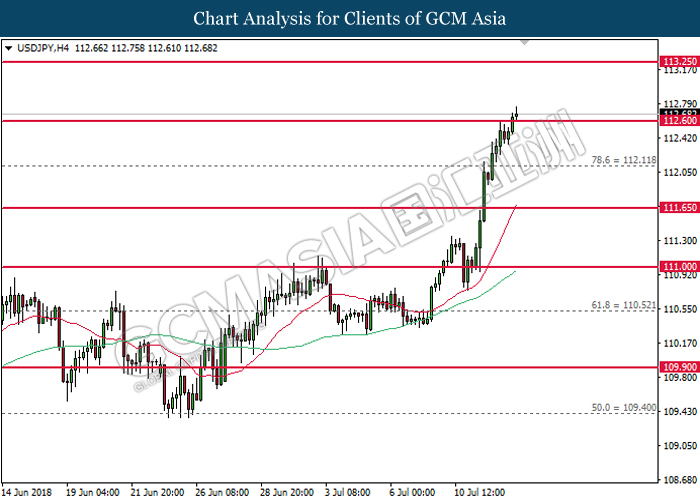
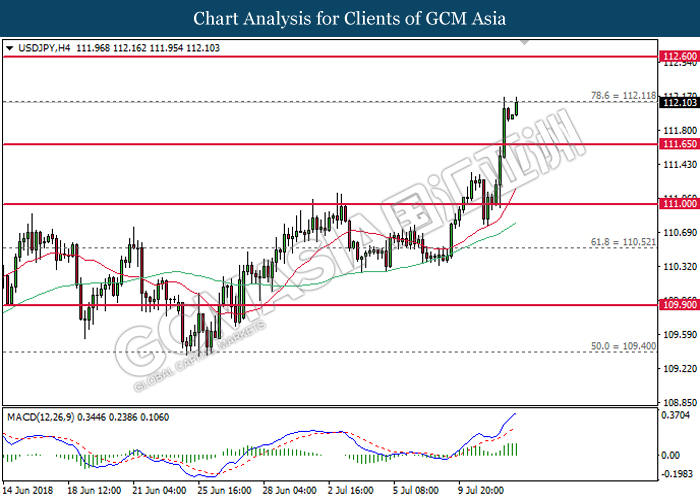
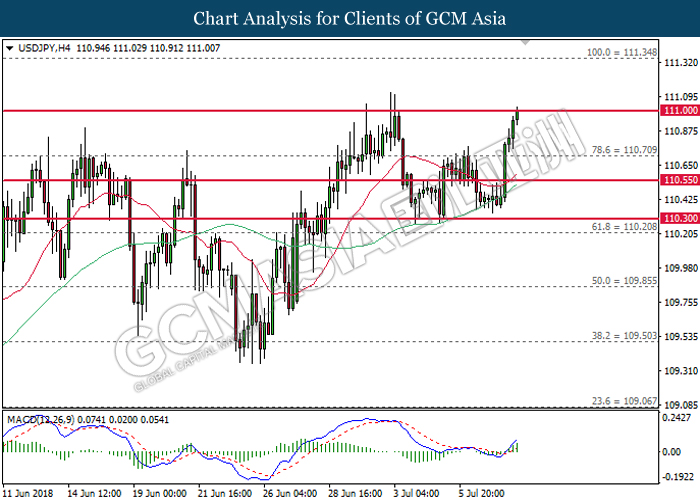
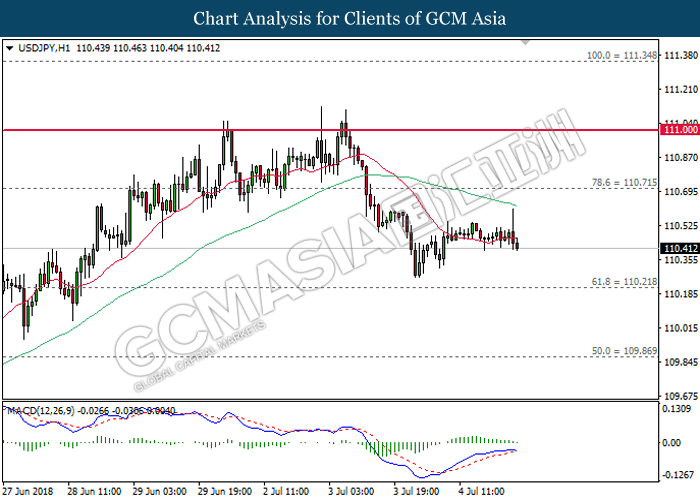
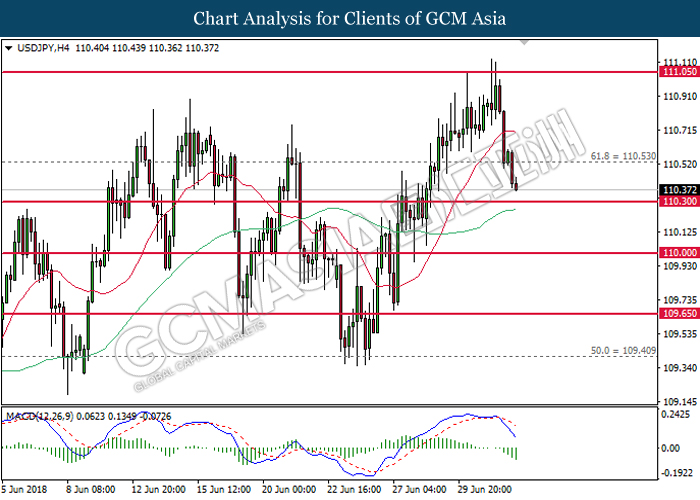
USDJPY, H4: USDJPY was traded higher following prior rebound from the support level of 110.70. However, diminishing upward momentum from MACD suggests the pair to be traded lower in short-term as technical correction.
Resistance level: 111.95, 112.20
Support level: 111.25, 110.70
CrudeOIL
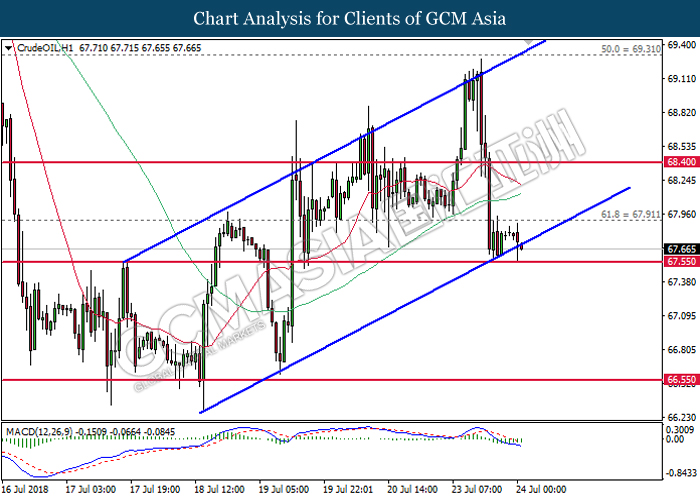
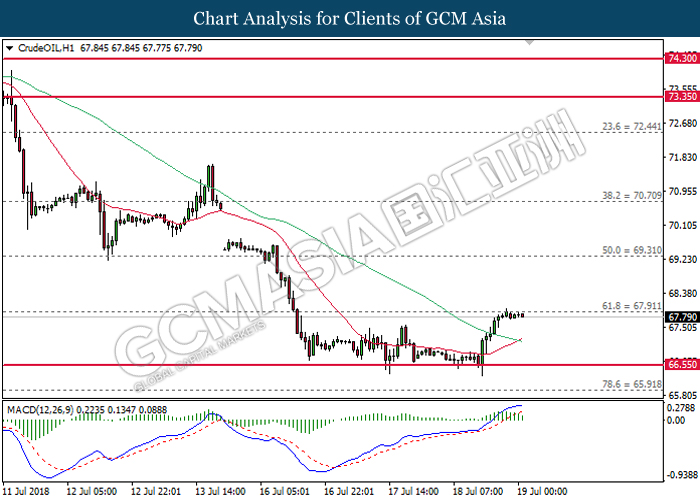
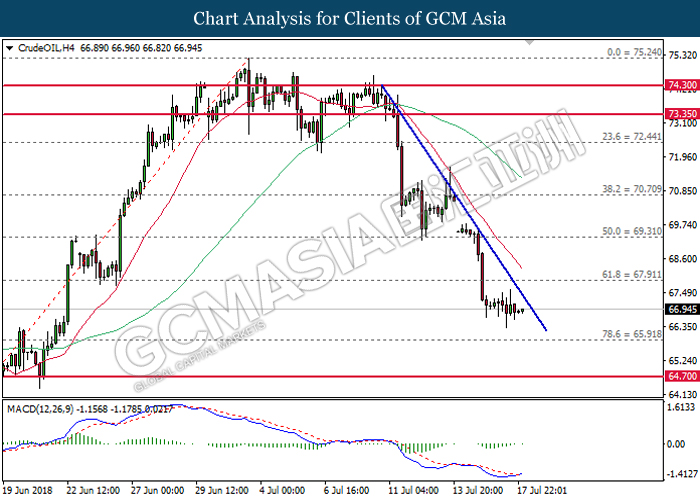
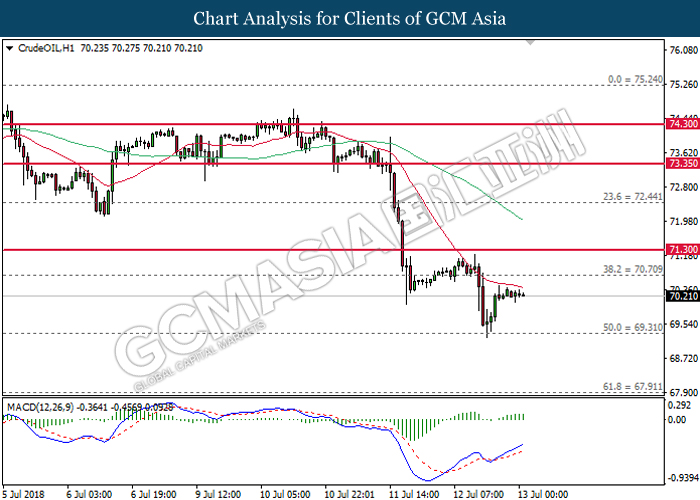
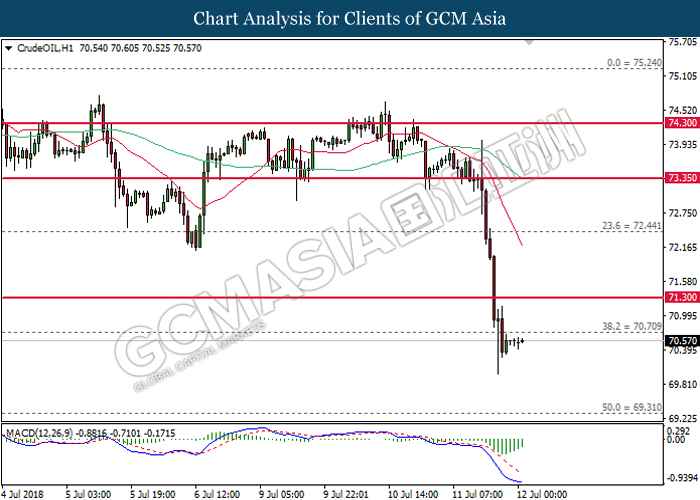
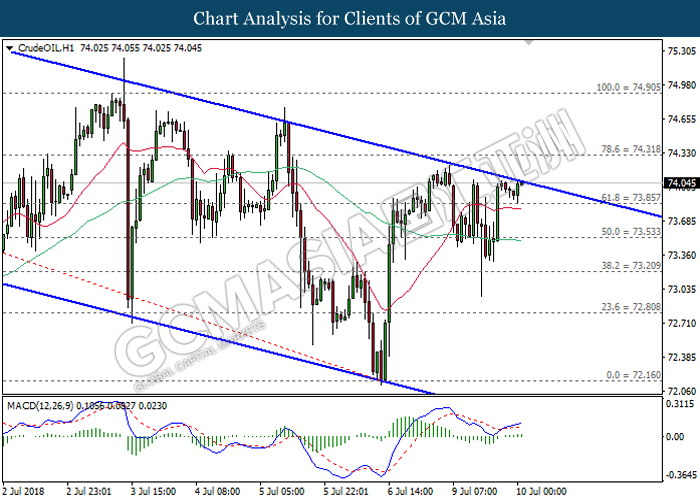
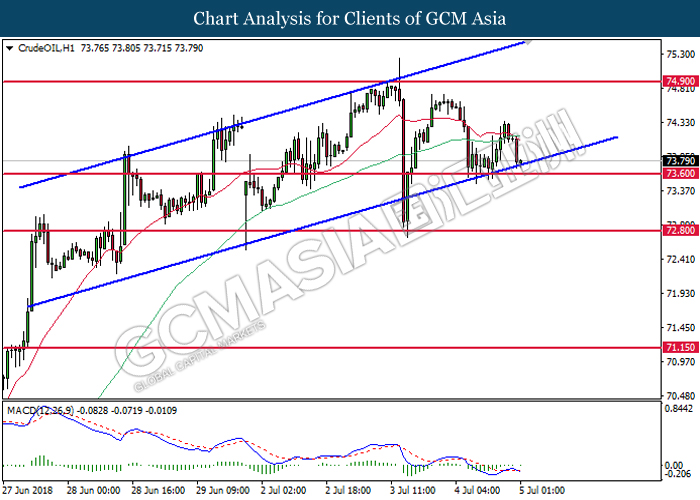
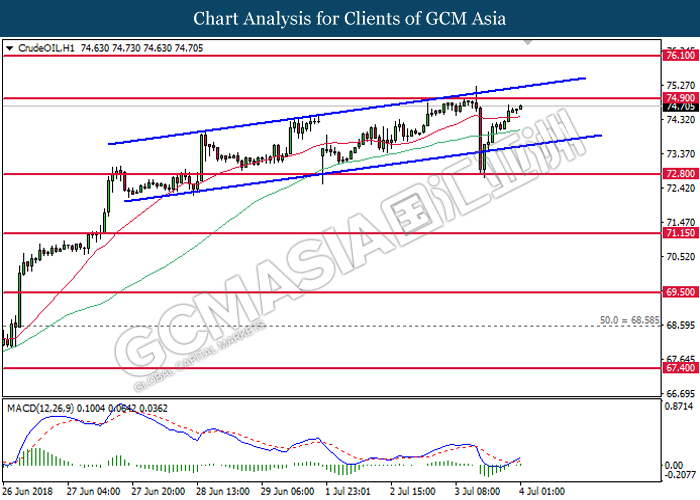
CrudeOIL, H1: Crude oil price remains traded within an ascending channel while currently testing at the bottom level. Although MACD illustrate bearish signal, a break below the channel and target at 67.55 is required to attain further confirmation.
Resistance level: 67.90, 68.40
Support level: 67.55, 66.50
GOLD
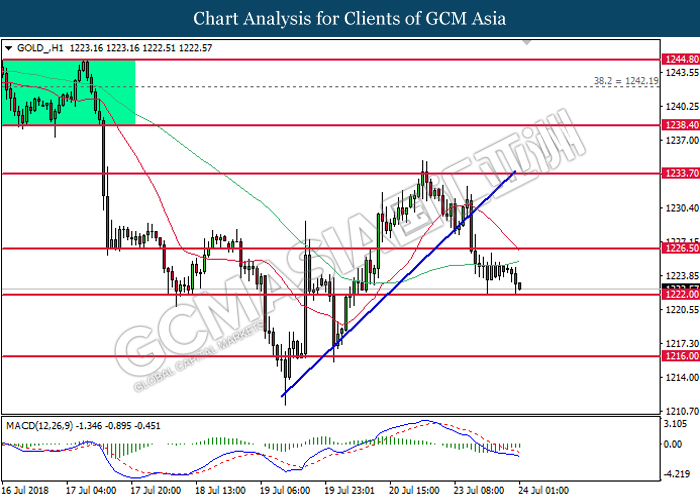
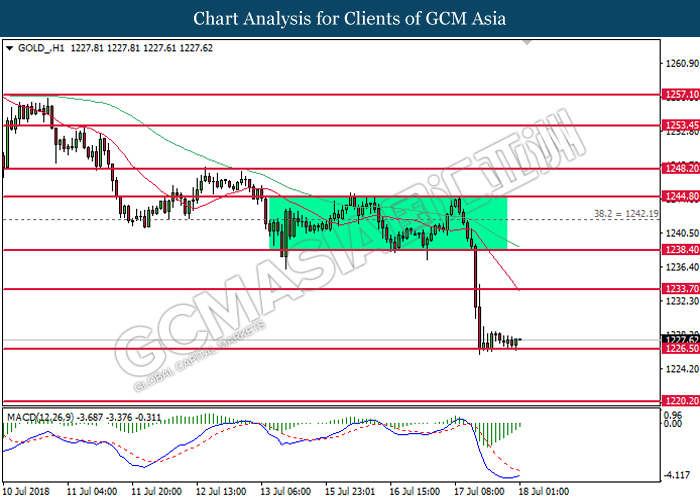
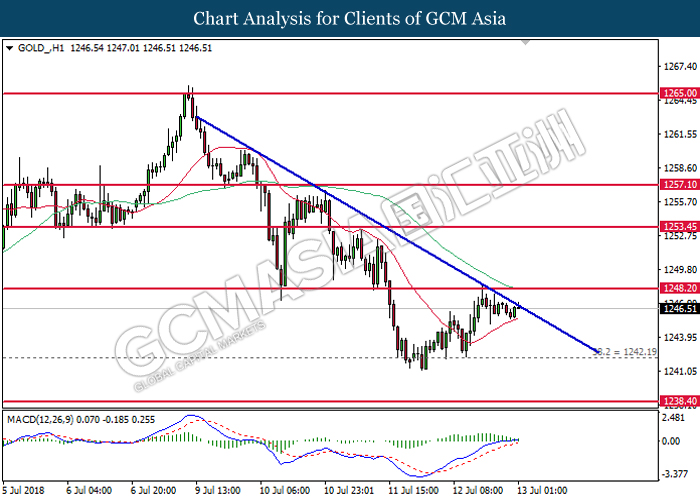
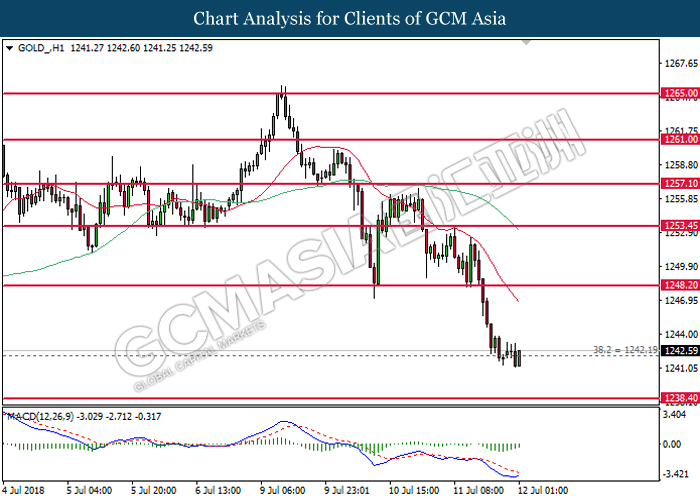
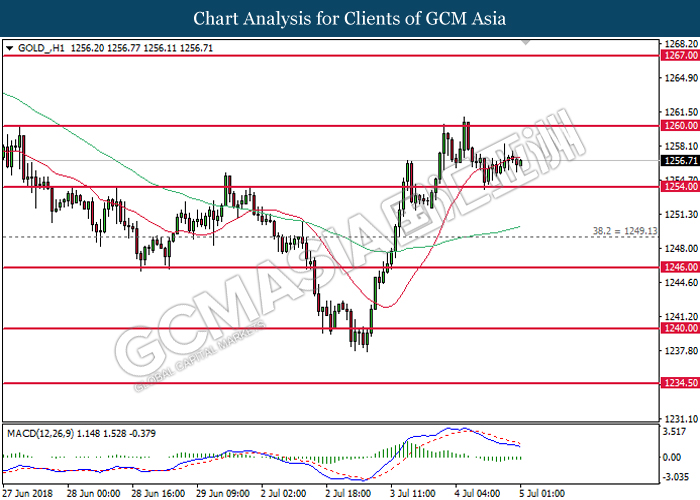
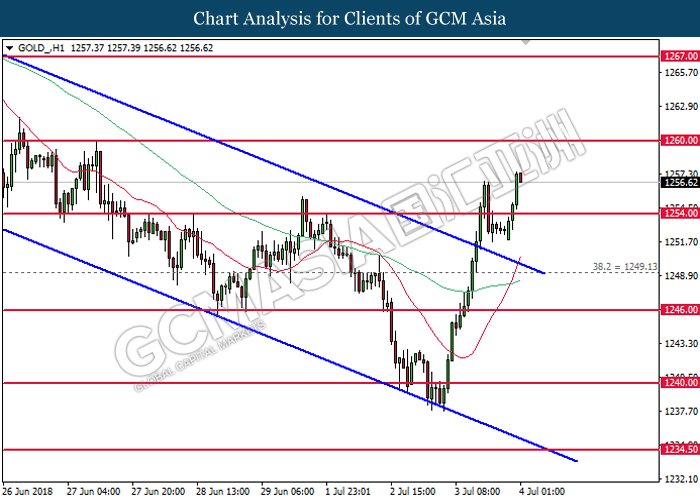
GOLD_, H1: Gold price was traded lower following prior retracement and breakout from the upward trendline. Although both MA and MACD portrays bearish signal, a close below the support level at 1222.00 is required to attain further confirmation.
Resistance level: 1226.50, 1233.70
Support level: 1222.00, 1216.00
230718 Weekly Analysis
23 July 2018 Weekly Analysis
GCMAsia Weekly Report: July 23 – 27
Market Review (Forex): July 16 – 20
US Dollar
Greenback tumbles further last Friday following US President Donald Trump accusation on China and European Union over the manipulation of currencies and interest rates. Dollar index fell 0.71% against a basket of six major peers while closing the week at 94.48.
Subsequent to the latest tit-for-tat in trade war between US and other major economies, President Trump came under the spotlight again after accusing China and European Union of manipulation their interest rates and currency exchange rate. Following his comment, Chinese yuan plunged to its lowest level in a year while bullish bets on the greenback was reduced due to higher risk aversion in the market.
According to news outlet Reuters, Treasury Secretary Steven Mnunchin said last Friday that the US is closely monitoring whether China has manipulated their foreign exchange rate. The Treasury’s next semi-annual FX policy report will detail further measures taken by the government that may impose designation upon China as one of the currency manipulators.
The latest “currency war” saga has sparked market unrest as investors has yet to recover from the major “trade war” between the States and Beijing. According to analysts, the greenback may likely to continue its bearish momentum for the time being as investors digest Trump’s latest accusation, backing out of long dollar position for the time being.
USD/JPY
Pair of USD/JPY plunged 0.88%, ended the week around 111.47 following higher demand for safe-haven assets.
EUR/USD
Euro gained 0.67% to $1.1721 against the US dollar. Large selloff on the greenback was evoked following Trump’s accusation of currency manipulation in the FX market.
GBP/USD
Pound sterling rose 0.89%, closing the week above the threshold of 1.3000 at around $1.3130 against the greenback.
Market Review (Commodities): July 16 – 20
GOLD
Gold price extended its recovery from its prior session low as market demand for safe-haven asset arises following US President Donald Trump accusation of currency manipulation in the FX market. Price of the yellow metal rose 0.73% or $8.93 to $1,231.77 a troy ounce.
Risk aversion among market participants was catalyzed after Trump accuses EU and China of manipulating their FX rates by adjusting their interest rates. In addition, gold price receives further bullish support after Trump took to Twitter to express his concern about a stronger US dollar which he said, “may take away our big competitive edge”.
Crude Oil
Crude oil price settled higher on Friday, supported by a weaker dollar and signs of US output tightening in the United States. Price of the black commodity rose 0.07%, closing the week at around $69.47 per barrel.
According to oilfield services firm Baker Hughes, the number of active oil drilling rigs in the US fell by 5 to ta total of 858. The report has recorded its first weekly decline in nearly a month, pointing towards signs of supply tightening from the US.
In addition, the report was released at a time when investors continue to weigh the prospect of global oil shortage following Saudi Arabia’s pledge to restrict their daily crude output. According to OPEC Governor Adeeb Al-Aama, he expects crude exports from Saudi Arabia to fell by 100,000 barrels per day in August as it limits excess production.
Similarly, crude oil prices were also supported by a weaker dollar following US President Donald Trump’s accusation upon EU and China over FX manipulation and recent dissatisfaction over the Federal Reserve’s rate hike plans.
Weekly Outlook: July 23 – 27
For the week ahead, investors will place their attention European Central Bank monetary policy meeting as it may provide further signals with regards to future monetary policy stance.
As for oil traders, they will be eyeing on US inventories level reported by API and EIA to gauge the strength of crude demand for world’s largest oil consumer.
Highlighted economy data and events for the week: July 23 – 27
| Monday, July 23 |
Data CAD – Wholesale Sales (MoM) (May) USD – Existing Home Sales (Jun)
Events N/A
|
| Tuesday, July 24 |
Data EUR – German Manufacturing PMI (Jul) EUR – Manufacturing PMI (Jul) EUR – Markit Composite PMI (Jul) EUR – Services PMI (Jul) USD – Manufacturing PMI (Jul) USD – Services PMI (Jul)
Events N/A
|
| Wednesday, July 25 |
Data CrudeOIL – API Weekly Crude Oil Stock NZD – Employment Change (QoQ) (Q2) AUD – CPI (QoQ) (Q2) EUR – German Ifo Business Climate Index GBP – Gross Mortgage Approvals USD – New Home Sales (Jun) CrudeOIL – Crude Oil Inventories
Events N/A
|
| Thursday, July 26 |
Data EUR – GfK German Consumer Climate (Aug) EUR – Deposit Facility Rate EUR – ECB Marginal Lending Facility EUR – ECB Interest Rate Decision (Jul) USD – Core Durable Goods Orders (MoM) (Jun) USD – Initial Jobless claims USD – Goods Trade Balance (Jun)
Events EUR – ECB Press Conference
|
|
Friday, July 27
|
Data JPY – Tokyo Core CPI (YoY) (Jul) USD – GDP (QoQ) (Q2) USD – GDP Price Index (QoQ) (Q2) USD – Michigan Consumer Sentiment (Jul) CrudeOIL – US Baker Hughes Oil Rig Count
Events N/A
|
Technical Weekly Outlook: July 23 – 27
Dollar Index
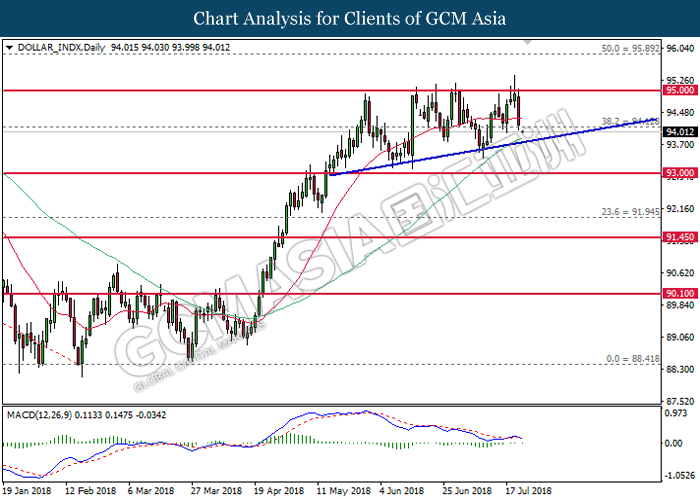
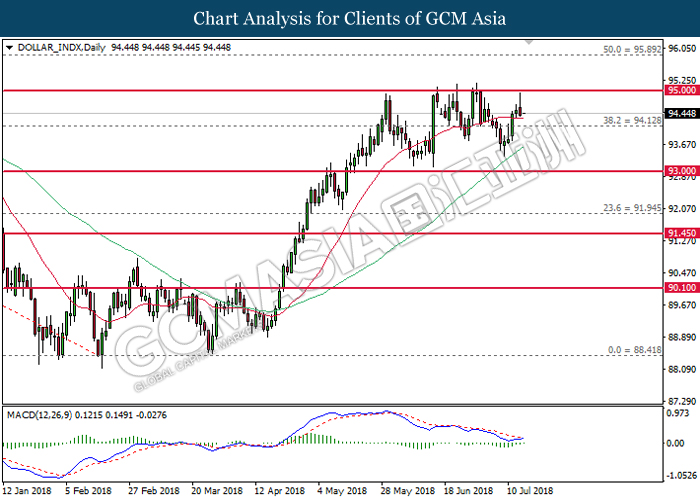
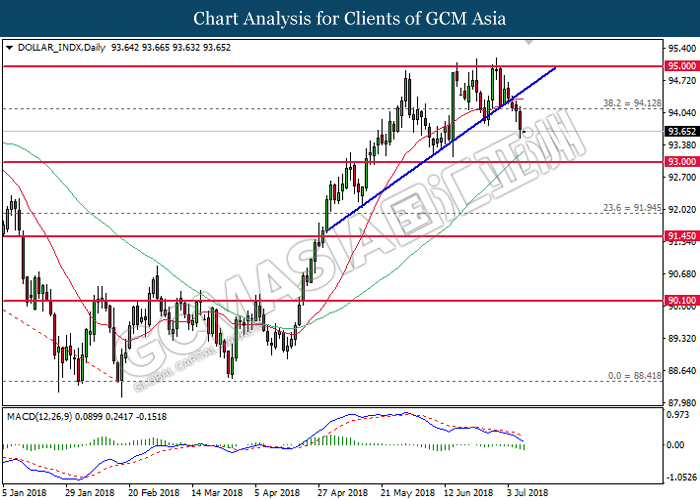
DOLLAR_INDX, Daily: Dollar index was traded lower following prior retrace from the strong resistance at 95.00. MACD histogram which illustrate bearish signal suggests the index to advance further down in short-term, towards the bottom level of ascending triangle.
Resistance level: 94.10, 95.00
Support level: 93.00, 91.95
GBPUSD
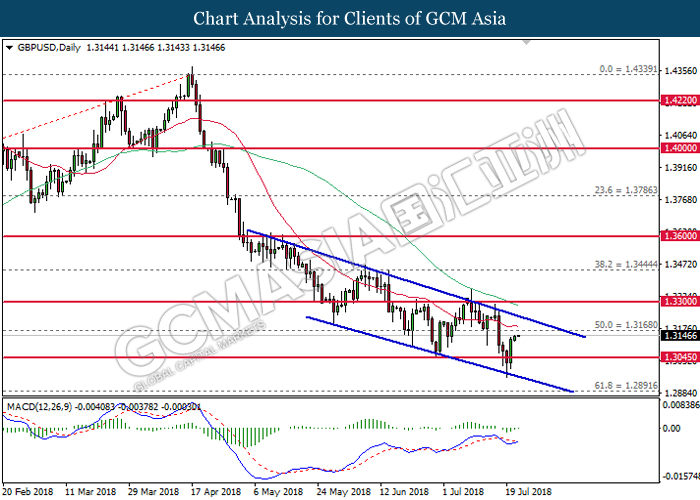
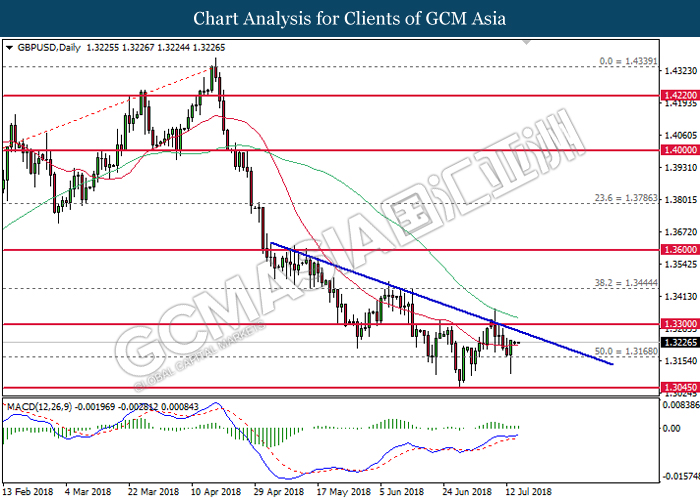
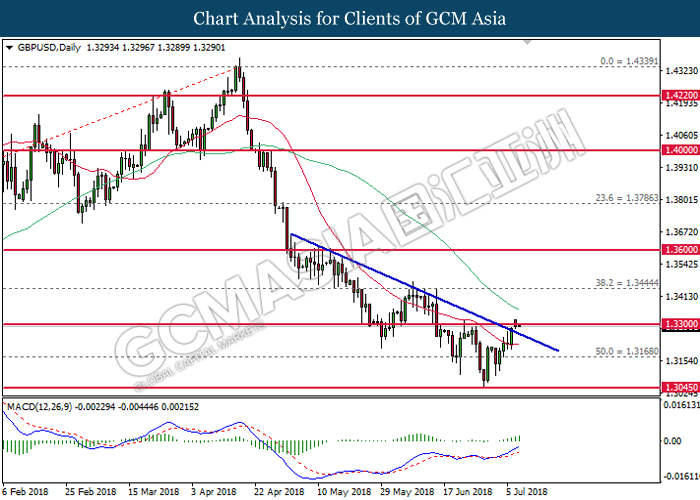
GBPUSD, Daily: GBPUSD remains traded within a descending channel following prior rebound from the bottom level. MACD histogram which illustrate diminishing downward momentum suggests the pair to extend its gains in short-term, towards the upper level of the channel.
Resistance level: 1.3170, 1.3300
Support level: 1.3040, 1.2890
USDJPY
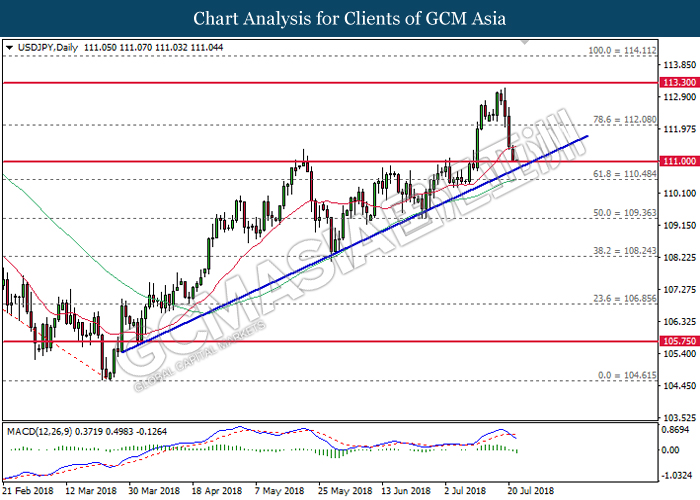
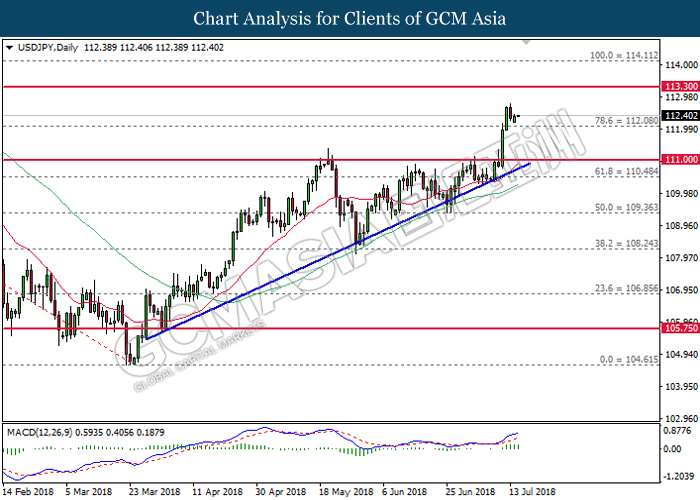
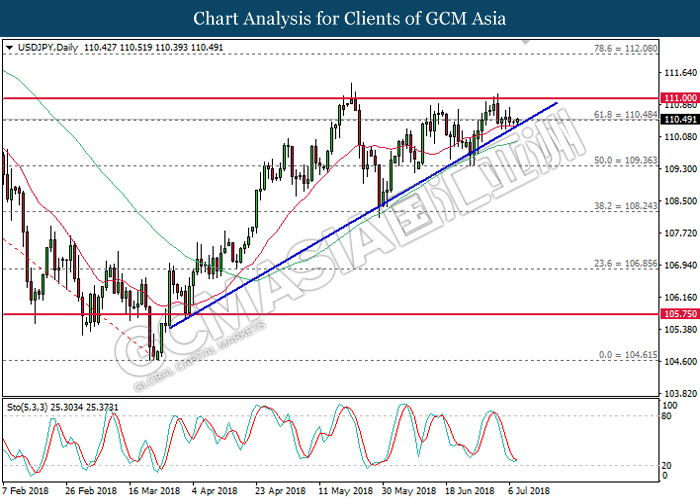
USDJPY, Daily: USDJPY plunged sharply following prior failure to break the resistance level at 113.30. MACD histogram which has formed a bearish signal suggests the pair to extend its losses after successfully breaking the ascending trendline and support near 111.00.
Resistance level: 112.10, 113.30
Support level: 111.00, 110.50
EURUSD
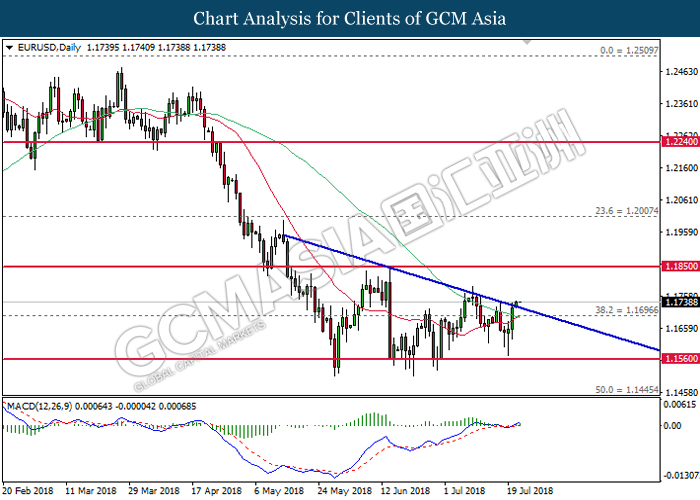
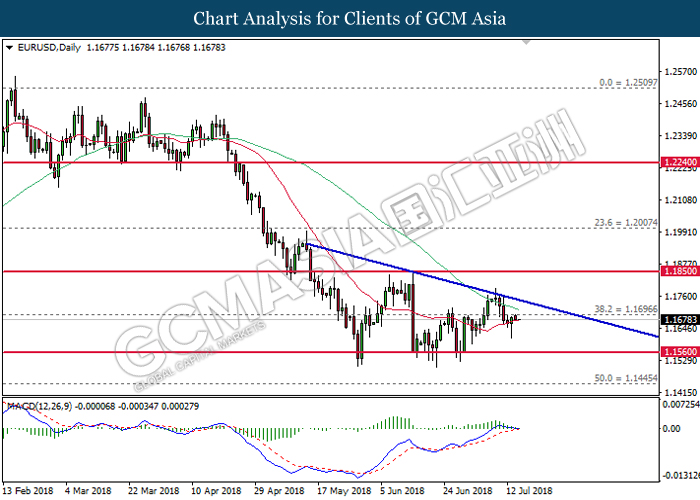
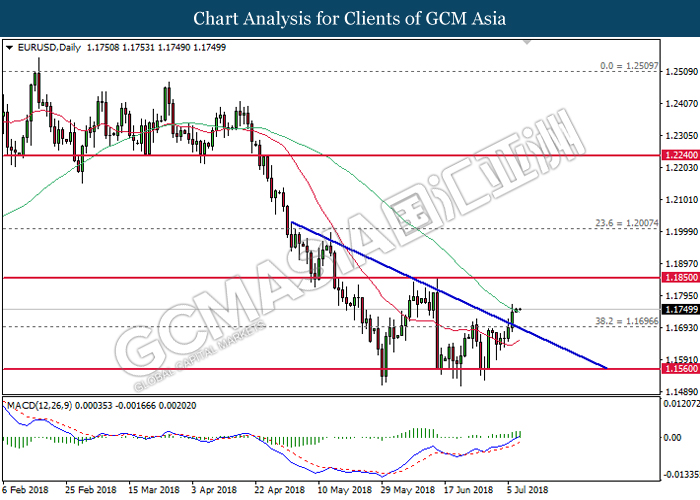
EURUSD, Daily: EURUSD was traded higher following prior breakout from the top level of descending triangle. Recent price action while coupled with MACD which illustrate bullish signal suggests the pair to extend its gains, towards the direction of next target near 1.1850.
Resistance level: 1.1850, 1.2000
Support level: 1.1700, 1.1560
GOLD
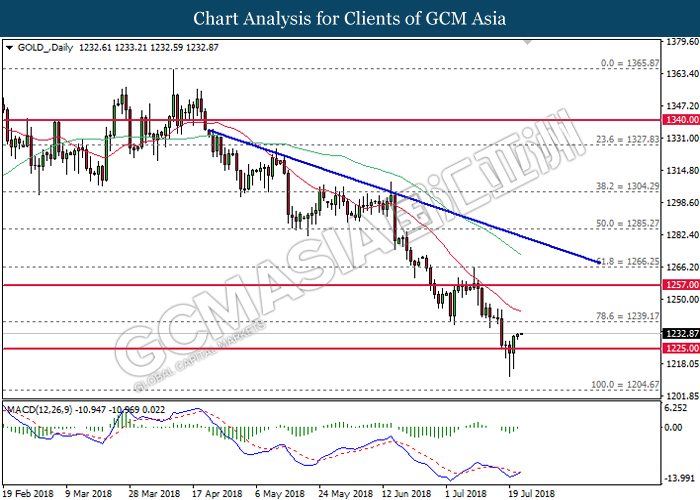
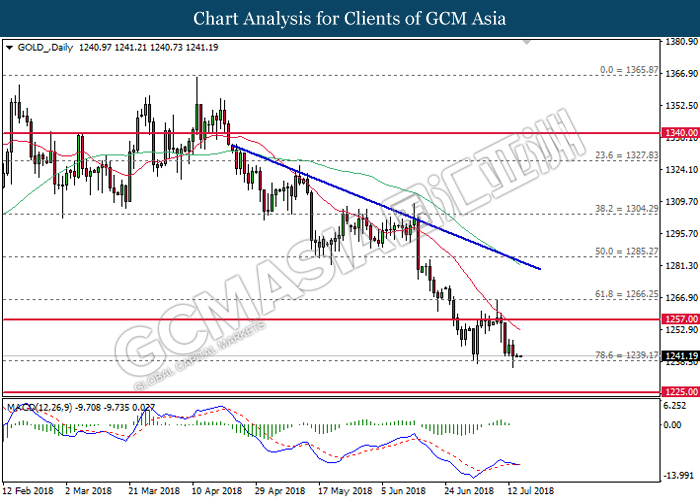
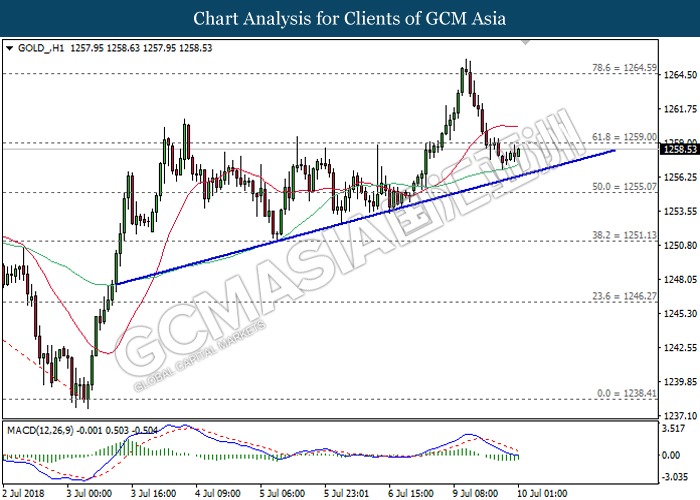
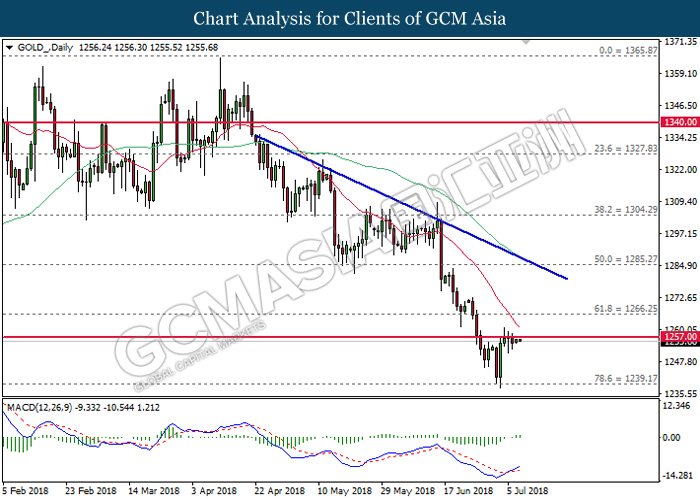
GOLD_, Daily: Gold price extended gains following prior rebound near the support level at 1225.00. MACD histogram which illustrate positive divergence signal suggests the commodity price to advance further up in short-term, towards the next target near 1239.20.
Resistance level: 1239.20, 1257.00
Support level: 1225.00, 1204.70
Crude Oil
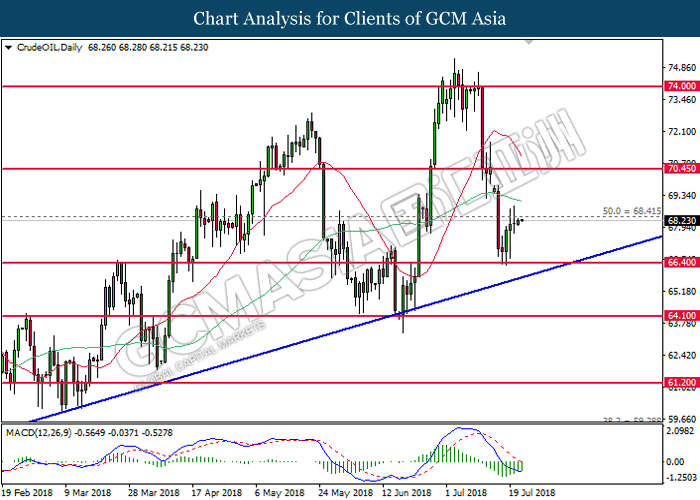
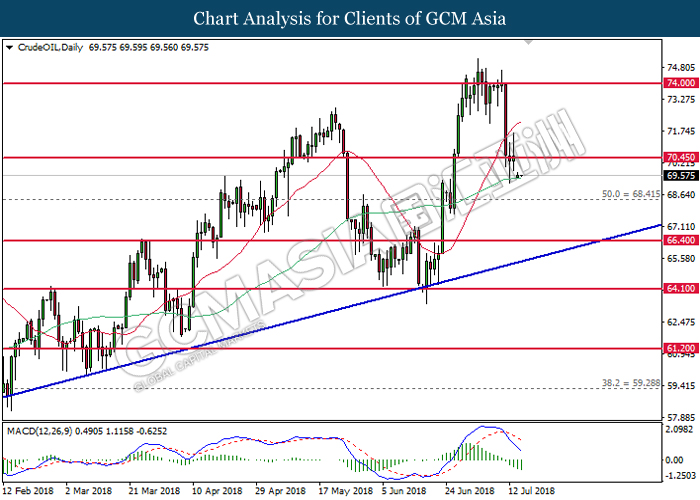
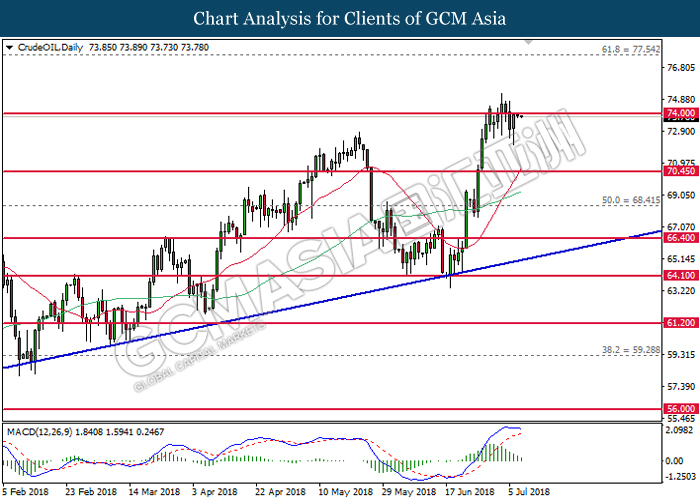
CrudeOIL, Daily: Crude oil price pared its losses following prior rebound from the support level near 66.40. MACD histogram which illustrate diminishing downward momentum suggests the commodity price to extend its gains after breaking the resistance of 68.40.
Resistance level: 68.40, 70.45
Support level: 66.40, 64.10
200718 Daily Analysis
20 July 2018 Daily Analysis
Dollar deviates amid Trump’s criticism.
US dollar pared its gains during North American trading hours after US President Donald Trump commented that he is not “happy” about Federal Reserve tightening their monetary policy. The dollar index tumbled down 0.43% to 94.92 against a basket of six major peers. During an interview with the CNBC on Thursday, Trump expressed that the is not happy about interest rate increases, claiming that “higher rates may put us (United States) at a disadvantage”. However, Trump added that he would let the “Fed to do what they feel best”. Pessimistic comments from Trump scaled back investors expectation for a faster pace of rate hike following hawkish call from Fed Chair Jerome Powell that the best option for the central bank is to gradually raising interest rates. Overall, downside on the dollar remains limited following optimistic economic report from yesterday. According to US Department of Labor, Initial Jobless Claims fell 8,000 to a total of 207,000 for last week, confounding economist forecast for a reading of 220,000. Likewise, Philadelphia Fed reported that its manufacturing index rose to 25.7 for the month of July, exceeding forecast of an increase to 21.6.
As for commodities, crude oil price pared some losses by 0.07% to $69.47 per barrel following report which shows that Saudi Arabia exports may fall short in August, renewing expectations for a global shortage in crude supplies. On the other hand, gold price ticked up 0.01% to $1,222.97 a troy ounce while investors continue to monitor US major economic release to gauge future rate hike stance.
Today’s Holiday Market Close
Time Market Event
N/A
Today’s Highlight Events
Time Market Event
Tentative CrudeOIL OPEC Meeting
Today’s Highlight Economy Data
| Time | Nation & Data | Previous | Forecast | Actual |
| 07:30 | JPY – National Core CPI (YoY) (Jun) | 0.7% | 0.8% | – |
| 14:00 | EUR – German PPI (MoM) (Jun) | 0.5% | 0.3% | – |
| 20:30 | CAD – Core CPI (MoM) (Jun) | -0.1% | – | – |
| 20:30 | CAD – Core Retail Sales (MoM) (May) | -0.1% | 0.7% | – |
| 01:00 | CrudeOIL – US Baker Hughes Oil Rig Count | 863 | – | – |
GBPUSD
GBPUSD, H1: GBPUSD remains traded within a descending channel while currently testing at the top level. Although MACD and Stochastic Oscillator illustrate bullish signal, a break above is required to attain further verification.
Resistance level: 1.3070, 1.3130
Support level: 1.3000, 1.2900
EURUSD
EURUSD, H4: EURUSD remains traded within a descending wedge following prior rebound from the bottom level. MACD histogram which illustrate bullish signal suggests the pair to extend its gains after closing above the 20-MA line (red).
Resistance level: 1.1680, 1.1720
Support level: 1.1645, 1.1590
USDJPY
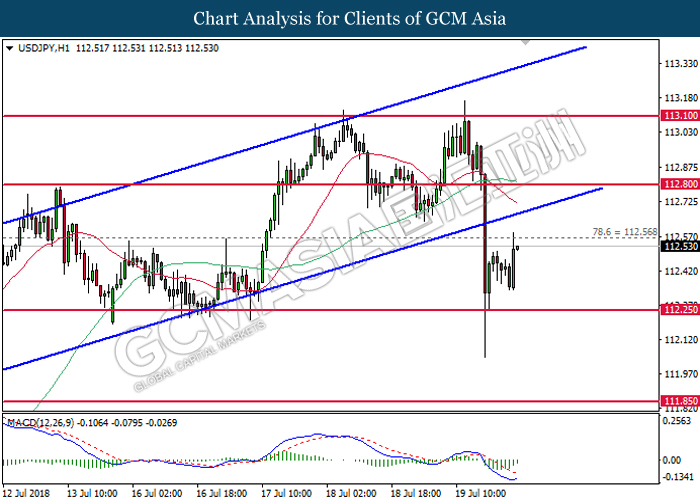
USDJPY, H1: USDJPY was traded lower following prior breakout from the bottom level of ascending channel. However, MACD which illustrate diminishing downward momentum suggests the pair to be traded higher in short-term as technical correction.
Resistance level: 112.55, 112.80
Support level: 112.25, 111.85
CrudeOIL
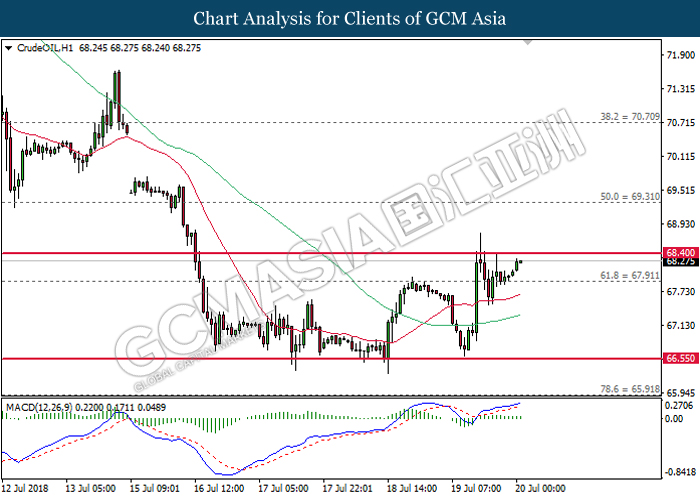
CrudeOIL, H1: Crude oil price extended gains following prior rebound from the strong support at 66.55. MACD which illustrate persistent upward signal suggests the commodity price to advance further up after breaking the resistance near 68.40.
Resistance level: 68.40, 69.30
Support level: 67.90, 66.55
GOLD
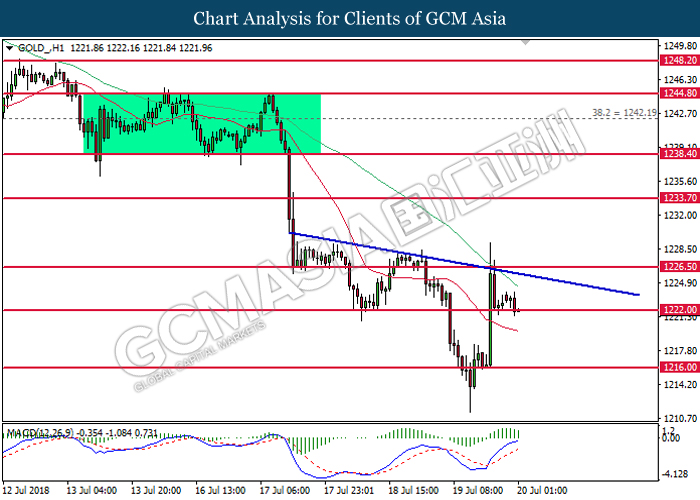
GOLD_, H1: Gold price was traded lower following prior retrace from the downward trendline. MACD which illustrate diminishing upward momentum suggests the commodity price to extend its losses after closing below 1222.00.
Resistance level: 1226.50, 1233.70
Support level: 1222.00, 1216.00
190718 Daily Analysis
19 July 2018 Daily Analysis
Dollar flickers as sterling plummet.
Greenback remained broadly higher against a basket of six major peers following a large selloff in pound sterling which has offsets somber US housing market data. Overnight, pound sterling extended its losses following subdued UK inflation data which has dial down expectations for an interest rate hike from the Bank of England (BoE). According to Office for National Statistics, UK Consumer Price Index (CPI) came in at only 2.4% versus forecast of 2.6% for the month of June. Prior, market participants speculate that BoE may hike their interest rate in August due to growing concern within the bank towards rising inflationary pressure. A slump in sterling has helped to cushion greenback’s losses after dollar-bulls reacts towards US Building Permits which tumbled more than economist forecast with -12.3% versus -2.2% for the month of June. However, financial market did not react on Fed Chair Jerome Powell second day of testimonial as he failed to deliver new insights with regards to future monetary policy. The dollar index was quoted up 0.15% to 94.80 while pairing of GBP/USD slumped 0.54% to 10-months low of $1.3001.
As for commodities, crude oil price settled down 0.12% to $68.92 per barrel after EIA reported a rise in US crude stockpiles by 5.836 million barrels last week, missing forecast for a draw of 3.622 million barrels. Otherwise, gold price was down 0.07% to $1,226.67 a troy ounce following resilient dollar-bulls.
Today’s Holiday Market Close
Time Market Event
N/A
Today’s Highlight Events
Time Market Event
N/A
Today’s Highlight Economy Data
| Time | Nation & Data | Previous | Forecast | Actual |
| 09:30 | AUD – Employment Change (Jun) | 12.0K | 16.7K | – |
| 16:30 | GBP – Retail Sales (MoM) (Jun) | 1.3% | 0.1% | – |
| 20:30 | USD – Initial Jobless Claims | 214K | 220K | – |
| 20:30 | USD – Philadelphia Fed Manufacturing Index (Jul) | 19.9 | 21.6 | – |
| 20:30 | USD – Philly Fed Employment (Jul) | 30.4 | – | – |
GBPUSD
GBPUSD, H4: GBPUSD extended its recovery after slumping to a 10-months low near 1.3000. MACD histogram which illustrate upward signal suggests the pair to be traded higher in short-term as technical correction. Long-term trend direction still skewed towards bearish.
Resistance level: 1.3130, 1.3180
Support level: 1.3070, 1.3000
EURUSD
EURUSD, H1: EURUSD was traded higher following prior rebound from the 20-MA line (red). MACD histogram which illustrate bullish signal suggest the pair to extend its recovery and move towards the direction of resistance level near 1.1665.
Resistance level: 1.1665, 1.1680
Support level: 1.1620, 1.1590
USDJPY
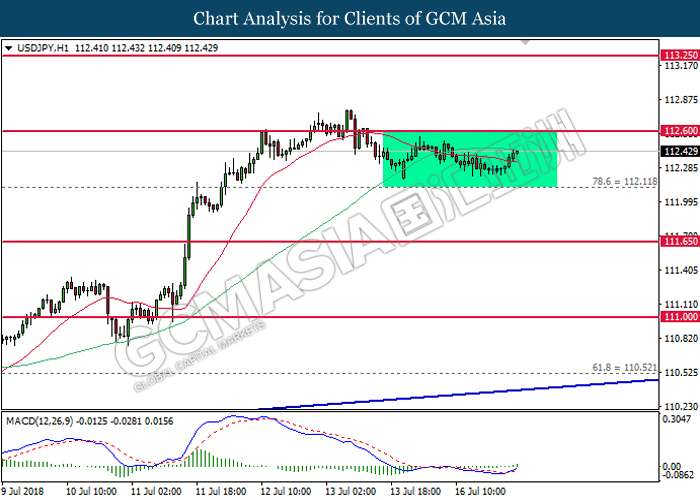
USDJPY, H1: USDJPY was traded lower following prior retracement and closure below the 20-MA line (red). MACD histogram which illustrate bearish signal suggests the pair to extend its short-term bearish bias, towards the upward trendline near 112.60.
Resistance level: 113.25, 114.15
Support level: 112.60, 112.10
CrudeOIL
CrudeOIL, H1: Crude oil price was traded higher following prior rebound from the support level near 66.55. MACD histogram which illustrate persistent upward momentum suggests further bullish bias. However, a close above 67.90 is required to attain further confirmation.
Resistance level: 67.90, 69.30
Support level: 66.55, 65.90
GOLD
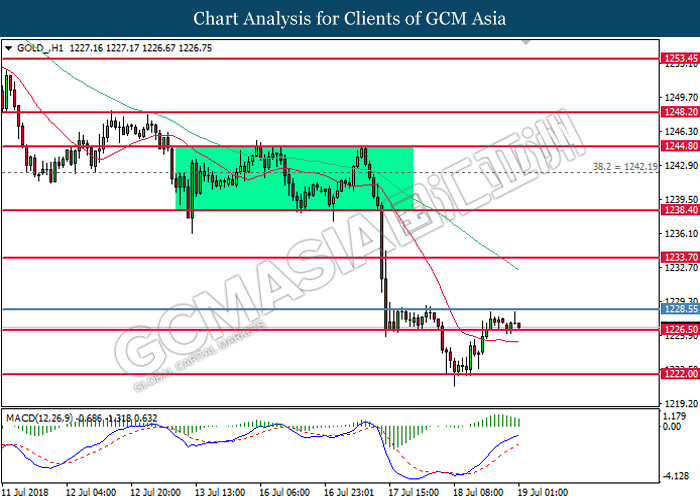
GOLD_, H1: Gold price was traded lower following prior retrace from the threshold of 1228.55. MACD histogram which illustrate diminishing upward momentum suggests the commodity price to advance further down after closing below 1226.50.
Resistance level: 1228.55, 1233.70
Support level: 1226.50, 1222.00
180718 Daily Analysis
18 July 2018 Daily Analysis
Powell unwinds dollar-bears with hawkish rhetoric.
Dollar-bulls invigorates during North American trading session on yesterday after Federal Reserve Chair Jerome Powell gave lawmakers a rather optimistic assessment with regards to US economy and expecting to follow through their plans to raise interest rates gradually. The dollar index was quoted up 0.50%, last seen around 94.68 during early Asian trading hours. During his semi-annual testimony to the Congress, Powell postulate that the “best way forward” is to continue raising interest rates as job market continues to strengthen while inflation moved above Fed’s target of 2%. Likewise, Powell also echoed Fed’s recent comment in meeting minutes, hinting two more interest hike for second half of the year. For now, investors will place their attention upon Powell’s testimony before the House Financial Services Committee tonight which may offer further clues with regards to future monetary policy. In the other region, pair of GBP/USD slipped 0.03% to $1.3106 as Prime Minister Theresa May’s Brexit bill may face another challenge in the Parliament.
In the commodities market, crude oil price tacks up 0.18% to $67.75 per barrel following higher speculation among investors that tonight’s US crude oil inventories report may show yet another weekly draw. On the other hand, gold price stumbled down 0.95% to $1,227.37 a troy ounce following hawkish rhetoric from Fed Chair Jerome Powell.
Today’s Holiday Market Close
Time Market Event
N/A
Today’s Highlight Events
Time Market Event
22:00 USD Fed Chair Powell Testifies
Today’s Highlight Economy Data
| Time | Nation & Data | Previous | Forecast | Actual |
| 16:30 | GBP – CPI (YoY) (Jun) | 2.4% | 2.6% | – |
| 17:00 | EUR – CPI (YoY) (Jun) | 2.0% | 2.0% | – |
| 20:30 | USD – Building Permits (Jun) | 1.301M | 1.330M | – |
| 22:30 | CrudeOIL – Crude Oil Inventories | -12.633M | -3.622M | – |
| 22:30 | CrudeOIL – Gasoline Inventories | -0.694M | -0.044M | – |
GBPUSD
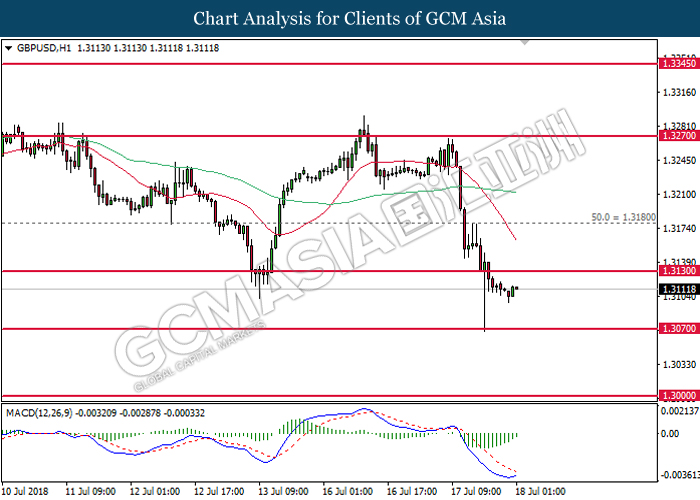
GBPUSD, H1: GBPUSD extended its losses following prior breakout from the support level of 1.3130. However, MACD histogram which illustrate diminishing downward momentum suggests the pair to be traded higher in short-term as technical correction before continuing its bearish trend.
Resistance level: 1.3130, 1.3180
Support level: 1.3070, 1.3000
EURUSD
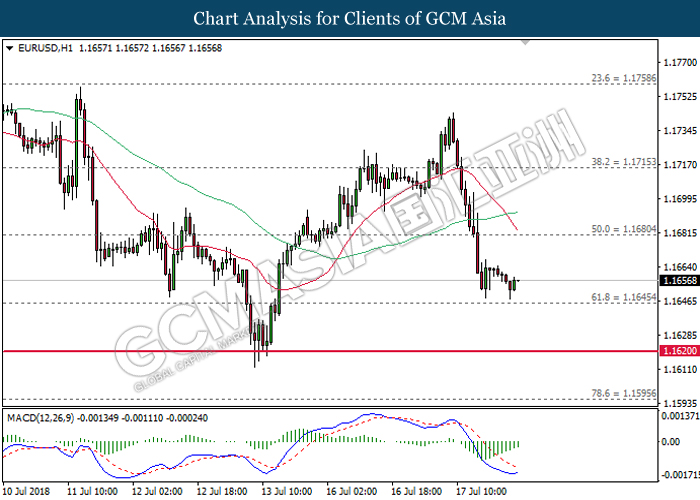
EURUSD, H1: EURUSD was traded lower following prior breakout from the support level of 1.1680. However, MACD histogram which illustrate diminishing downward momentum may suggest the pair to be traded higher in short-term as technical correction.
Resistance level: 1.1680, 1.1715
Support level: 1.1645, 1.1620
USDJPY
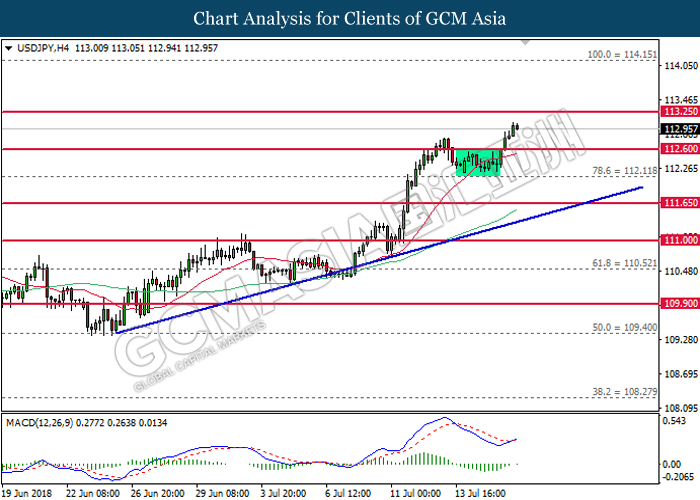
USDJPY, H1: USDJPY extended its gains following prior breakout from the strong resistance near 112.60. MACD histogram which begins to form a bullish crossover suggests the pair to extend its gains, towards the direction of resistance level at 113.25.
Resistance level: 113.25, 114.15
Support level: 112.60, 112.10
CrudeOIL
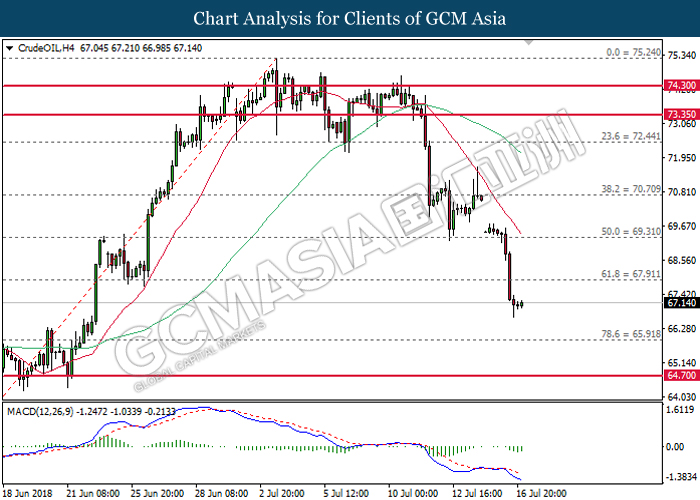
CrudeOIL, H4: Crude oil price was traded in a consolidation phase following prior breakout from the support level of 67.90. As MACD histogram has begins to form a bullish crossover, the commodity price may be traded higher in short-term as technical correction before extending its major bearish trending.
Resistance level: 67.90, 69.30
Support level: 65.90, 64.70
GOLD
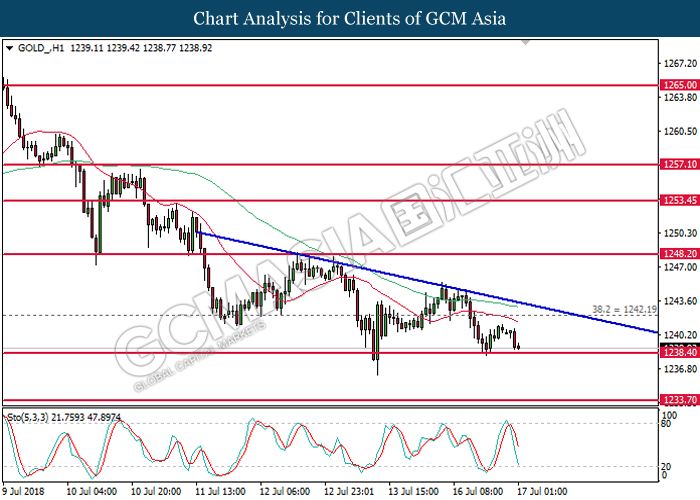
GOLD_, H1: Gold price was traded lower following prior breakout from the bottom level of sideways channel. However, MACD histogram which illustrate diminishing downward momentum suggests the commodity price to be traded higher in short-term as technical correction before extending its bearish trending.
Resistance level: 1233.70, 1238.40
Support level: 1226.50, 1220.20
170718 Daily Analysis
17 July 2018 Daily Analysis
Low-spirited dollar awaits Powell’s speech.
Greenback extended its losses on yesterday while US economic data that are in line with economist forecast did little to cap its bearish momentum. The dollar index was down 0.25% to 94.20 during early Asian trading session. According to US Commerce Department, Core Retail Sales for the month of June came in within economist expectation with 0.4% while the reading for the month of May was revised higher to 1.3%. On the other hand, although Empire State Manufacturing Index fell by 2.4 points, its reading was well above economist forecast of 22.00 with 22.60 for the month of July. However, dollar bulls remained subdued since the start of the week as they await further clues on US monetary policy when Federal Reserve Chair Jerome Powell testifies before the US Senate Banking Committee later tonight. Otherwise, pair of GBP/USD tacks up 0.01% to $1.3235 ahead of a series of data bound to be released within this week. Investors will place their attention on major economic release from Britain to gauge the prospect of an August interest rate hike from the Bank of England.
As for commodities market, crude oil price settled down more than 4% to $66.95 per barrel after Iraq crude exports reportedly rose 6% to 4.05 million barrels per day in the first half of July. Otherwise, gold price threaded lower by 0.03% to $1,240.61 a troy ounce while investors place their attention over the imminent speech by Fed Chair Jerome Powell scheduled later tonight.
Today’s Holiday Market Close
Time Market Event
N/A
Today’s Highlight Events
Time Market Event
09:30 AUD RBA Meeting Minutes
16:00 GBP BoE Gov Carney Speaks
22:00 USD Fed Chair Powell Testifies
Today’s Highlight Economic Data
| Time | Nation & Data | Previous | Forecast | Actual |
| 06:45 | NZD – GDP (QoQ) (Q2) | 0.5% | 0.5% | 0.4% |
| 16:30 | GBP – Average Earnings Index +Bonus (May) | 2.5% | 2.5% | – |
| 16:30 | GBP – Claimant Count Change (Jun) | -7.7K | 2.3K | – |
| 20:30 | CAD – Manufacturing Sales (MoM) (May) | -1.3% | 0.5% | – |
| 21:15 | USD – Industrial Production (MoM) (Jun) | -0.1% | 0.5% | – |
| 04:30 | CrudeOIL – API Weekly Crude Oil Stock | -6.796M | – | – |
GBPUSD
GBPUSD, H1: GBPUSD was traded lower following prior retracement from the resistance level at 1.3280. However, MACD histogram which illustrate bearish signal suggests the pair to extend its losses after closing below the 60-MA line (green).
Resistance level: 1.3235, 1.3280
Support level: 1.3200, 1.3165
EURUSD
EURUSD, H1: EURUSD was traded lower following prior retracement from the resistance level at 1.1725. MACD histogram which begins to form a bearish signal suggests the pair to extend its losses after closing below the 20-MA line (red).
Resistance level: 1.1725, 1.1760
Support level: 1.1690, 1.1660
USDJPY
USDJPY, H1: USDJPY was traded higher following prior rebound from the bottom level of the range near 112.10. MACD histogram which illustrate bullish signal suggests the pair to be traded higher in short-term. Otherwise, long-term trend direction can only be determined following a successful breakout from either side of the range.
Resistance level: 112.60, 113.25
Support level: 112.10, 111.65
CrudeOIL
CrudeOIL, H4: Crude oil price extended its losses following prior breakout from the support level near 67.90. However, MACD histogram which illustrate diminishing downward momentum suggests the commodity price to be traded higher in short-term as technical correction before extending its losses.
Resistance level: 67.90, 69.30
Support level: 65.90, 64.70
GOLD
GOLD_, H1: Gold price remains traded within a descending triangle while recently retraced from the mid-level. Stochastic Oscillator which illustrate a retracement signal from the overbought regions suggests gold price to be traded lower. However, a break below 1238.40 is required to validate such bias.
Resistance level: 1242.20, 1248.20
Support level: 1238.40, 1233.70
160718 Weekly Analysis
16 July 2018 Weekly Analysis
GCMAsia Weekly Report: July 16 – 20
Market Review (Forex): July 9 – 13
US Dollar
Greenback retreats from its prior two-weeks high against other major peers last Friday following a sharp rebound of pound sterling. Dollar index recorded a loss of 0.14% while ended the week around 94.68 during late American trading hours.
Overall, dollar-bulls remained subdued throughout the week following Thursday’s release of Consumer Price Index (CPI). According to reports, consumer prices for last month grew slower than expected with only 0.1%, missing economist forecast of 0.2%. The data has raised some concerns that the Federal Reserve may not follow through their aggressive pace of monetary tightening if inflationary pressure remains muted.
However, the current downside on the greenback remains limited as majority of market participants remains optimistic towards US economy in the event of a full-blown trade war between Washington and Beijing. According to reports, more than 70% of US economy relies on services sector, giving them the advantage to sustain recessive risk as compared to its export-reliant peers such as EU or China.
USD/JPY
Pair of USD/JPY was down 0.12% to 112.38 during late Friday trading.
EUR/USD
Euro extended gains by 0.13% to $1.1686 against the US dollar.
GBP/USD
Sterling recovered its losses by 0.23% to $1.3236 against the greenback. The currency rebounds from its 11-day low after US President Donald Trump back tracks his criticism against British Prime Minister Theresa May by claiming that US-UK trade deal is still possible.
Market Review (Commodities): July 9 – 13
GOLD
Gold price threads lower last Friday while a weaker dollar failed to lift overall sentiment towards safe-haven assets. Price of the yellow metal was quoted down 0.44% to $1,241.61 a troy ounce, its lowest level in seven months.
The yellow metal resumed its bearish momentum following hawkish speculation towards the Federal Reserve within the market. Ongoing trade war in between the US and China which slaps tariff at one another may increase domestic consumer prices more rapidly, prompting Federal Reserve to adopt aggressive monetary tightening in the long-run.
Crude Oil
Crude oil price settled higher on Friday although gains remains limited due to rising supply in the global market. Price of the black commodity recovered its losses by 0.24% to $70.59 per barrel.
Earlier this week, crude oil price fell nearly 4% following mixed signals in the market. In the pessimistic front, Libya announced that it would reopen four of its oil export terminals, with an estimation of 0.7 million barrels per day of oil to return into the market supply.
On the other hand, International Energy Agency reported that major oil producers may experience potential capacity crunch and they may fail to curtail an imminent supply shortage that arise from Venezuela and Iran.
All in all, sentiment towards the commodity skewed towards bullish last Friday following the release of weekly report from Baker Hughes. According to the oilfield services provider, US oil rig count remained unchanged at 863, signaling a halt in oil expansion activities.
Weekly Outlook: July 16 – 20
For the week ahead, investors will place their attention on major economic data release from the US, EU and UK in order to gauge respective country’s economic condition and progression.
As for oil traders, they will be eyeing on US inventories level reported by API and EIA to gauge the strength of crude demand for world’s largest oil consumer.
Highlighted economy data and events for the week: July 16 – 20
| Monday, July 16 |
Data CNY – GDP (QoQ) (Q2) USD – Core Retail Sales (MoM) (Jun) USD – Retail Sales (MoM) (Jun) USD – NY Empire State Manufacturing Index (Jul) CAD – Foreign Securities Purchases (May) USD – Business Inventories (MoM) (May)
Events N/A
|
| Tuesday, July 17 |
Data NZD – GDP (QoQ) (Q2) GBP – Average Earnings Index +Bonus (May) GBP – Claimant Count Change (Jun) CAD – Manufacturing Sales (MoM) (May) USD – Industrial Production (MoM) (Jun)
Events AUD – RBA Meeting Minutes USD – Fed Chair Powell Speaks
|
| Wednesday, July 18 |
Data CrudeOIL – API Weekly Crude Oil Stock GBP – CPI (YoY) (Jun) EUR – CPI (YoY) (Jun) USD – Building Permits (Jun) CrudeOIL – Crude Oil Inventories CrudeOIL – Gasoline Inventories
Events USD – Fed Chair Powell Speaks
|
| Thursday, July 19 |
Data AUD – Employment Change (Jun) GBP – Retail Sales (MoM) (Jun) USD – Philadelphia Fed Manufacturing Index (Jul) USD – Philly Fed Employment (Jul)
Events N/A
|
|
Friday, July 20
|
Data JPY – National Core CPI (YoY) (Jun) EUR – German PPI (MoM) (Jun) CAD – Core CPI (MoM) (Jun) CAD – Core Retail Sales (MoM) (May) CrudeOIL – US Baker Hughes Oil Rig Count
Events N/A
|
Technical Weekly Outlook: July 16 – 20
Dollar Index
DOLLAR_INDX, Daily: Dollar index was traded higher following prior rebound from and closure above the 20-MA line (red). MACD histogram which illustrate diminishing downward momentum suggests the index to extend its gains and retest near the strong resistance of 95.00.
Resistance level: 95.00, 95.90
Support level: 94.10, 93.00
GBPUSD
GBPUSD, Daily: GBPUSD was traded higher following prior rebound from the support level at 1.3170. MACD histogram which illustrate persistent bullish signal suggests the pair to extend its gains in short-term towards the bearish trendline.
Resistance level: 1.3300, 1.3445
Support level: 1.3170, 1.3045
USDJPY
USDJPY, Daily: USDJPY rose sharply following prior breakout from the strong resistance at 111.00. MACD histogram which illustrate ongoing bullish signal suggests the pair to extend its gains, towards the direction of resistance level at 113.30.
Resistance level: 113.30, 114.10
Support level: 112.10, 111.00
EURUSD
EURUSD, Daily: EURUSD remains traded within a descending triangle following prior retracement from the top level. MACD histogram which begins to form bearish crossover suggests the pair to advance further down in short-term after closing below the 20-MA line (red).
Resistance level: 1.1700, 1.1850
Support level: 1.1560, 1.1445
GOLD
GOLD_, Daily: Gold price extended its losses in tandem with overall trend which skew towards bearish. MACD histogram which begins to form a bearish crossover suggests the commodity price to advance further down after breaking the strong support at 1239.20.
Resistance level: 1257.00, 1266.25
Support level: 1239.20, 1225.00
Crude Oil
CrudeOIL, Daily: Crude oil price was traded lower following prior retracement from the resistance level of 74.00. MACD histogram which illustrate bearish signal suggests the commodity price to extend its losses. However, a close below 60-MA line (green) is required to validate such bias.
Resistance level: 70.45, 74.00
Support level: 68.40, 66.40
130718 Daily Analysis
13 July 2018 Daily Analysis
Dollar-bull sedated amid muted inflation.
Greenback extended gains on yesterday although recent US consumer prices rise slower than expected. The dollar index tacks up 0.11% while last quotes around 94.50 during early Asian trading session. According to the Labor Department, Consumer Price Index for the month of June rose only 0.1%, missing economists forecast for a rise of 0.2%. However, the data failed to dent market optimism towards greenback as ongoing tit-for-tat trade tariffs could increase the pace of domestic inflationary pressure. In addition, greenback received further bullish support after Initial Jobless Claims for last week decreased to 214,000 individuals, confounding economist forecast of 226,000. On the other hand, GBP/USD extended its losses by 0.23% to $1.3175 amid ongoing woes with regards to Brexit. Numerous lawmakers criticized the recently published Brexit White Paper, arguing that it will not be beneficial to the UK while stoking higher pessimism towards PM Theresa May’s negotiation strategy.
In the commodities market, crude oil price tumbled down 0.31% to $70.20 per barrel as traders weighs the impact of increase oil supply from Libya against major oil producers that may struggle to prevent global supply shortage. Otherwise, gold prices were down by 0.05% to $1,246.49 a troy ounce following recent appreciation of the US dollar.
Today’s Holiday Market Close
Time Market Event
N/A
Today’s Highlight Events
Time Market Event
00:30 USD FOMC Member Bostic Speaks
Today’s Highlight Economy Data
| Time | Nation & Data | Previous | Forecast | Actual |
| Tentative | CNY – Trade Balance (USD) (Jun) | 24.92B | 27.90B | – |
| 20:30 | USD – Import Price Index (MoM) (Jun) | 0.6% | 0.1% | – |
| 22:00 | USD – Michigan Consumer Sentiment (Jul) | 98.2 | 98.1 | – |
| 01:00 | CrudeOIL – US Baker Hughes Oil rig Count | 858 | – | – |
GBPUSD
GBPUSD, H1: GBPUSD extended its losses following prior retracement from the bearish trendline. MACD histogram which illustrate bearish signal suggests the pair to advance further down after breaking the support level of 1.3165.
Resistance level: 1.3200, 1.3235
Support level: 1.3165, 1.3120
EURUSD
EURUSD, H1: EURUSD remains traded within a tight range that are subjected to 1.1660 and 1.1690. Stochastic Oscillator which illustrate rebound signal from the oversold region suggests the pair to be traded higher in short-term. Long-term trend direction can only be determined following a successful breakout from either side of the range.
Resistance level: 1.1690, 1.1725
Support level: 1.1660, 1.1630
USDJPY
USDJPY, H4: USDJPY advanced further up following prior breakout at the resistance level of 112.60. Both MA line which continues to expand upwards suggests the pair to extend its gains, towards the direction of resistance level at 113.25.
Resistance level: 113.25, 114.15
Support level: 112.60, 112.10
CrudeOIL
CrudeOIL, H1: Crude oil price was traded higher following prior rebound from the support level of 69.30. However, MACD histogram which illustrate diminishing upward momentum may suggest the commodity price to resume its bearish bias following a retracement from the 20-MA line (red).
Resistance level: 70.70, 71.30
Support level: 69.30, 67.90
GOLD
GOLD_, H1: Gold price was traded lower following prior retrace from the bearish trendline. MACD histogram which illustrate diminishing upward momentum suggests the commodity price to extend its losses after closing below the 20-MA line (red).
Resistance level: 1248.20, 1253.45
Support level: 1242.20, 1238.40
120718 Daily Analysis
12 July 2018 Daily Analysis
Dollar shines as PPI solace.
US dollar rose sharply on yesterday as economic data shows rising wholesale prices which has further cemented investors expectation for a strong inflation and prospects for further interest rate hike from the Federal Reserve (Fed). The dollar index was quoted up 0.60% to 94.40 during early Asian trading session. According to Labour Department, US Producer Price Index (PPI) for the month of June rose higher than expected with 0.3% versus forecast of 0.2%. Rising wholesale costs may be reflected into consumer prices, stoking higher expectations that the Fed could adopt more aggressive monetary policy tightening in order to control rising inflationary pressure. On the other hand, pair of EUR/USD ticked down 0.02% to $1.1673 after news outlet reported that European Central Bank members remained split over when to raise their interest rates. According to Reuters, some policymakers suggests higher possibility to hike interest as early as July 2019 while others suggested the move to be unlikely until autumn next year.
As for commodities, crude oil price fell more than 3% to $70.55 per barrel after OPEC monthly report shows that Libya has resumed their export activities which could see an increase of 0.7 million barrels per day in oil supplies. Otherwise, gold price was down by 0.82% to $1,241.81 a troy ounce following higher prospect for more aggressive rate hikes from the Federal Reserve in the long-run.
Today’s Holiday Market Close
Time Market Event
N/A
Today’s Highlight Events
Time Market Event
19:30 EUR ECB Publishes Account of Monetary Policy Meeting
20:30 USD FOMC Member Kashkari Speaks
Today’s Highlight Economy Data
| Time | Nation & Data | Previous | Forecast | Actual |
| 14:00 | EUR – CPI (MoM) (Jun) | 0.1% | 0.1% | – |
| 20:30 | USD – Core CPI (MoM) (Jun) | 0.2% | 0.2% | – |
| 20:30 | USD – Initial Jobless Claims | 231K | 226K | – |
GBPUSD
GBPUSD, H1: GBPUSD was traded lower following prior retracement from the strong resistance at 1.3280. Both MA line which continues to expand downwards suggests the pair to extend its losses after closing below 1.3200.
Resistance level: 1.3235, 1.3280
Support level: 1.3200, 1.3165
EURUSD
EURUSD, H1: EURUSD was traded lower following prior retracement from the resistance level near 1.1760. MACD histogram which illustrate diminishing downward momentum suggests the pair to experience technical correction before extending its bearish bias.
Resistance level: 1.1690, 1.1725
Support level: 1.1660, 1.1630
USDJPY
USDJPY, H4: USDJPY extended gains following prior breakout from the psychological level at 111.00. MACD histogram which illustrate persistent bullish signal suggests the pair to extend its upside bias after closing above 112.10.
Resistance level: 112.10, 112.60
Support level: 111.65, 111.00
CrudeOIL
CrudeOIL, H1: Crude oil price plunged sharply following prior retrace from the 20-MA line (red). However, MACD which illustrate diminished downward momentum suggests the commodity price to be traded higher in short-term as technical correction before extending its bearish trending.
Resistance level: 70.70, 71.30
Support level: 69.30, 67.90
GOLD
GOLD_, H1: Gold price was traded higher following prior rebound while currently testing near 1242.20. MACD histogram which illustrate diminishing downward momentum may suggest the commodity price to be traded higher in short-term as technical correction. Otherwise, major trend still skewed towards bearish bias.
Resistance level: 1242.20, 1248.20
Support level: 1238.40, 1233.70
110718 Daily Analysis
11 July 2018 Daily Analysis
Dollar sags as Trump escalate trade war into next level.
Greenback fell sharply during early Asian trading hours as White House releases an additional list of China imports that may be subjected to additional tariffs. The dollar index fell 0.30% while last quoted around 93.79 as of writing. Trade war between two economic powers escalate into next level after US President Donald Trump releases another gargantuan round of tariffs upon $200 billion China imports that could be subjected to 10% tariffs. According to trade representative Robert Lighthizer, he said that the move was made following China’s retaliation by imposing tariff upon $34 billion worth of US exports and threatened to execute on additional $16 billion. The tariff is expected to take effect after public consultations end on 30th August. Similarly, pair of USD/JPY plunged 0.38% to 110.84 following the announcement from White House. Escalating trade war risk has catalyzed higher risk aversion in the market and driving up the demand for safe-haven assets.
In the commodities market, crude oil price settled up 0.37% to $73.96 per barrel after American Petroleum Institute reported a massive draw of 6.796 million barrels of crude oil in producers inventories last week. Otherwise, gold price tacks up 0.05% to $1,256.18 a troy ounce as market participants weighs the prospect of interest rate hike and escalating trade war between US-China.
Today’s Holiday Market Close
Time Market Event
N/A
Today’s Highlight Events
Time Market Event
15:00 EUR ECB President Draghi Speaks
19:30 CrudeOIL OPEC Monthly Report
22:00 CAD BoC Monetary Policy Report
23:15 CAD BoC Press Conference
23:35 GBP BoE Gov Carney Speaks
Today’s Highlight Economy Data
| Time | Nation & Data | Previous | Forecast | Actual |
| 20:30 | USD – PPI (MoM) (Jun) | 0.5% | 0.2% | – |
| 22:00 | CAD – BoC Interest Rate Decision | 1.25% | 1.50% | – |
| 22:30 | CrudeOIL – Crude Oil Inventories | 1.245M | -4.489M | – |
| 22:30 | CrudeOIL – Gasoline Inventories | -1.505M | -0.750M | – |
GBPUSD
GBPUSD, H1: GBPUSD was traded lower following prior breakout from the bottom level of ascending channel. MACD which illustrate bearish signal suggests the pair to extend its losses towards the direction of next target at 1.3260.
Resistance level: 1.3310, 1.3350
Support level: 1.3260, 1.3210
EURUSD
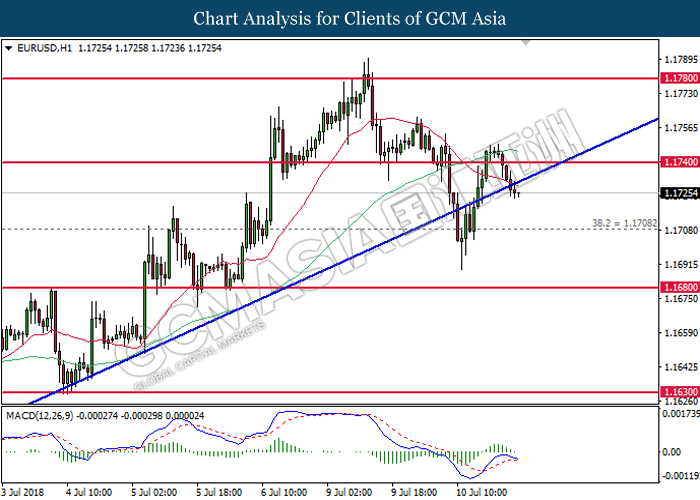
EURUSD, H1: EURUSD was traded lower following recent breakout from the upward trendline. MACD histogram which illustrate diminishing upward momentum suggests the pair to extend its losses, towards the direction of support level near 1.1710.
Resistance level: 1.1740, 1.1780
Support level: 1.1710, 1.1680
USDJPY
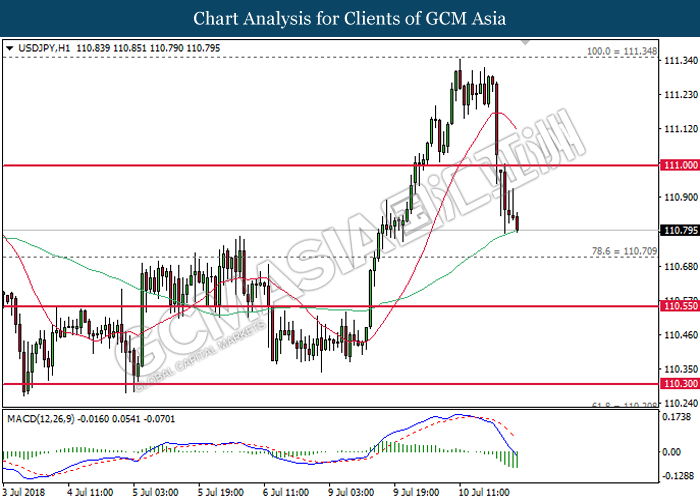
USDJPY, H1: USDJPY was traded lower following prior retracement from the resistance level at 111.35. MACD histogram which illustrate bearish signal suggests the pair to extend it losses after closing below the 60-MA line (green).
Resistance level: 111.00, 111.35
Support level: 110.70, 110.55
CrudeOIL
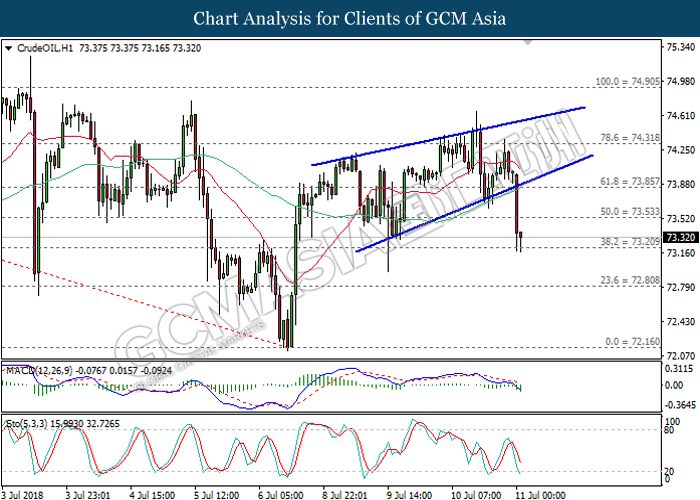
CrudeOIL, H1: Crude oil price was traded lower following prior breakout from the bottom level of descending channel. MACD and Stochastic Oscillator which illustrate bearish signal suggests the pair to extend its losses after breaking the target at 73.20.
Resistance level: 73.55, 73.85
Support level: 73.20, 72.80
GOLD
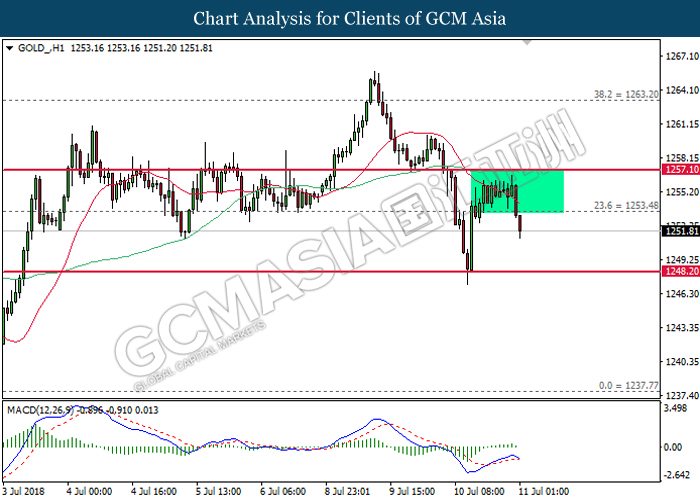
GOLD_, H1: Gold price was traded lower following prior breakout from the bottom level of sideways channel. MACD which illustrate bearish signal suggests the commodity price to extend its losses towards the direction of support level near 1248.20.
Resistance level: 1253.50, 1257.10
Support level: 1248.20, 1237.80
100718 Daily Analysis
10 July 2018 Daily Analysis
Dollar turns positive as Brexit woes continues.
US dollar rebounds sharply on yesterday following heightened political risk from Britain after Foreign Secretary Boris Johnson resigned from his position. Bear market took over pound sterling soon after Johnson announced his decision to resign due to Britain’s Prime Minister Theresa May’s Brexit plans which has raised the prospect for a vote of no confidence against her leadership. However, analysts postulate that it is fairly unlikely for members of Parliament to do so as there were no signs of majority in Conservative Party that would turn against May for now. Johnson resignation came a day after UK Brexit Secretary David Davis tendered his resignation as he claimed May’s Brexit plan to be too “dangerous”. Nonetheless, sterling managed to pared some of its losses as recent series of strong economic data has cemented market’s expectation for an imminent interest rate hike from the Bank of England in August. As of writing, the dollar index was quoted up 0.04% to 93.74 while pairing of GBP/USD tumbled 0.05% to $1.3252.
As for commodities, crude oil price settled lower by 0.05% to $73.93 per barrel after investors booked their profit near the psychological level of $74.00. On the other hand, gold price ticked up 0.05% to $1,258.32 a troy ounce following heightened political risk in the UK.
Today’s Holiday Market Close
Time Market Events
N/A
Today’s Highlight Events
Time Market Events
N/A
Today’s Highlight Economy Data
| Time | Nation & Data | Previous | Forecast | Actual |
| 09:30 | CNY – CPI (YoY) (Jun) | 1.8% | 1.9% | – |
| 09:30 | CNY – PPI (YoY) (Jun) | 4.1% | 4.5% | – |
| 16:30 | GBP – Manufacturing Production (MoM) (May) | -1.4% | 0.9% | – |
| 16:30 | GBP – GDP (Tentative) | * | * | * |
| 17:00 | EUR – German ZEW Economic Sentiment (Jul) | -16.1 | -18.0 | – |
| 22:00 | USD – JOLTs Job Openings (May) | 6.698M | 6.583M | – |
| 04:30 | CrudeOIL – API Weekly Crude Oil Stock | -4.500M | – | – |
GBPUSD
GBPUSD, H1: GBPUSD was traded higher following prior rebound while currently testing at the resistance level of 1.3260. MACD histogram which illustrate diminishing downward momentum suggests the pair to extend its gains after closing above 1.3260.
Resistance level: 1.3260, 1.3305
Support level: 1.3140, 1.3210
EURUSD
EURUSD, H1: EURUSD was traded higher following prior rebound from the support level of 1.1740. MACD histogram which illustrate diminishing downward momentum suggest the pair to extend its gains after closing above the 20-MA line (red).
Resistance level: 1.1780, 1.1820
Support level: 1.1740, 1.1710
USDJPY
USDJPY, H4: USDJPY extended gains following prior closure above the threshold of 110.70. Although MACD histogram begins to form a bullish crossover, the pair is required to close above the strong resistance of 111.00 in order to attain further confirmation.
Resistance level: 111.00, 111.35
Support level: 110.70, 110.55
CrudeOIL
CrudeOIL, H1: Crude oil price remains traded within a descending channel following prior retracement from the top level. MACD which has formed a bullish signal suggest the commodity price to extend its gains after breaking the top level of the channel.
Resistance level: 74.30, 74.90
Support level: 73.85, 73.55
GOLD
GOLD_, H1: Gold price extended its bullish bias following prior rebound from the 60-MA line (green). MACD histogram which illustrate diminishing downward momentum suggests the commodity price to edge further up after breaking the resistance level near 1259.00.
Resistance level: 1259.00, 1264.60
Support level: 1255.10, 1251.15
090718 Weekly Analysis
9 July 2018 Weekly Analysis
GCMAsia Weekly Report: July 9 – 13
Market Review (Forex): July 2 – 6
Greenback extended its losses on Friday following mixed US jobs report while coupled with recent escalation in trade war risk against China. The dollar index was quoted down 0.54%, ending the week at 93.96 against a basket of six major currencies.
According to US Labor Department, the economy added 213,000 jobs in June, exceeding economist forecast of 200,000 jobs. However, unemployment rate ticked up 0.2% from 3.8% to 4.0%, confounding expectations to remain unchanged at 3.8%. Likewise, average hourly earnings grew at a slower pace with only 0.2%, undershooting forecast for 0.3% increase.
Federal Reserve’s view that a tighter labor market would lead to wage growth and increasing inflationary pressure may be undermined as monthly hourly earnings rise slower than expected. The data has prompted investors to ponder whether the Fed could initiate two more interest rate hike during the second half of the year.
In addition, further bearish momentum was evoked after US kicked off trade tariff against China on Friday, raising the prospect for an imminent trade war between the two world largest economic superpowers. Though, the reaction on safe haven asset were muted as it is largely priced in by investors.
USD/JPY
Pair of USD/JPY tumbled down 0.17% to 110.47 during late Friday trading.
EUR/USD
Euro rose 0.47%, ending the week at $1.1745 against the US dollar.
GBP/USD
Pairing of GBP/USD tacked up 0.48%, closing the week at around $1.3287.
Market Review (Commodities): July 2 – 6
GOLD
Gold price extended its losses amid dollar’s weakness following higher prospect for further interest rate hike from the Federal Reserves in the long-run. Price of the yellow metal was down 0.22% or $2.77 to $1,255.02 a troy ounce.
The safe-haven asset failed to snap its three-week losing streak as higher prospect for interest rate hike in the long-term continues to cap any substantial recovery on its prices. Although recent enactment of tariff upon China goods raised higher risk of a trade war, most economist believes that the factor has been mostly priced in prior to the announcement.
Crude Oil
Crude oil price settled higher last Friday following higher prospect for a market supply shortage due to looming sanctions against Iran. Price of the black commodity skyrocketed by 1.04% to $74.00 per barrel during late Friday trading hours.
Investors continue to bet on a global crude supply shortage due to rising oil demand in the market while coupled with a potential drop in oil producing countries such as Iran and Venezuela. Prior, US vowed to slap hefty sanctions upon Iran’s crude exports due to recent drawback in nuclear deal between both countries. Likewise, ongoing challenges in Venezuela oil industry has also further supported the bullish sentiment.
However, gains on the commodity were capped after US oilfield services firm reported a rise in US oil rigs. According to Baker Hughes, the number of active drilling rigs rose by 5 last week to a total of 863. The report shows a sharp rebound in oil production activities that may signal potential expansion and increase in domestic crude output. In addition, Saudi Arabia recently informed OPEC that they raise output by 458,000 barrels per day in order to counter with imminent shortage arising from Venezuela and Iran to control oil prices.
Weekly Outlook: July 9 – 13
For the week ahead, investors will pay attention to major economic release in the United States especially inflation-linked indicators such as CPI and PPI. The data could provide further signals with regards to Federal Reserve’s future monetary policy stance and rate hike prospects.
On the other hand, oil traders will pay attention to monthly report bound to be released by International Energy Agency (IEA) and Organization of the Petroleum Exporting Countries (OPEC) to gauge the strength of global oil demand and supply.
Highlighted economy data and events for the week: July 9 – 13
| Monday, July 9 |
Data EUR – German Trade Balance (May)
Events USD – FOMC Member Kashkari Speaks EUR – ECB President Draghi Speaks
|
| Tuesday, July 10 |
Data CNY – CPI (YoY) (Jun) CNY – PPI (YoY) (Jun) GBP – Manufacturing Production (MoM) (May) EUR – German ZEW Economic Sentiment (Jul) USD – JOLTs Job Openings (May)
Events N/A
|
| Wednesday, July 11 |
Data CrudeOIL – API Weekly Crude Oil Stock USD – PPI (MoM) (Jun) CAD – BoC Interest Rate Decision CrudeOIL – Crude Oil Inventories CrudeOIL – Gasoline Inventories
Events CAD – BoC Monetary Policy Report CAD – BoC Press Conference
|
| Thursday, July 12 |
Data EUR – German CPI (MoM) (Jun) USD – Core CPI (MoM) (Jun) USD – Initial Jobless Claims
Events USD – FOMC Member Williams Speaks EUR – ECB Publishes Account of Monetary Policy Meeting USD – FOMC Member Kashkari Speaks
|
|
Friday, July 13
|
Data CNY – Trade Balance (USD) (Jun) USD – Import Price Index (MoM) (Jun) USD – Michigan Consumer Sentiment (Jul) CrudeOIL – US Baker Hughes Oil Rig Count
Events USD – FOMC Member Harker Speaks USD – FOMC Member Bostic Speaks
|
Technical Weekly Outlook: July 9 – 13
Dollar Index
DOLLAR_INDX, Daily: Dollar index extended its losses following prior breakout from the upward trendline. MACD histogram which illustrate persistent bearish signal suggests the index to advance further down, towards the direction of 93.00.
Resistance level: 94.10, 95.00
Support level: 93.00, 91.95
GBPUSD
GBPUSD, Daily: GBPUSD was traded higher following prior rebound from the support level of 1.3045. MACD histogram which illustrate bullish signal suggests the pair to extend its gains after successfully closing above the threshold of 1.3300.
Resistance level: 1.3300, 1.3445
Support level: 1.3170, 1.3045
USDJPY
USDJPY, Daily: USDJPY was traded in an ascending triangle formation while currently testing at the bottom level. Although Stochastic Oscillator begins to form a rebound signal, USDJPY requires a bullish closure above the trendline to further validate such bias.
Resistance level: 110.50, 111.00
Support level: 109.35, 108.25
EURUSD
EURUSD, Daily: EURUSD extended gains following prior breakout from the top level of descending triangle. MACD histogram which illustrate persistent upside bias suggests the pair to advance further up after closing above the 60-MA line (green).
Resistance level: 1.1850, 1.2010
Support level: 1.1700, 1.1560
GOLD
GOLD_, Daily: Gold price was traded higher following prior rebound from the support level of 1239.15. While the MACD histogram begins to form a bullish crossover, a close above 1257.00 is required to attain further confirmation.
Resistance level: 1257.00, 1266.25
Support level: 1239.20, 1225.00
Crude Oil
CrudeOIL, Daily: Crude oil price was traded lower following prior retracement from the strong resistance at 74.00. MACD histogram which illustrate diminishing upward momentum suggests the commodity price to be traded lower in short-term as technical correction. Long-term trend direction is still subject to upward trendline.
Resistance level: 74.00, 77.55
Support level: 70.45, 68.40
060718 Daily Analysis
6 July 2018 Daily Analysis
Dollar under pressure as Fed thread cautiously.
US dollar remained subjected to bearish momentum during North American trading hours while investors digest recent release of FOMC meeting minutes which depicts a rather cautious tone. Majority of the participants noted recent consistency in regional economic growth and deeming it as “very strong” has cemented investors prospect for further rate hike beyond Federal Reserve’s neutral rate target. However, a handful number of the members expressed their concern over recent trade policy tension which had intensified and may lead to a possible slowdown in global economic growth. Higher uncertainty and risks may garner negative effects on regional business sentiment and investment spending. Otherwise, Euro recovered some losses as recent data shows diminishing downside upon Germany’s economic progression. For the month of May, German Factory Orders grew by 2.6% versus economic forecast of 1.1%. The data has reduced the anxiety among investors following prior series of data which signals possible economic slowdown. As of writing, dollar index was down 0.11% to 94.07 while pair of EUR/USD notched up 0.02% to $1.1692.
As for commodities, crude oil price extended its losses by 0.38% to $72.96 per barrel after EIA reported that US crude stockpiles rose by 1.245 million barrels last week, confounding expectation to reduce by 5.200 million barrels. Subsequently, gold price was traded flat around $1,257.68 a troy ounce while market participants anticipate the release of Nonfarm Payrolls report due later tonight.
Today’s Holiday Market Close
Time Market Event
N/A
Today’s Highlight Events
Time Market Event
N/A
Today’s Highlight Economy Data
| Time | Nation & Data | Previous | Forecast | Actual |
| 14:00 | EUR – German Industrial Production (MoM) (May) | -1.0% | 0.3% | – |
| 15:30 | GBP – Halifax House Price Index (MoM) (Jun) | 1.5% | 0.3% | – |
| 20:30 | USD – Average Hourly Earnings (MoM) (Jun) | 0.35 | 0.3% | – |
| 20:30 | USD – Nonfarm Payrolls (Jun) | 223K | 220K | – |
| 20:30 | USD – Unemployment Rate (Jun) | 3.8% | 3.8% | – |
| 20:30 | CAD – Employment Change (Jun) | -7.5K | 24.0K | – |
| 20:30 | CAD – Unemployment Rate (Jun) | 5.85 | 5.8% | – |
| 22:00 | CAD – Ivey PMI (Jun) | 62.5 | 63.2 | – |
| 01:00 | CrudeOIL – US Baker Hughes Oil Rig Count | 858 | – | – |
GBPUSD
GBPUSD, H1: GBPUSD was traded lower following prior retrace from the resistance level at 1.3260. MACD histogram which illustrate persistent downward signal suggests further bearish bias. However, a close below 1.3210 is required to attain further confirmation.
Resistance level: 1.3260, 1.3310
Support level: 1.3210, 1.3145
EURUSD
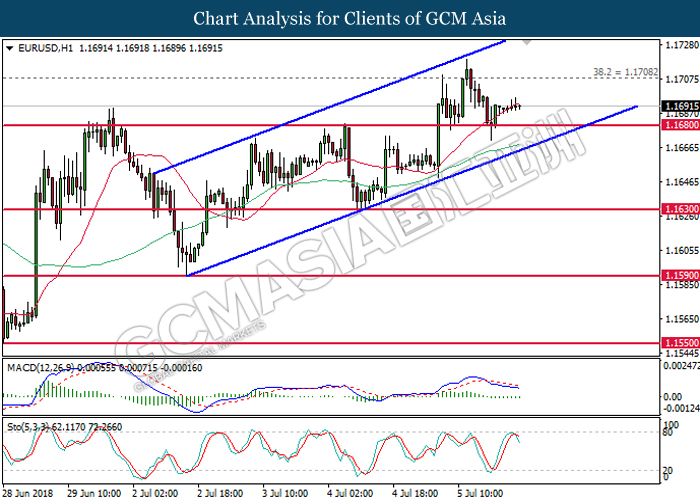
EURUSD, H1: EURUSD remains traded within an ascending channel following prior rebound from the bottom level. However, both MACD and Stochastic Oscillator which portrays bearish bias suggest the pair to extend its losses after closing below the 20-MA line (red).
Resistance level: 1.1710, 1.1740
Support level: 1.1680, 1.1630
USDJPY
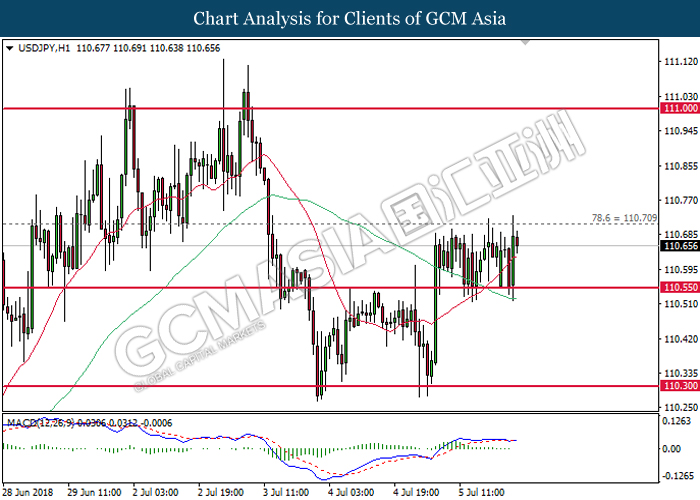
USDJPY, H1: USDJPY remains traded within a tight range that are subjected to 110.55 and 110.75. Due to the lack of signal from MACD and price action, it is suggested to wait for further confirmation before entering the market.
Resistance level: 110.70, 111.00
Support level: 110.55, 110.30
CrudeOIL
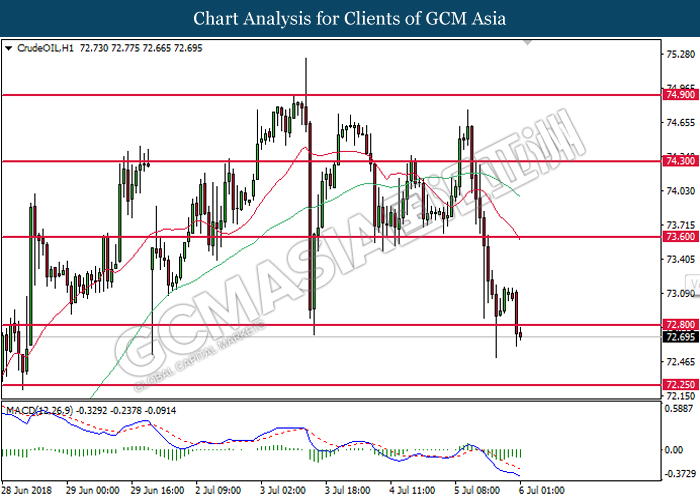
CrudeOIL, H1: Crude oil price extended losses following prior breakout at support level of 72.80. Both MA line and MACD histogram which illustrate downward signal suggest the commodity price to advance further down, towards the direction of 72.25.
Resistance level: 73.80, 73.60
Support level: 72.25, 71.15
GOLD
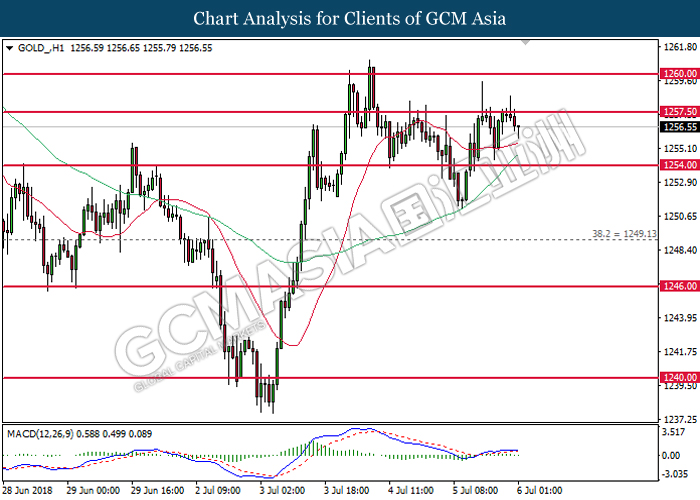
GOLD_, H1: Gold price was traded lower following prior retracement from 1257.50. MACD histogram which illustrate bearish signal suggests its prices to extend its losses in short-term, towards the direction of 1254.00.
Resistance level: 1257.50, 1260.00
Support level: 1254.00, 1249.15
050718 Daily Analysis
5 July 2018 Daily Analysis
Dollar relinquished while greater uncertainty lies ahead.
Bears took over greenback’s momentum while US financial market were closed on yesterday following Independence Day celebration. Dollar index slumped 0.15% while last quoted at 94.15 during Asian trading session. With the US market shut, investors will now turn their attention to a rather busy remainder of the week, being FOMC’s meeting minutes and highly anticipated Nonfarm Payrolls report. Likewise, investors were seen to remained cautious ahead of Friday’s deadline whereby US is bound to impose a 25% tariff upon Chinese imports that may see a similar move taken by Beijing as retaliation. On the other hand, pairing of GBP/USD notched up 0.02% to $1.3230 over the backdrop of optimistic economic data. In June, Services PMI shows further expansion with the latest reading at 55.1 versus economist forecast of 53.9. The data portray signs of an economic rebound for the second quarter that may open the door for an August interest rate hike by the Bank of England.
As for commodities market, crude oil price plunged 0.20% to $74.22 per barrel in a thin holiday trade while market participants eye on US crude stockpiles report slated for release tonight. On the other hand, gold price settled up 0.08% to $1,256.99 a troy ounce after Iran threatened to reduce its cooperation with United Nation’s nuclear body after US President Donald Trump threatened to impose fresh sanctions against Iranian oil sales.
Today’s Holiday Market Close
Time Market Event
N/A
Today’s Highlight Events
Time Market Event
18:00 GBP BoE Gov Carney Speaks
Today’s Highlight Economy Data
| Time | Nation & Data | Previous | Forecast | Actual |
| 14:00 | EUR – German Factory Orders (MoM) (May) | -2.5% | 1.1% | – |
| 20:15 | USD – ADP Nonfarm Employment Change (Jun) | 178K | 190K | – |
| 20:30 | USD – Initial Jobless Claims | 227K | 231K | – |
| 22:00 | USD – ISM Non-Manufacturing PMI (Jun) | 58.6 | 58.3 | – |
| 22:00 | USD – ISM Non-Manufacturing Employment (Jun) | 54.1 | – | – |
| 23:00 | CrudeOIL – Crude Oil Inventories | -9.891M | -5.200M | – |
| 23:00 | CrudeOIL – Gasoline Inventories | 1.156M | -0.817M | – |
GBPUSD
GBPUSD, H1: GBPUSD was traded lower following prior retracement from the resistance level at 1.3235. Recent price action may suggest the pair to be traded lower in short-term as technical correction. Otherwise, major trend is still subject to bullish trendline.
Resistance level: 1.3235, 1.3290
Support level: 1.3185, 1.3150
EURUSD
EURUSD, H1: EURUSD remains traded within an ascending triangle while recently rebounded from the lower level. Due to lack of apparent signal from MACD and price action, it is suggested to refrain from entering the market until further signal has been obtained.
Resistance level: 1.1680, 1.1710
Support level: 1.1630, 1.1590
USDJPY
USDJPY, H1: USDJPY was traded lower following prior retrace from the 60-MA line (green). MACD histogram which illustrate diminishing upward momentum suggest the pair to extend its losses in short-term towards 110.20.
Resistance level: 110.70, 111.00
Support level: 110.20, 109.85
CrudeOIL
CrudeOIL, H1: Crude oil price was traded lower following prior retracement while currently testing at the bottom level. Although MACD histogram illustrate bearish signal, a break below the ascending channel as required to attain further confirmation.
Resistance level: 74.90, 76.10
Support level: 73.60, 72.80
GOLD
GOLD_, H1: Gold price was traded higher following prior rebound from the support level at 1254.00. However, MACD histogram which continues to illustrate bearish bias may suggest the commodity price remain in consolidation phase before extending its bullish bias.
Resistance level: 1260.00, 1267.00
Support level: 1254.00, 1249.15
040718 Daily Analysis
4 July 2018 Daily Analysis
Dollar losses steam as Euro reconcile.
US dollar edges lower on Wednesday following a sharp rebound in Euro after German Chancellor Angela Merkel averted an imminent split of her fragile coalition government by reaching a compromise within party members. Overnight, Merkel resolved a row over migration policy after achieving consensus with Interior Minister Horst Seehofer to tighten border controls and setting up closed holding centers to allow faster processing of asylum seekers and remove those whom are not qualified. However, losses on the greenback were capped following the release of better-than-expected economic data from the United States. According to Commerce Department, US factory orders grew by 0.4% during the month of May, a tad higher than economist forecast of only 0.1%. Overall, trading volumes were subdued as market participants reduces their position ahead of US Independence Day where financial market will be closed for trading. As of writing, dollar index settled down 0.46% to 94.35 while pair of EUR/USD rose 0.02% to $1.1660.
In the commodities market, crude oil price pared its losses by 0.42% to $74.69 per barrel following a sharp plunge from the psychological level at $75.00 on yesterday. Bearish momentum was evoked on yesterday after Saudi Arabia agreed to US President Donald Trump demand to increase their daily production in order to stabilize the oil market. Otherwise, gold price recovered its losses by 0.07% to $1,253.78 a troy ounce following broad weakness on the greenback.
Today’s Holiday Market Close
Time Market Event
All Day USD Independence Day
Today’s Highlight Events
Time Market Event
N/A
Today’s Highlight Economy Data
| Time | Nation & Data | Previous | Forecast | Actual |
| 09:30 | AUD – Retail Sales (MoM) (May) | 0.4% | 0.3% | – |
| 09:45 | CNY – Caixin Services PMI (Jun) | 52.9 | 52.7 | – |
| 15:55 | EUR – German Services PMI (Jun) | 53.9 | 53.9 | – |
| 16:30 | GBP – Services PMI (Jun) | 54.0 | 53.9 | – |
GBPUSD
GBPUSD, H1: GBPUSD was traded higher following prior breakout from the top level of narrowing triangle. Recent price action while couples with both MA line which shows bullish signal suggests the pair to extend its gains, towards the direction of resistance level at 1.3235.
Resistance level: 1.3235, 1.3290
Support level: 1.3185, 1.3150
EURUSD
EURUSD, H1: EURUSD remains traded higher following prior breakout from the top level of narrowing triangle. Both MA line which continues to expand upward suggest the pair to advance further up, towards the direction of resistance level at 1.1680.
Resistance level: 1.1680, 1.1710
Support level: 1.1640, 1.1590
USDJPY
USDJPY, H4: USDJPY extended its losses following prior retracement from the resistance level of 111.05. MACD histogram which illustrate ongoing bearish bias suggests the pair to extend its losses towards the direction of 110.30.
Resistance level: 110.55, 111.05
Support level: 110.30, 110.00
CrudeOIL
CrudeOIL, H1: Crude oil price was traded higher following prior rebound while recently re-entered into the ascending channel. MACD histogram which illustrate the formation of golden cross suggests further bullish signal. However, a close above 74.90 is required to attain further confirmation.
Resistance level: 74.90, 76.10
Support level: 72.80, 71.15
GOLD
GOLD_, H1: Gold price was traded higher following prior breakout from the top level of descending channel. Both MA line which forms a golden cross signal suggests the commodity price to extend its gains, towards the direction of resistance level at 1260.00.
Resistance level: 1260.00, 1267.00
Support level: 1254.00, 1249.15