110417 Daily Analysis
11 April 2017 Daily Analysis
Euro haunted by election and Le Pen.
Euro was held steady during Asian trading hours, last seen at $1.0591 after mending some losses from overnight’s low of $1.0568. The common currency received broader pressure due to heightened uncertainty ahead of France’s presidential election. Recent polls indicated that far-right candidate Marine Le Pen and centrist Emmanuel Macron will come ahead during April 23rd first round off, before a face off on May 7th run-off. “Le Pen presidency is perceived to increase the likelihood of France’s withdrawal from the EU and the uncertainty is likely to continue about what this could mean for the euro, along with potential hit to global markets,” said Mark Burgess, global head of equities in London. Otherwise, the greenback sag against its major peers as tensions over against North Korea and Syria weighed on US Treasury yields, offsetting expectations for interest rate hike. The dollar index was down 0.10% and last seen at 101.89.
As for commodities, crude oil price extended its overnight gains by 0.15%, touching five-weeks high of $53.16 following a shutdown at Libya’s largest oilfield. Concurrently, gold price was up 0.24% to $1,254.05 due to higher geopolitical risks and a weaker dollar.
Today’s Holiday Market Close
Time Market Event
N/A
Today’s Highlight Events
Time Market Event
N/A
Today’s Highlight Economy Data
| Time | Nation & Data | Previous | Forecast | Actual |
| 09:30 | AUD – NAB Business Confidence (Mar) | 7 | – | 6 |
| 16:30 | GBP – CPI (YoY) (Mar) | 2.3% | 2.3% | – |
| 17:00 | EUR – German ZEW Economic Sentiment (Apr) | 12.8 | 14.0 | – |
| 22:00 | USD – JOLTs Job Openings (Feb) | 5.626M | 5.655M | – |
| 04:30 | Crude Oil – API Weekly Crude Oil Stock | -1.830M | – | – |
GBPUSD
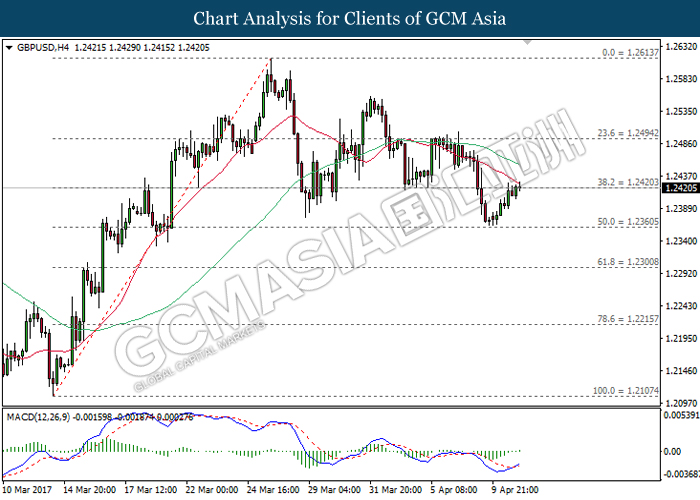
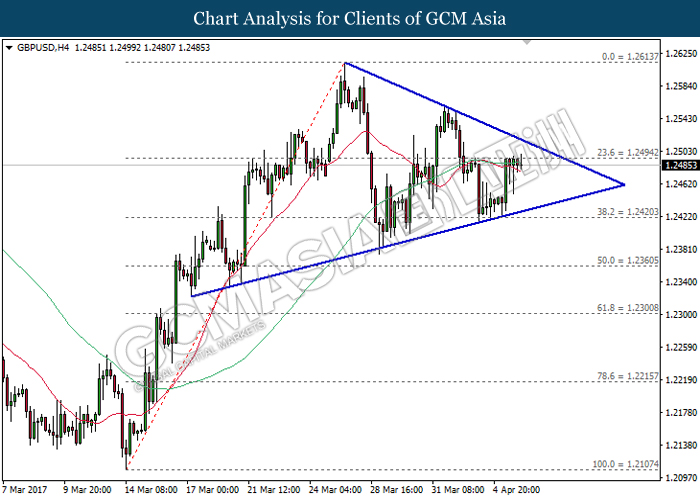
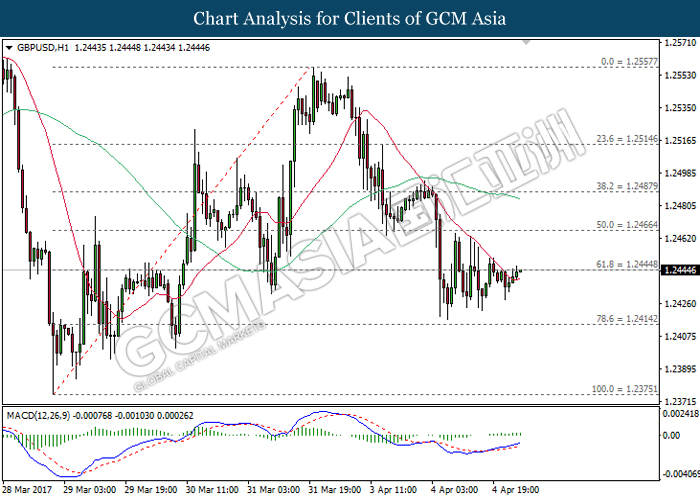
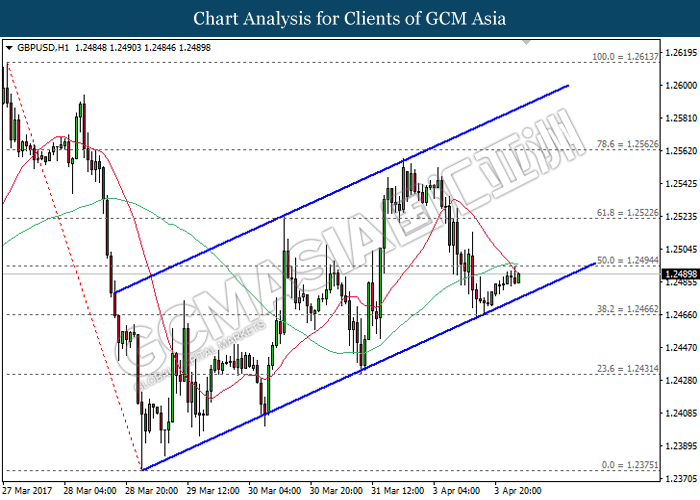
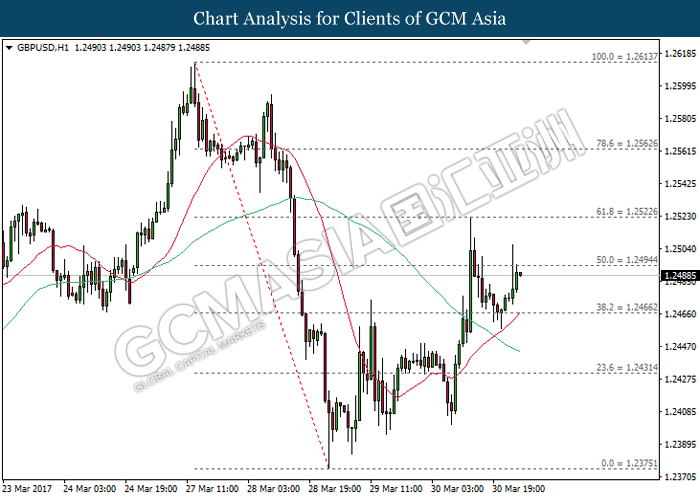
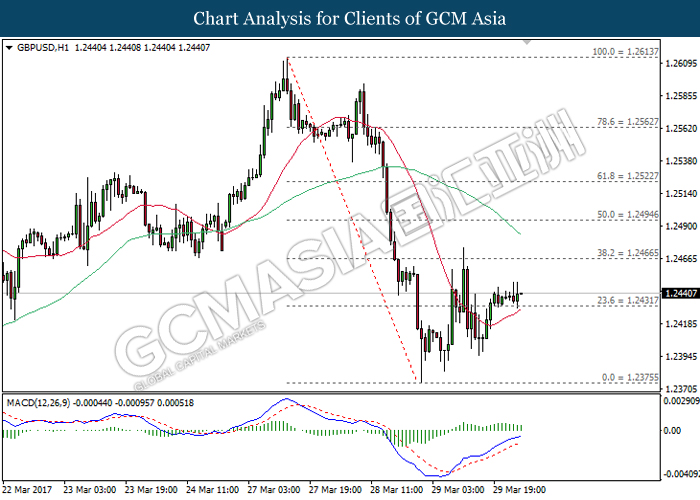
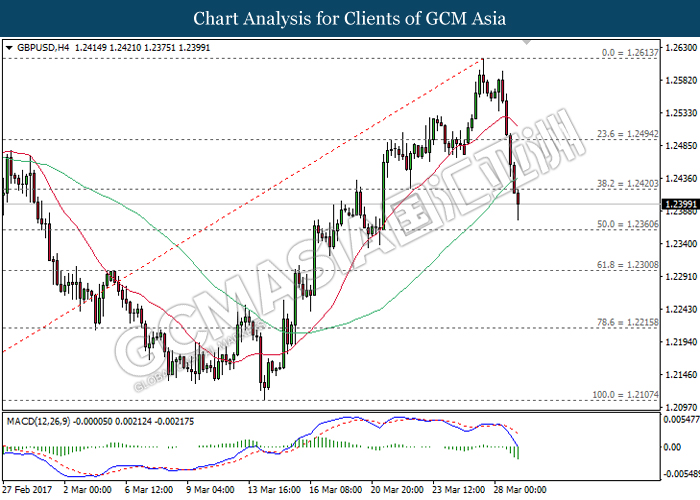
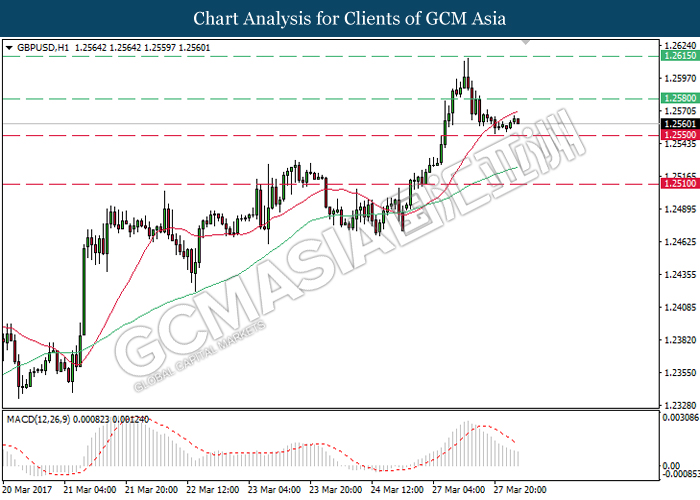
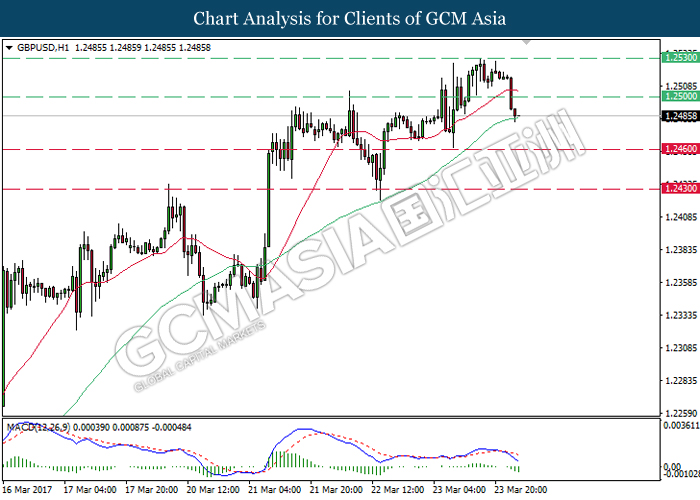
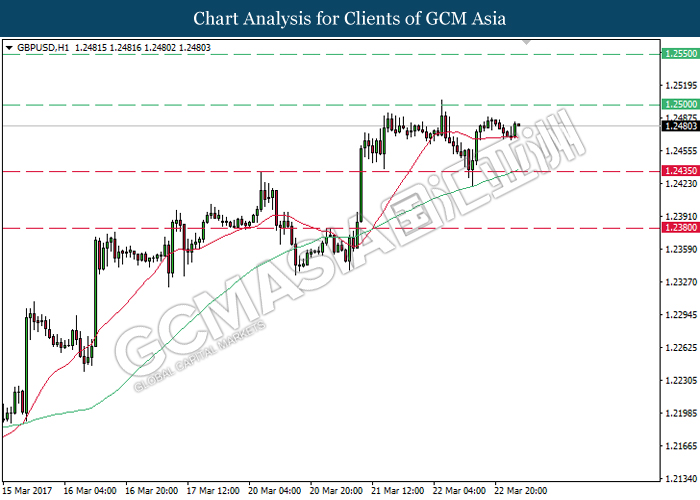
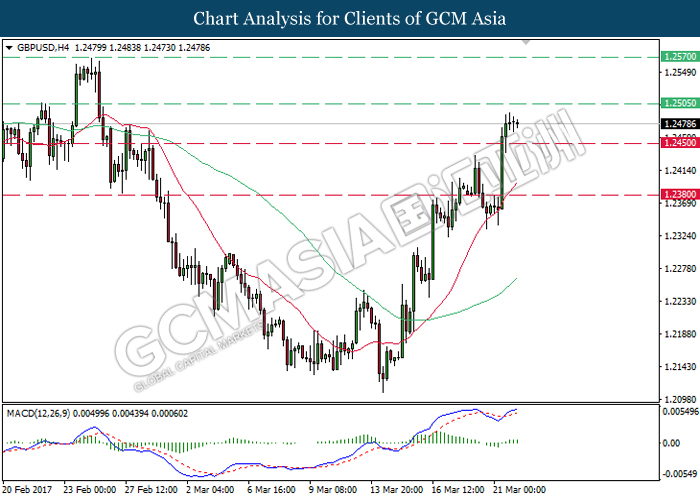
GBPUSD, H4: GBPUSD extended its gains following prior rebound from the support level of 1.2360. With regards to the MACD histogram which begins to illustrate upward signal and momentum, a closure above the 20-moving average line (red) would suggest GBPUSD to extend its technical correction and to be traded higher in the short-term. Long-term trend direction still suggests GBPUSD to move further downwards.
Resistance level: 1.2495, 1.2615
Support level: 1.2420, 1.2360
EURUSD
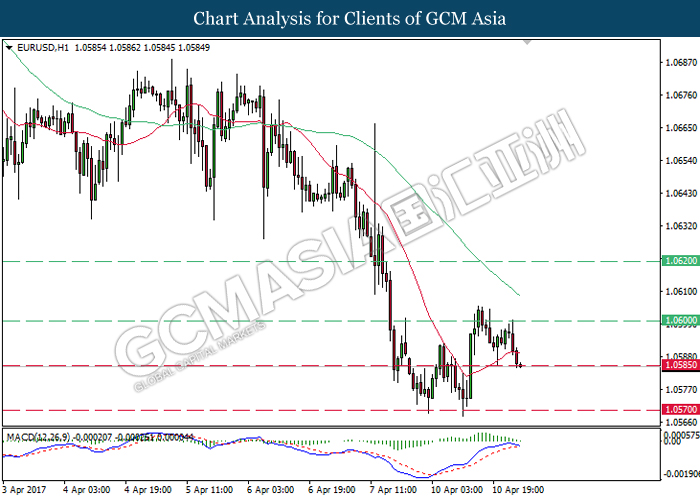
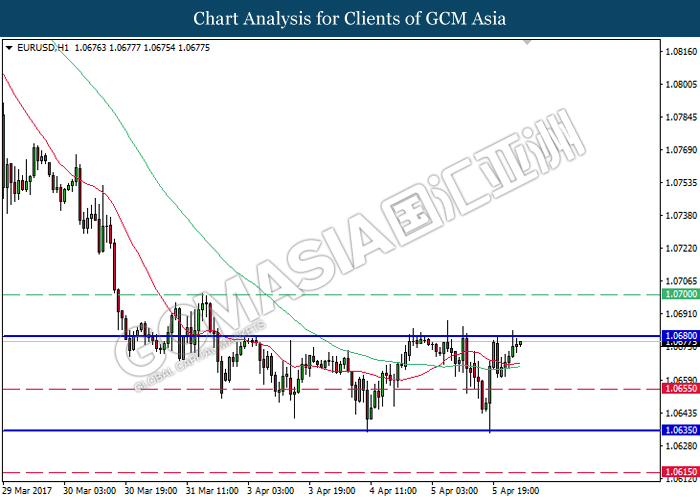
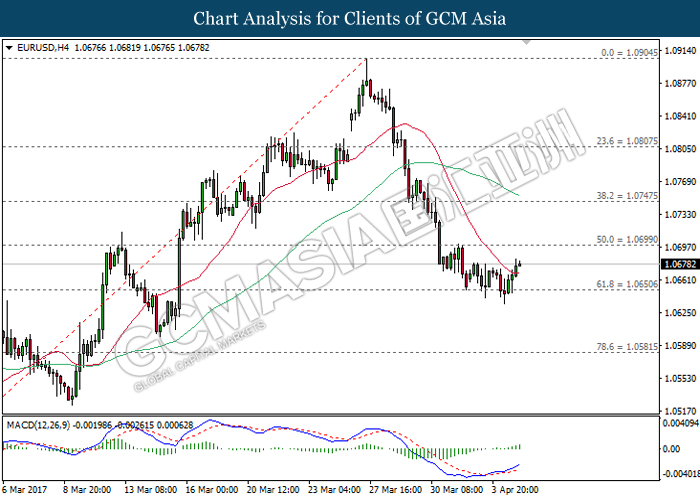
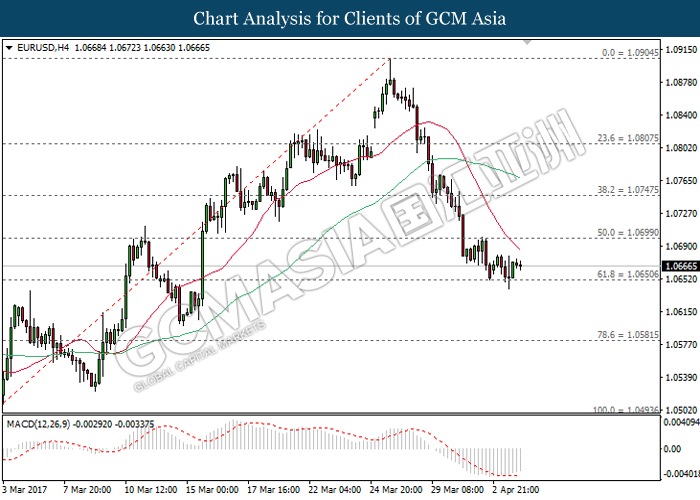
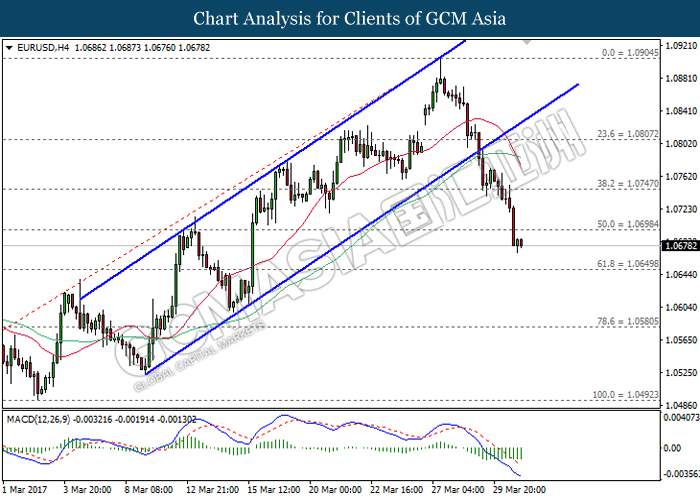
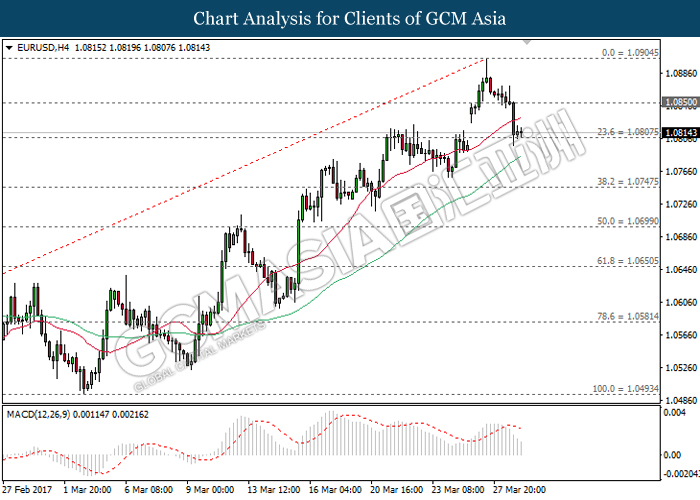
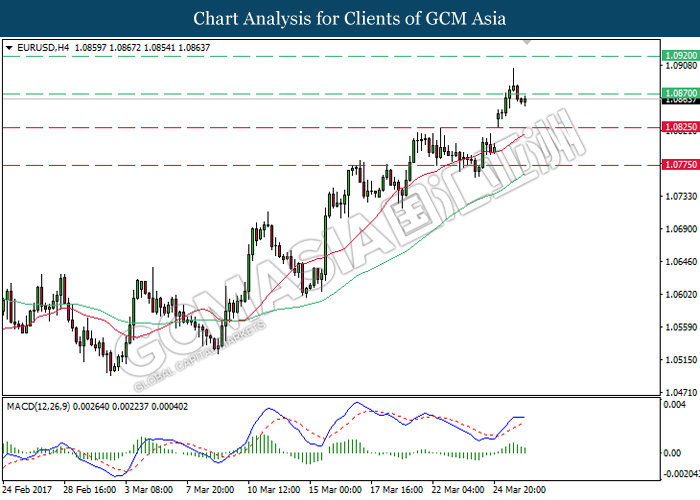
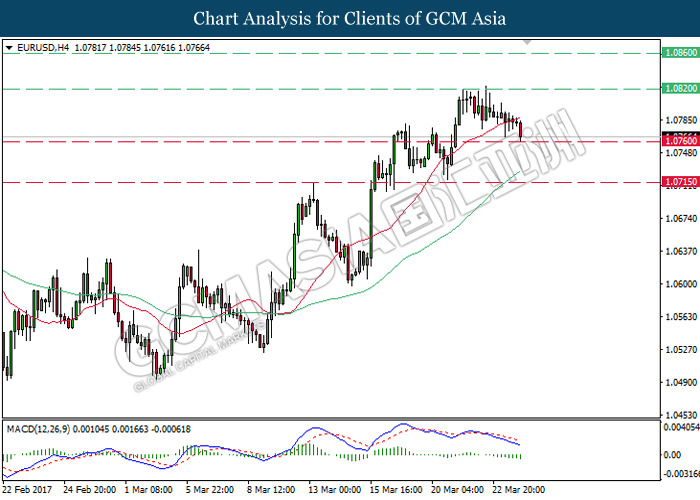
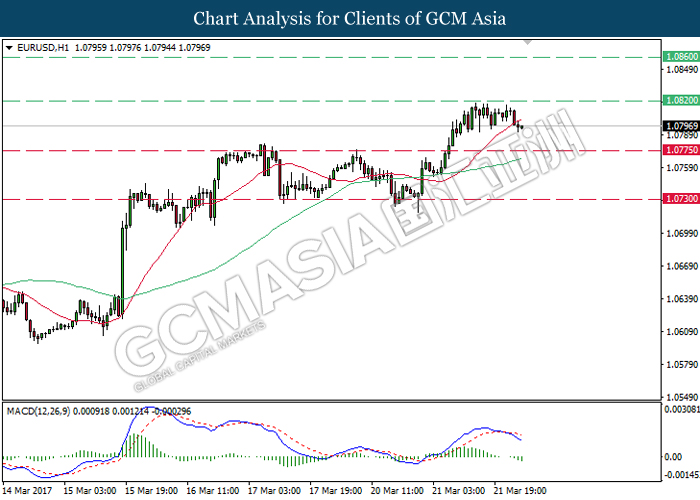
EURUSD, H1: EURUSD was traded lower following previous retracement from the resistance level of 1.0600. As the MACD histogram’s upward signal line begins to narrow sideways and may form an imminent downward signal, EURUSD is expected to extend its downward momentum after breaking the support level of 1.0585.
Resistance level: 1.0600, 1.0620
Support level: 1.0585, 1.0570
USDJPY
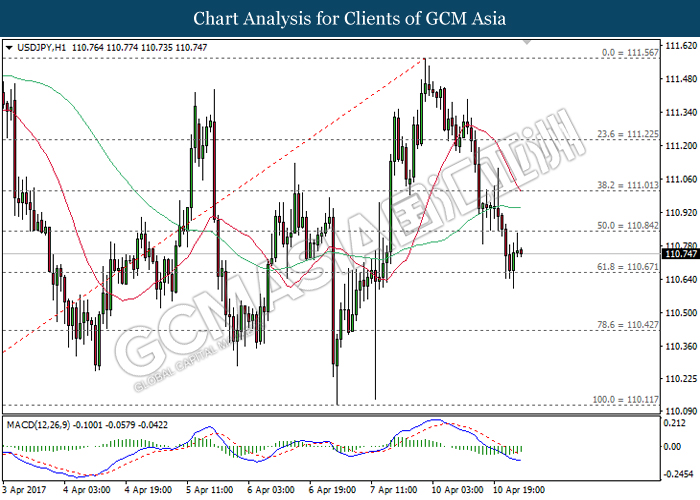
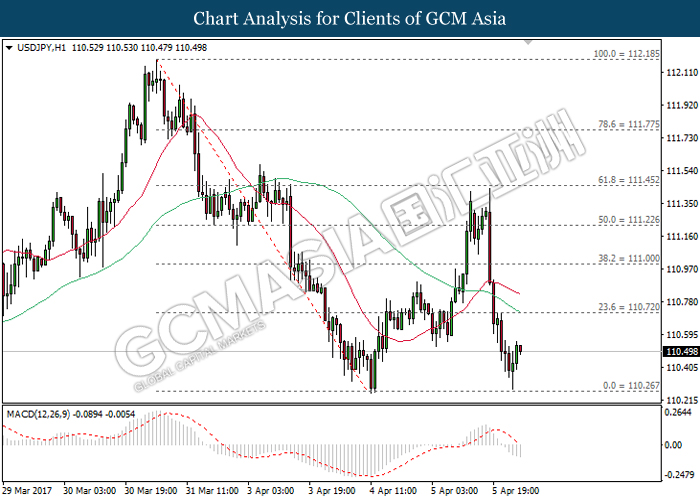
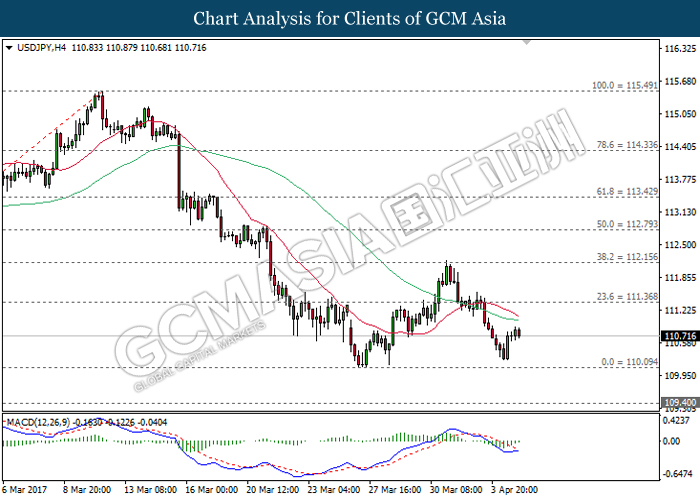
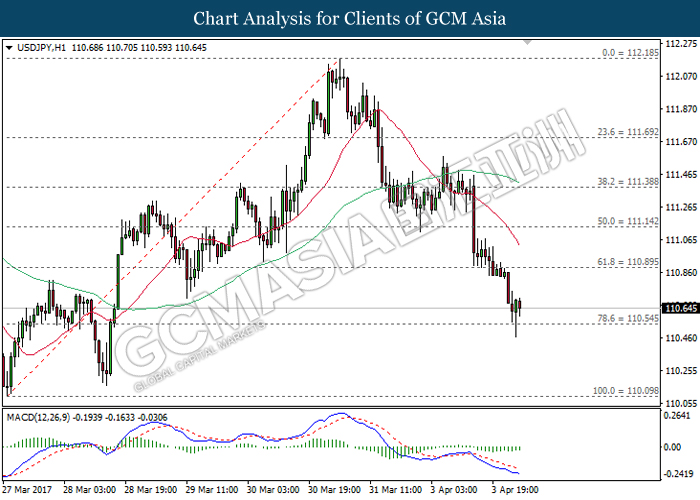
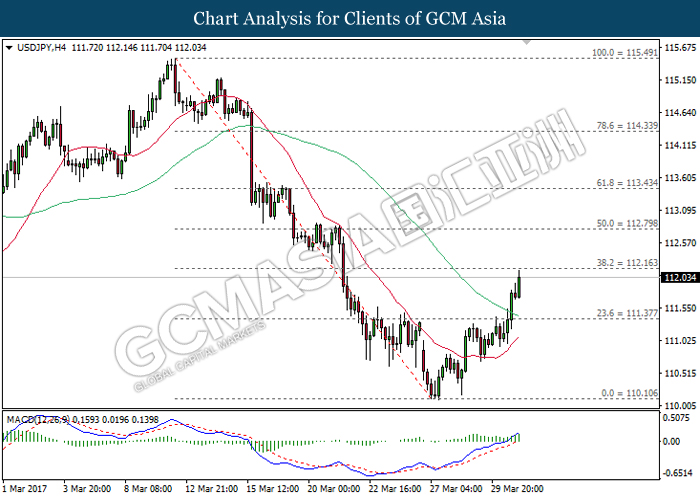
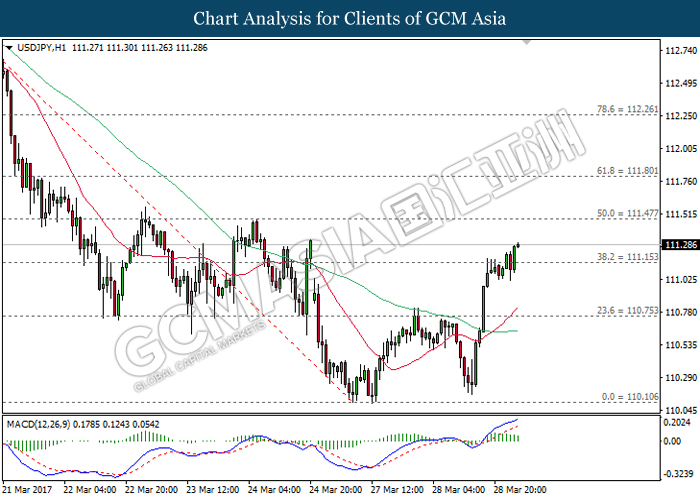
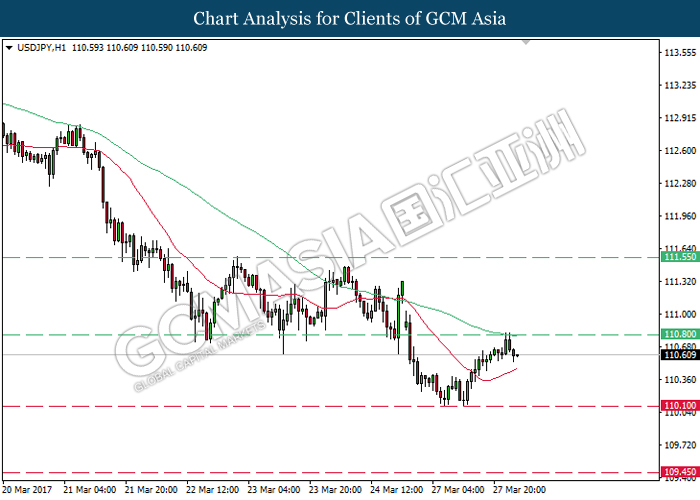
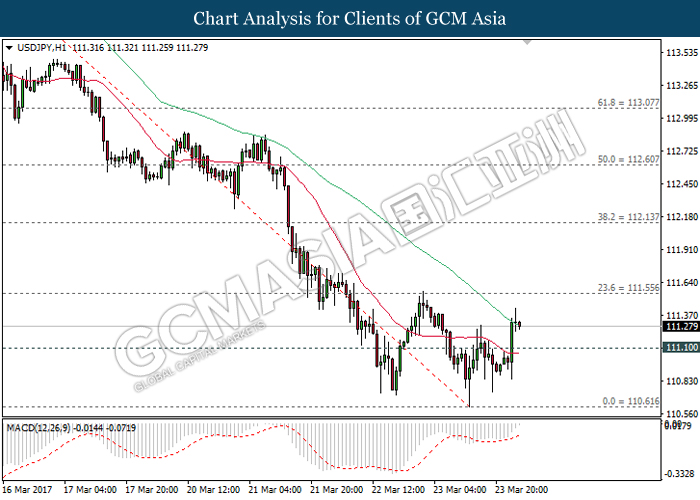
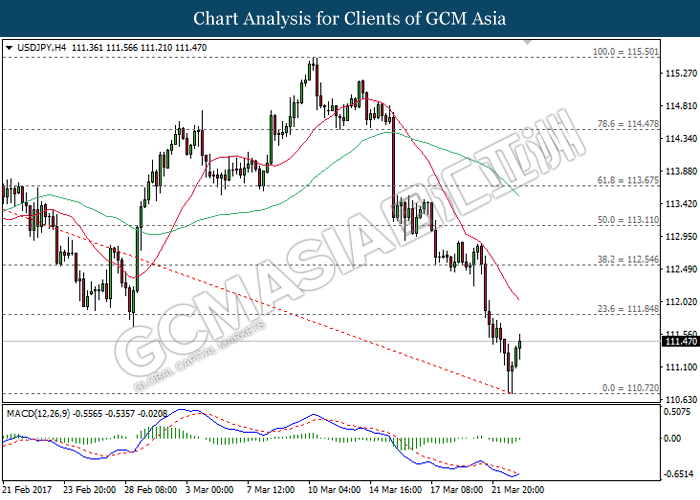
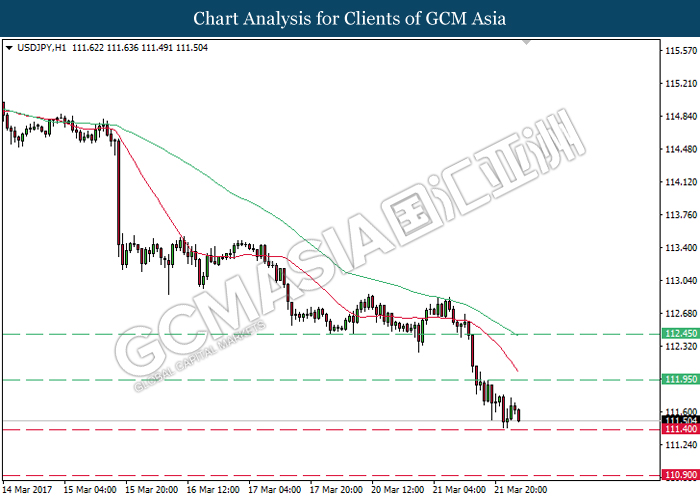
USDJPY, H1: USDJPY was traded higher following previous rebound near the support level of 110.65. However as both moving average line continues to narrow downwards while coupled with MACD histogram which portrays moderate downward signal, a closure below the level of 110.65 would suggest USDJPY to move further downwards.
Resistance level: 110.85, 110.00
Support level: 110.65, 110.40
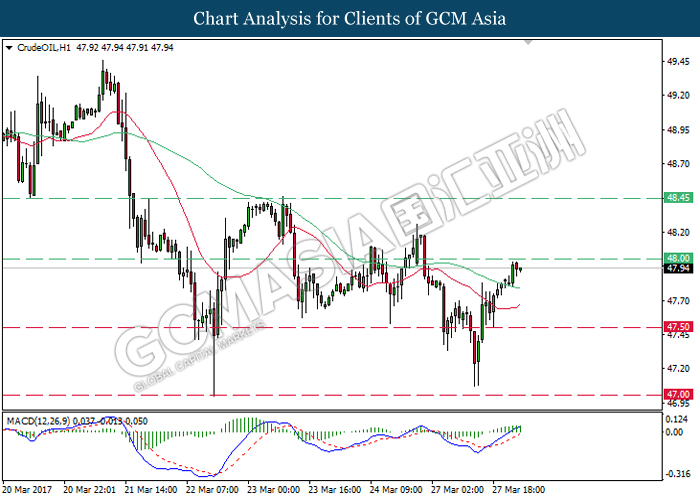
CrudeOIL
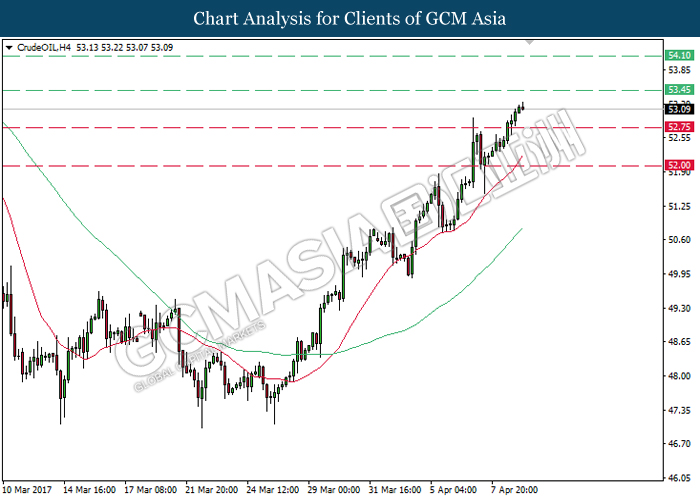
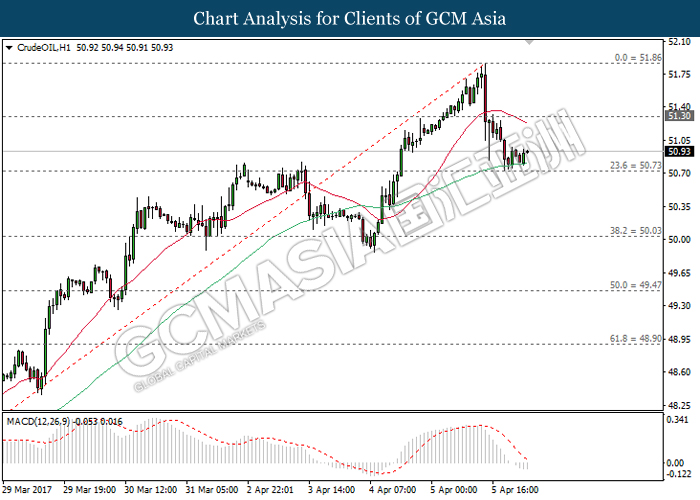
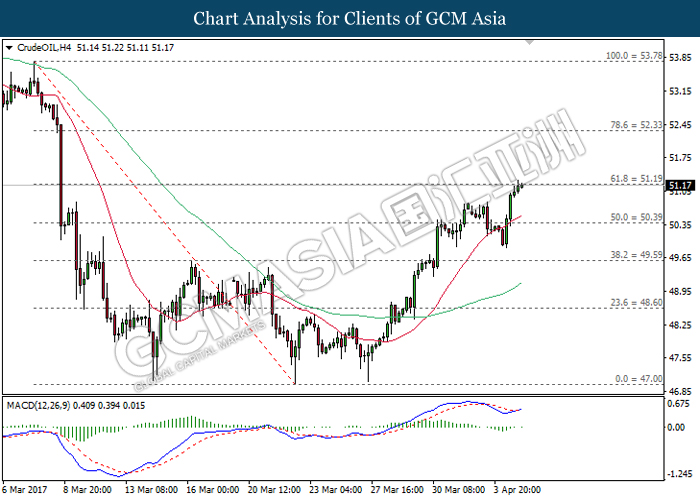
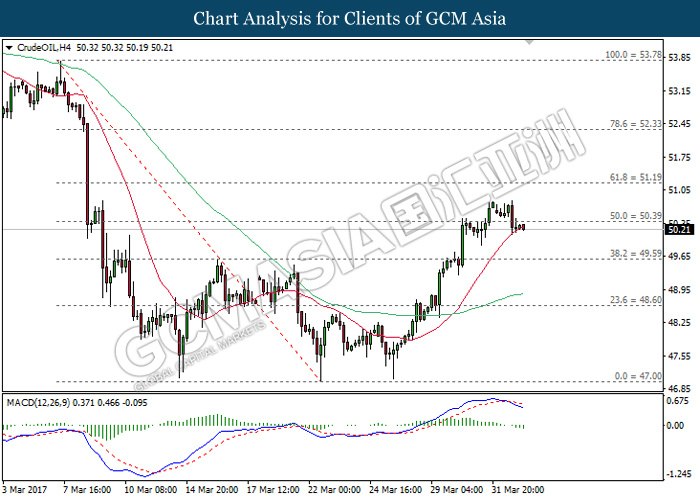
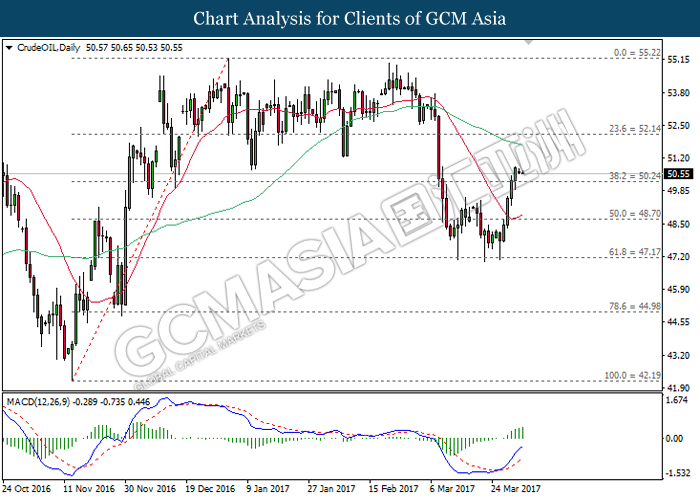
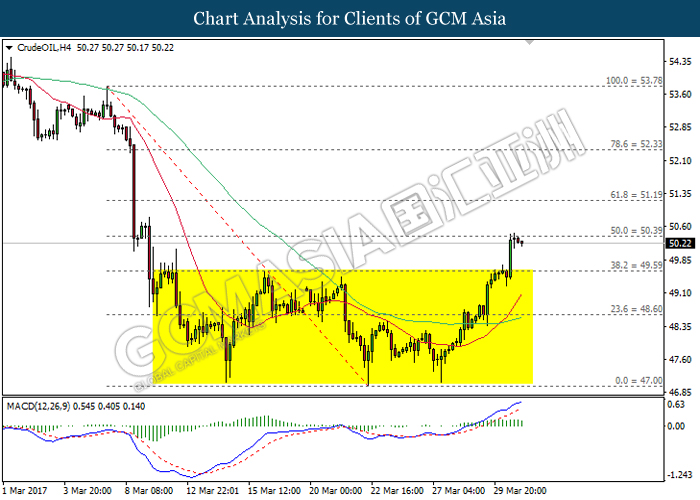
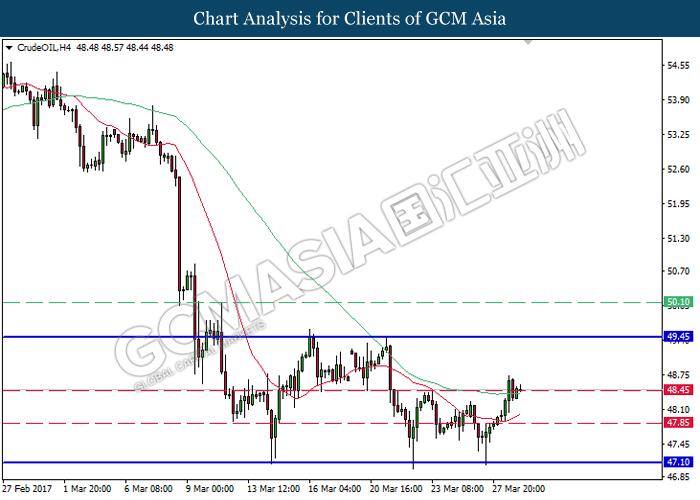
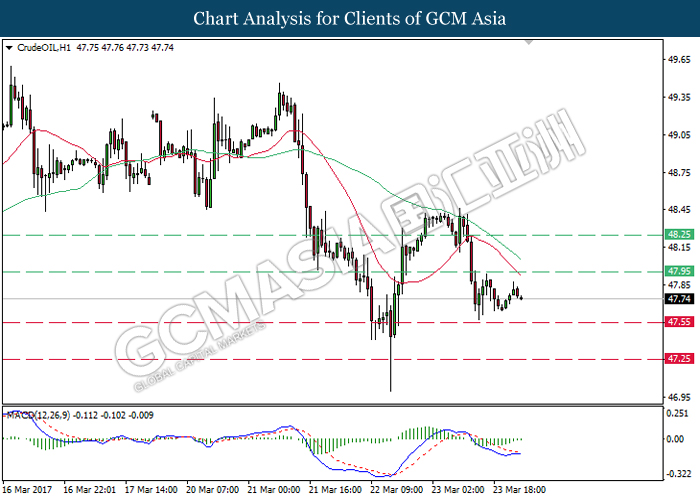
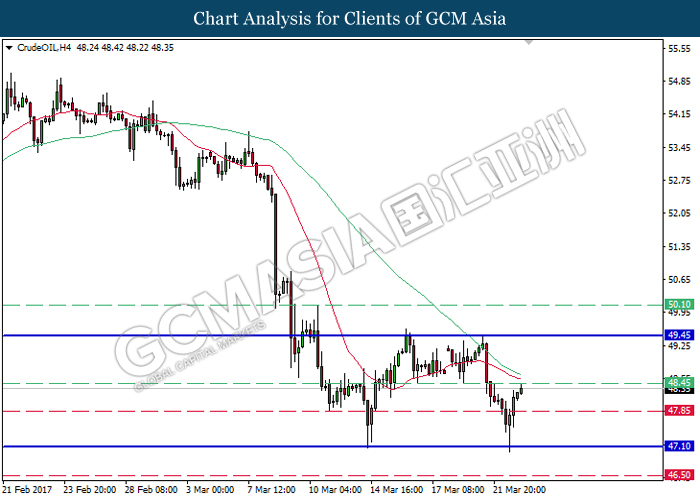
CrudeOIL, H4: Crude oil price was traded in an uptrend following prior formation of golden cross by both moving average line. As both lines continue to expand upwards, it is expected to move further upward towards the target of resistance level at 53.45.
Resistance level: 53.45, 54.10
Support level: 52.75, 52.00
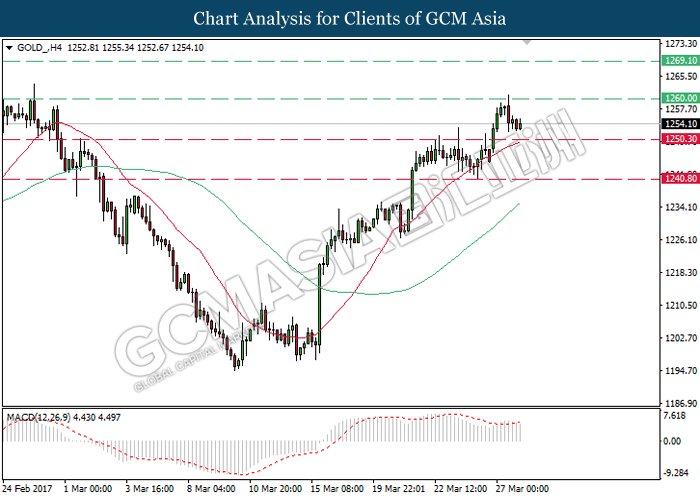
GOLD
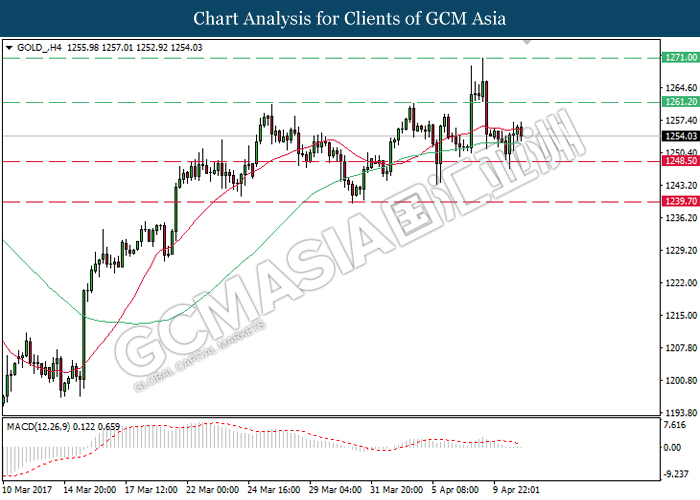
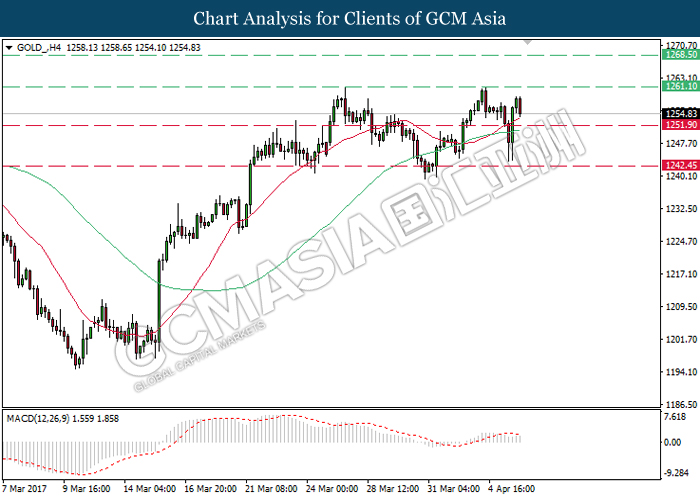
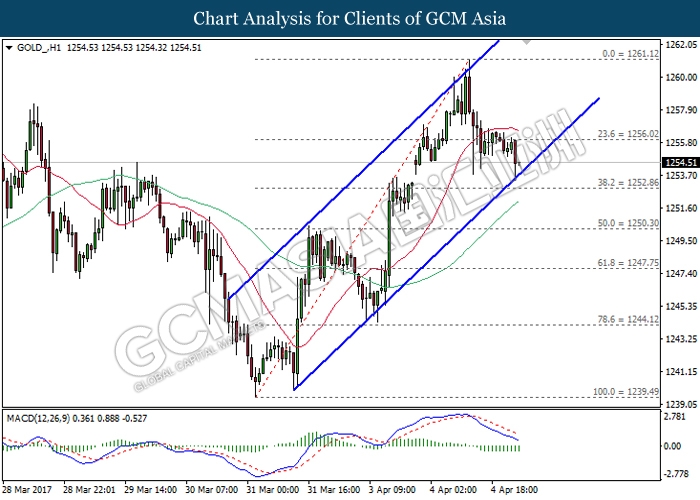
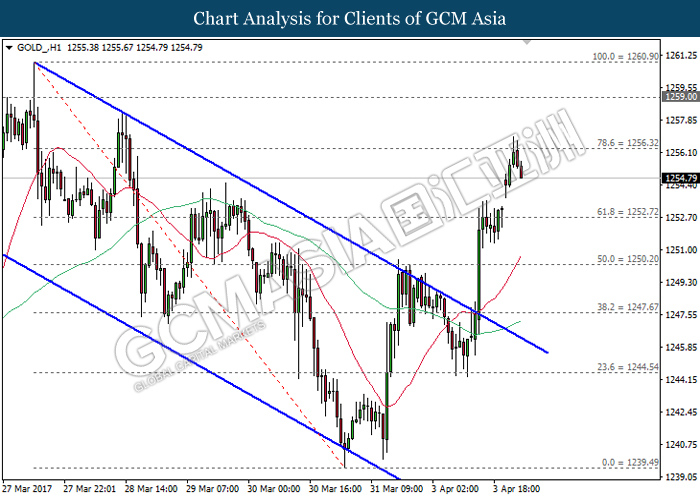
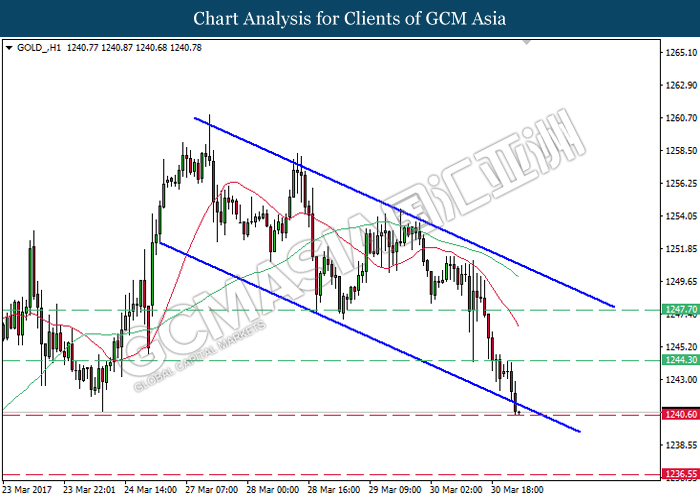
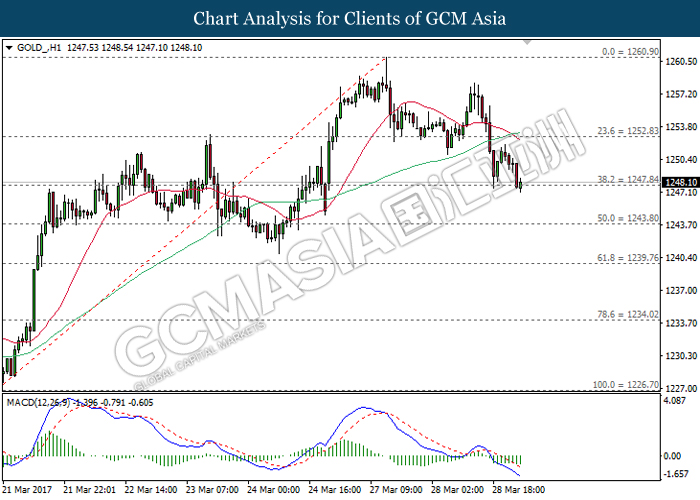
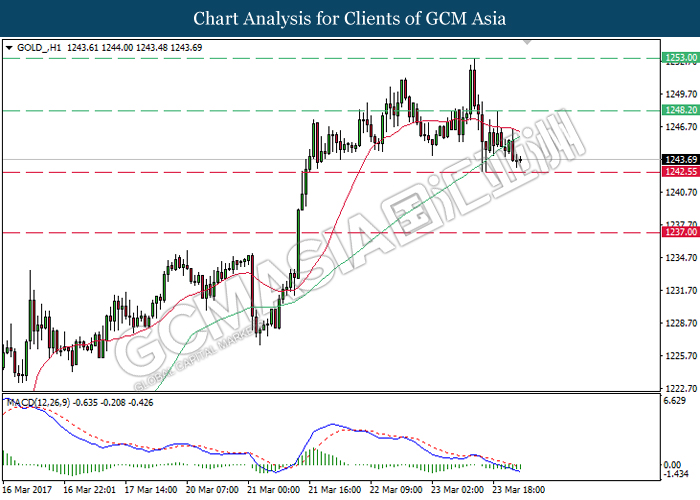
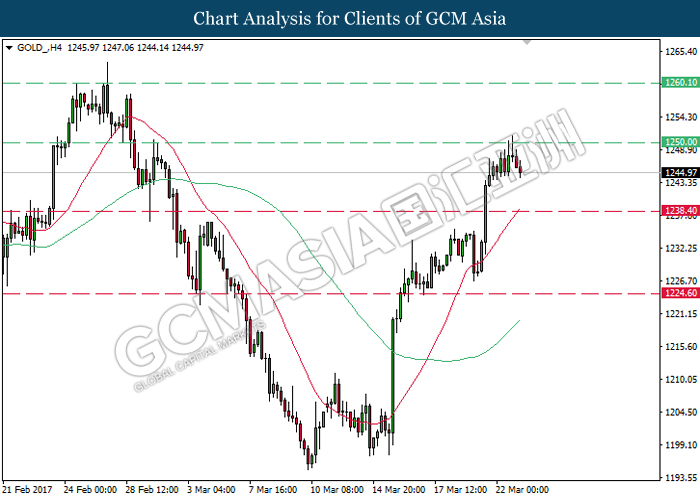
GOLD_, H4: Gold price was traded higher following prior rebound from the support level of 1248.50 while currently testing in between both moving average line. However, as the MACD indicator continues to drift outside of upward momentum, gold price is expected to experience brief retracement period and oscillate in between the range of 1248.50 and 1261.20 for short-term. Otherwise, a closure above the resistance level of 1261.20 would suggest gold price to extend its upward momentum in long-term.
Resistance level: 1261.20, 1271.00
Support level: 1248.50, 1239.70
100417 Weekly Analysis
10 April 2017 Weekly Analysis
GCMAsia Weekly Report: April 10 – 14
Market Review (Forex): April 3 – 7
U.S. Dollar
The greenback rose against a basket of other major peers on Friday, shrugging off lower-than-expected US employment data as investors remained focused on Federal Reserve’s plans to tighten their monetary policy further. The dollar index was up 0.47% to 101.08, its highest level since March 15th. For the week, the dollar has added up 0.90%, it second consecutive weekly gain thus far.
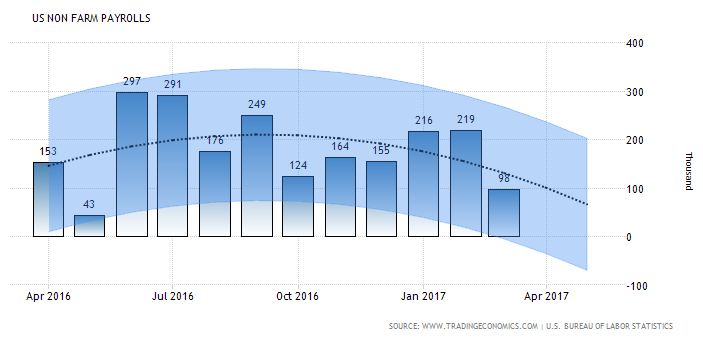
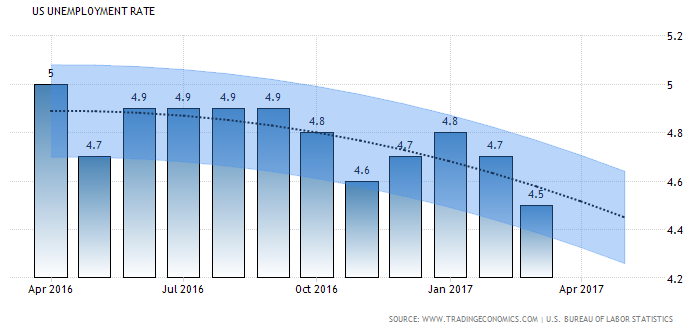
Last Friday, the US Labour Department reported that US economy has added only 98,000 jobs for the month of March, lower than economist forecast for an addition of 180,000 jobs. Lower temperatures and harsh winter storms was accounted for the slowdown in jobs hiring. Concurrently, the unemployment rate has ticked down to a 10-year low of 4.5%, indicating an underlying strength of the labour market.
Initially, a large sell off was initiated following the weaker-than-expected employment reading. However, the dollar has managed to trim its losses after New York Fed President William Dudley said during Friday that the Fed plans to trim the balance sheets later which would prompt only a “little pause” in its rate hike plans.
US Nonfarm Payrolls
—– Forecast
The US economy has added only 98,000 jobs during March, lower than market expectation of 180,000 jobs.
US Unemployment Rate
—–Forecast
US Unemployment rate was down 0.1% and currently stands at 4.5%, its level lowest in a decade.
USD/JPY
The safe haven yen gained initially, underpinned by higher risk aversion due to US cruise missile strikes on a Syrian air base. Otherwise, the pair was up 0.26% to 111.09.
EUR/USD
Euro was lower against the greenback with its pair down 0.50% to $1.0590.
GBP/USD
Great British Pound extended its losses, shedding 0.82% to $1.2366 following an unexpected fall in UK’s industrial output for the month of February.
Market Review (Commodities): April 3 – 7
GOLD
Gold price retreats from five-months high during late Friday as the stronger dollar weighed on the precious metal. Gold for June delivery settled up 0.21% at $1,255.95 after touching daily peak of $1,272.85 earlier. Price of the yellow metal surged after US launched dozens of cruise missiles to several targeted Syrian air bases in the aftermath of a suspected chemical weapon attacks.
However, the precious metal sheds its gains as the dollar rose despite of disappointing US employment data as investors shift their focus to Federal Reserve’s blueprint to tighten monetary policy further this year. In the case of a stronger dollar, gold’s appeal as an alternative asset will depreciate as it makes dollar-priced commodities more expensive for investors who holds other currencies.
Crude Oil
Oil futures settled higher for fourth consecutive session on Friday, extending its rally to its highest level in a month after US fired missiles to several targets at a Syrian government air base. However, oil price paired some gains in the latter session as concerns about a wider escalation in the region faded and US economic data weighed on global financial market. Crude oil price was up 54 cents and ended the week at $52.24 a barrel after touching a high of $52.94. For the week, it has added up $1.64 or 3.1%.
Crude oil price jumped overnight after two US destroyers fired 59 Tomahawk cruise missiles at a Syrian air base, in retaliation to Bashar al-Assad’s alleged use of chemical weapons against its civilians. However, analysts postulate that the initial appreciation was overdone given Syria’s role as a minor oil producers and after US official described the attack as one-off event.
Meanwhile, oil traders continued to focus on ongoing rebound of US shale industry, which would derail efforts by other producers to rebalance the global oil supply and demand. US Baker Hughes reported that the number of active US oil rigs rose by 10, to a total count of 672, its highest since September 2015.
Earlier in the week, US Energy Information Administration reported that US oil inventories rose 1.566 million barrels, sending its total to an all-time high of 535.5 million. It was the 13th weekly build thus far, feeding higher concerns among investors towards the global oversupply glut.
U.S. Baker Hughes Oil Rig Count
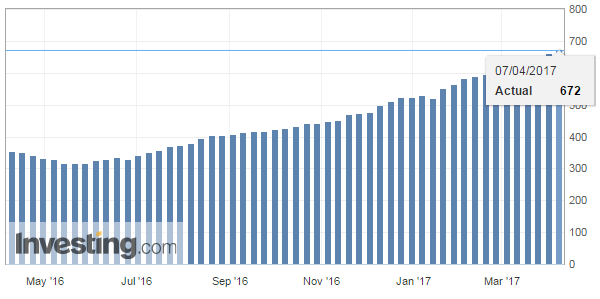
Active oil drilling rig in US has increased by 10 last week to a total of 672.
U.S. Crude Oil Stocks Change
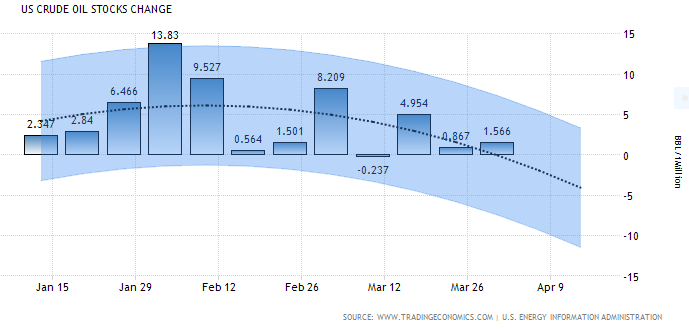
—– Forecast
Energy Information Administration reported unexpected rise in US oil inventories by 1.566 million barrels last week.
Weekly Outlook: April 10 – 14
For the week, investors will be placing their focus on Monday as Fed Chair Janet Yellen bound to deliver her speech for fresh cues on the timing of the next US rate hike and plans to trim back the central bank’s balance sheet. Concurrently, traders would also be looking ahead to US data on retail sales and inflation on Friday, ahead of the long Easter weekend.
As for the oil market, investors will continue to eye on fresh weekly information regarding US stockpiles and active oil rig for further signals from their shale industry. In addition, investors will also anticipate for monthly reports from Organization of Petroleum Exporting Countries and International Energy Agency to gauge the global supply and demand levels.
Highlighted economy data and events for the week: April 10 – 14
| Monday, April 10 |
Data N/A
Events N/A
|
| Tuesday, April 11 |
Data AUD – NAB Business Confidence (Mar) GBP – CPI (YoY) (Mar) EUR – German ZEW Economic Sentiment (Apr) USD – JOLTs Job Openings (Feb) Crude Oil – API Weekly Crude Oil Stock
Events USD – Fed Chair Yellen Speaks
|
| Wednesday, April 12 |
Data CNY – CPI (YoY) (Mar) CNY – PPI (YoY) (Mar) GBP – Average Earnings Index +Bonus (Feb) GBP – Claimant Count Change (Mar) CAD – BoC Interest Rate Decision Crude Oil – Crude Oil Inventories
Events GBP – BoE Gov Carney Speaks Crude Oil – OPEC Monthly Report CAD – BoC Monetary Policy Report CAD – BoC Gov Poloz Speaks
|
| Thursday, April 13 |
Data AUD – Employment Change (Mar) CNY – Trade Balance (USD) (Mar) USD – Initial Jobless Claims USD – PPI (MoM) (Mar) CAD – Manufacturing Sales (MoM) (Feb) CAD – New Housing Price Index (MoM) (Feb) USD – Michigan Consumer Sentiment (Apr) Crude Oil – U.S. Baker Hughes Oil Rig Count
Events Crude Oil – IEA Monthly Report
|
|
Friday, April 14
|
Data USD – Core CPI (MoM) (Mar) USD – Core Retail Sales (MoM) (Mar) USD – Retail Sales (MoM) (Mar)
Events N/A
|
Technical weekly outlook: April 10 – 14
Dollar Index
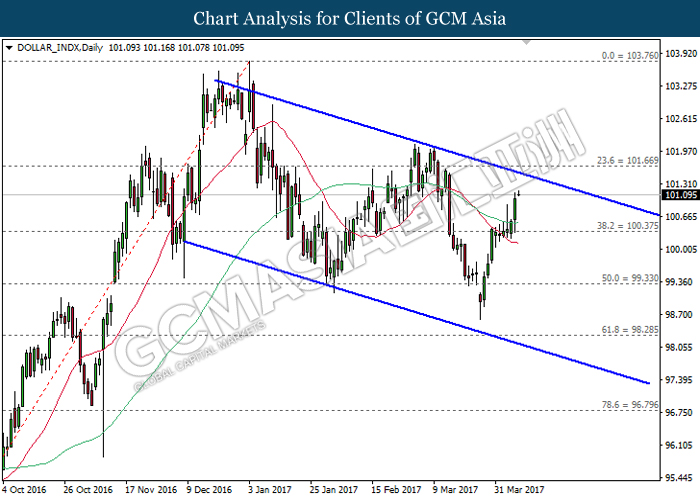
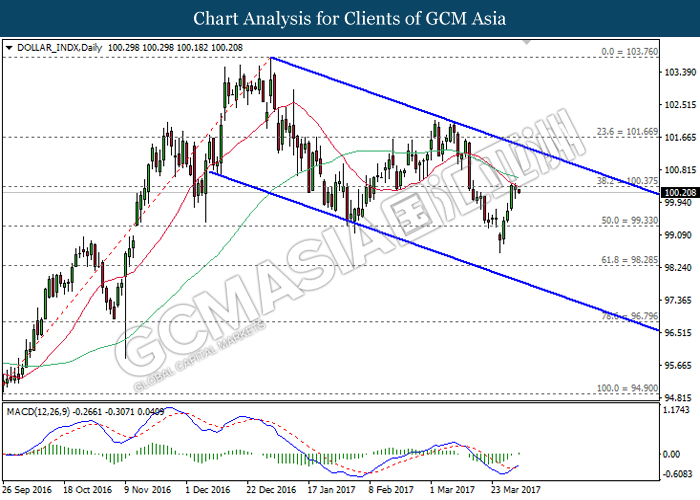
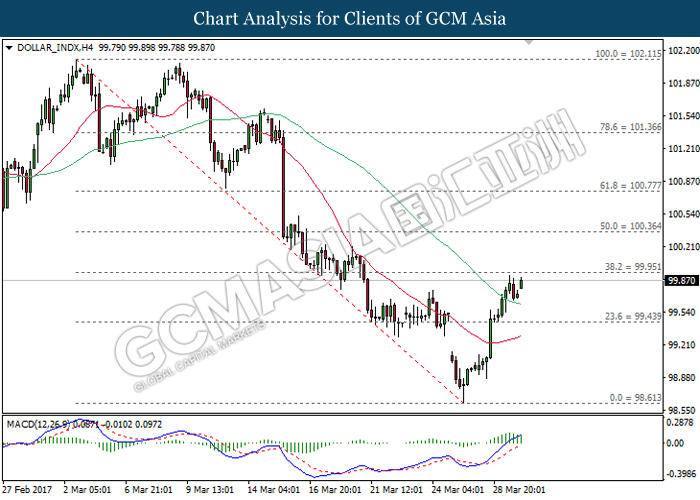
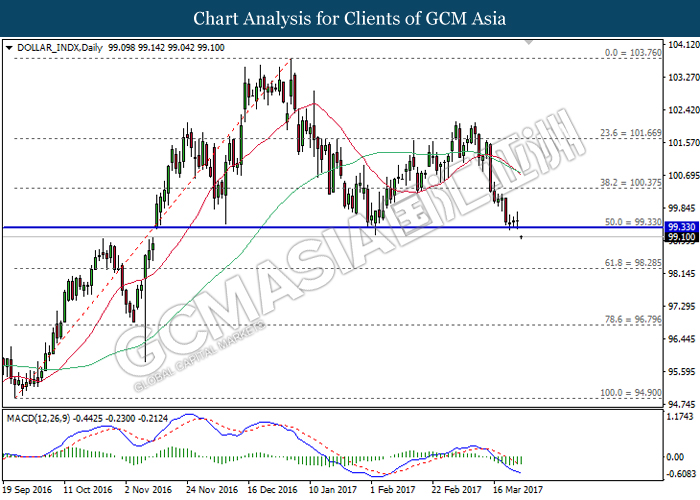
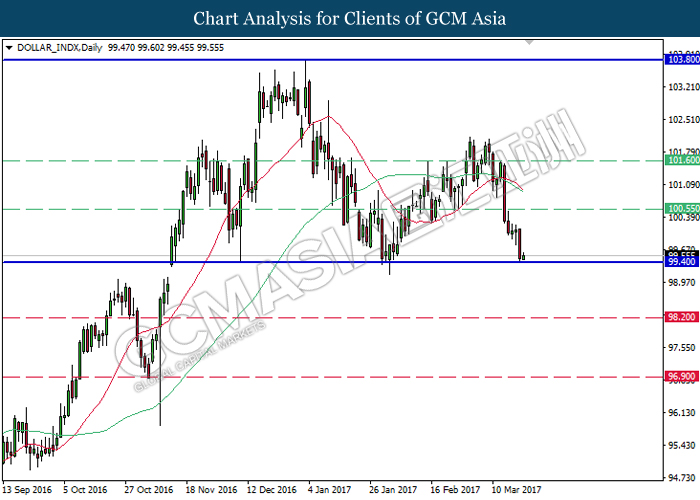
DOLLAR_INDX, Daily: The dollar index extended its gains following prior rebound from the support level of 100.40. It is expected to advance further upwards and retest near the top level of the downward channel. A breakout from this level would signal a change in trend direction to move further upwards thereafter.
Resistance level: 101.65, 103.75
Support level: 100.40, 99.35
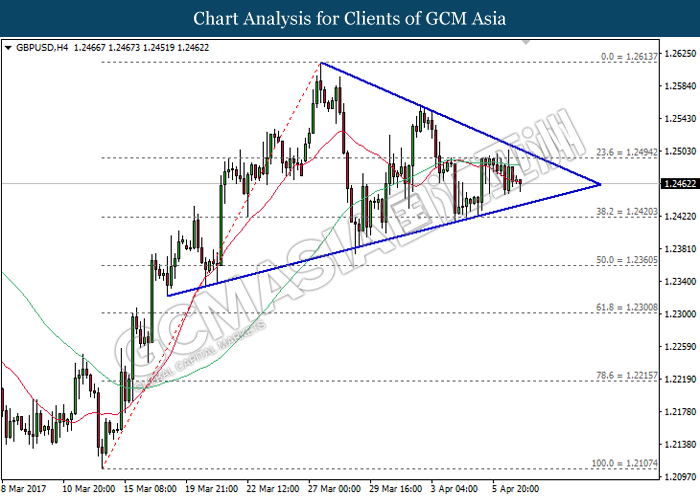
GBPUSD
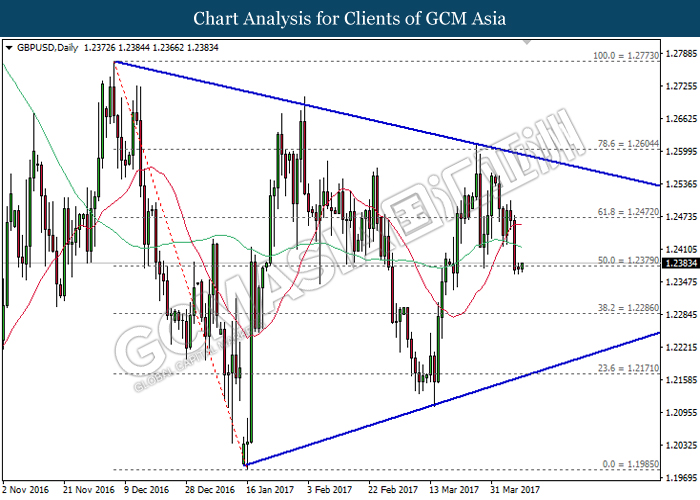
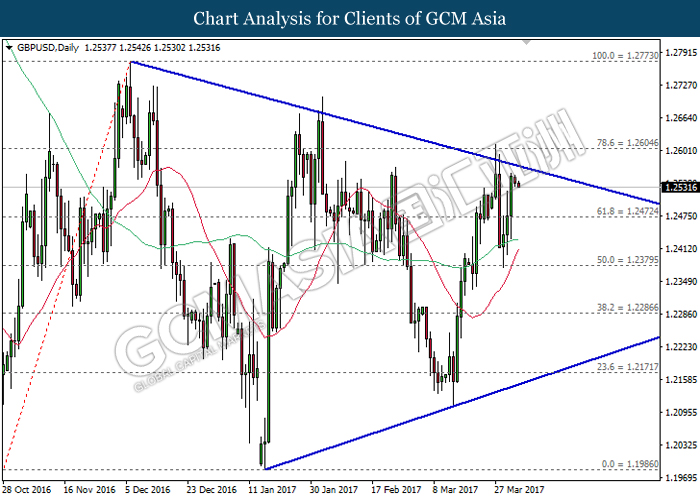
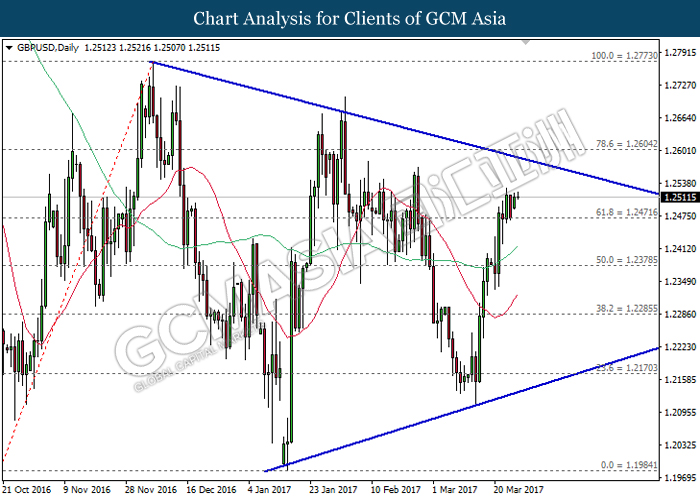
GBPUSD, Daily: GBPUSD remains traded within a narrowing triangle following prior retracement and closure below both moving average line while currently testing near the resistance level of 1.2380. A retrace from this level would suggest GBPUSD to advance further down, towards the lower level of the triangle.
Resistance level: 1.2380, 1.2470
Support level: 1.2285, 1.2170
USDJPY
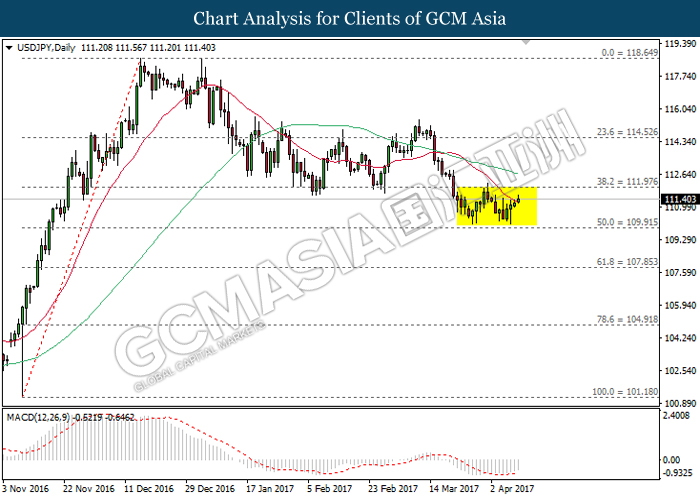
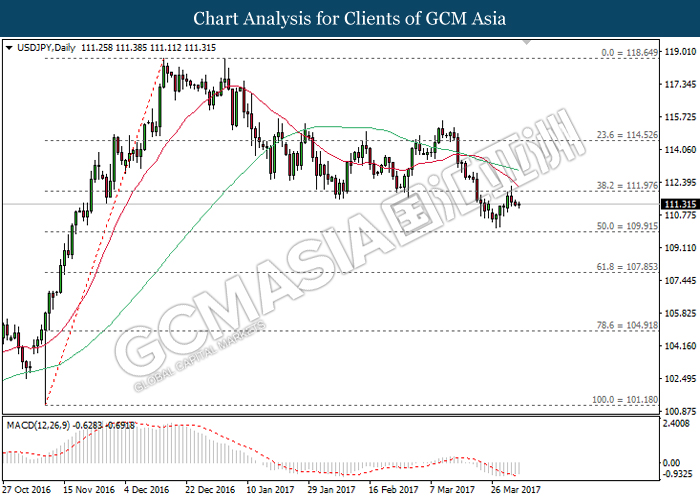
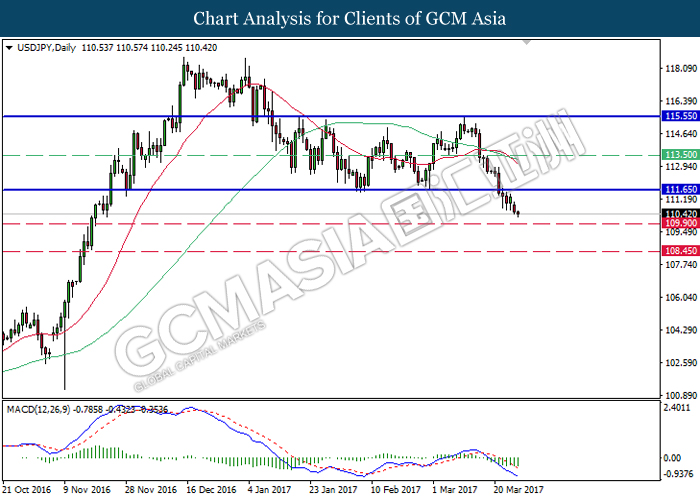
USDJPY, Daily: USDJPY remains traded within a trading range following prior rebound near the support level of 109.90. With regards to the MACD indicator which continues to drift outside of downward momentum, USDJPY is expected to extend its retracement period in the short-term. Long-term trend direction could only be determined after a successful breakout from either side of the range.
Resistance level: 112.00, 114.50
Support level: 109.90, 107.85
EURUSD
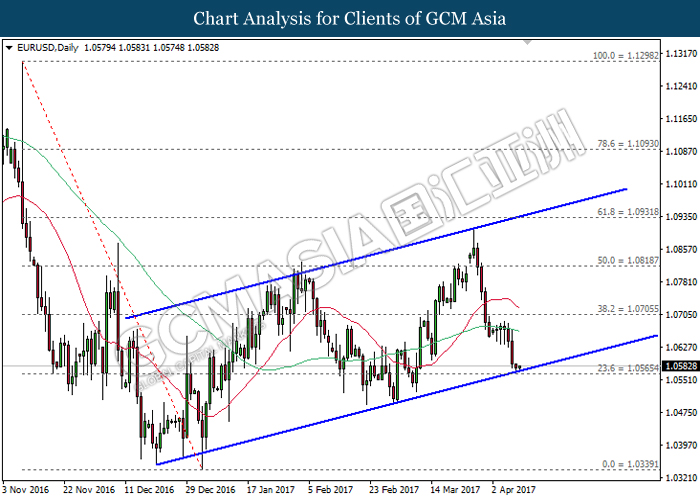
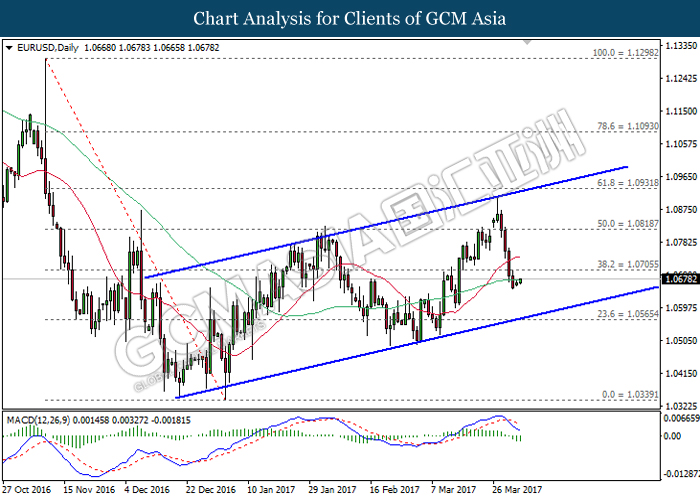
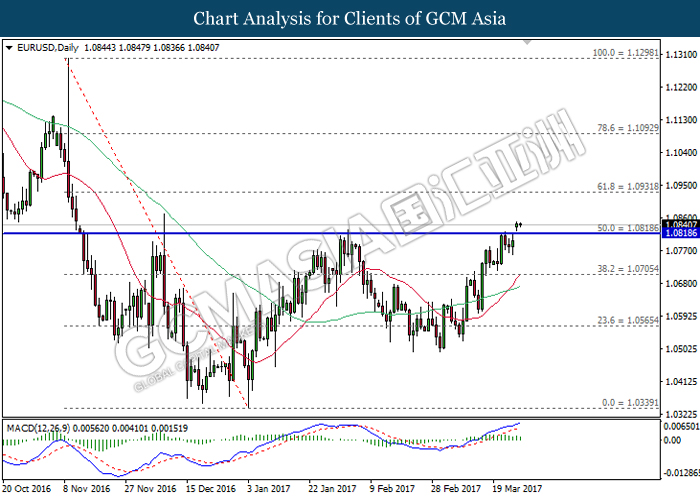
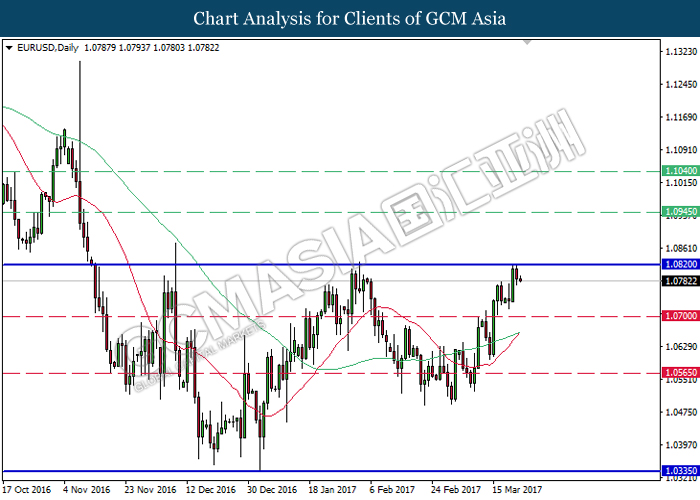
EURUSD, Daily: EURUSD remains traded within an upward channel while currently testing at the bottom level of the channel, near the support level of 1.0565. A breakout from this level would signal a change in trend direction to move further downwards thereafter. Otherwise, a rebound from this level would suggest EURUSD to be traded higher within the upward channel in short-term.
Resistance level: 1.0705, 1.0820
Support level: 1.0565, 1.0340
GOLD
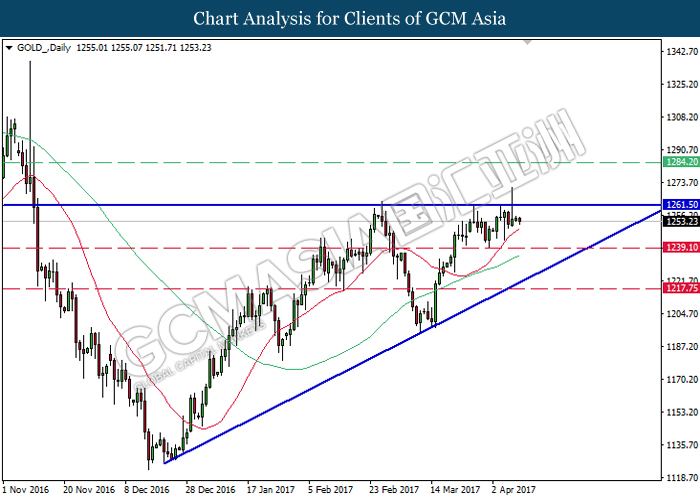
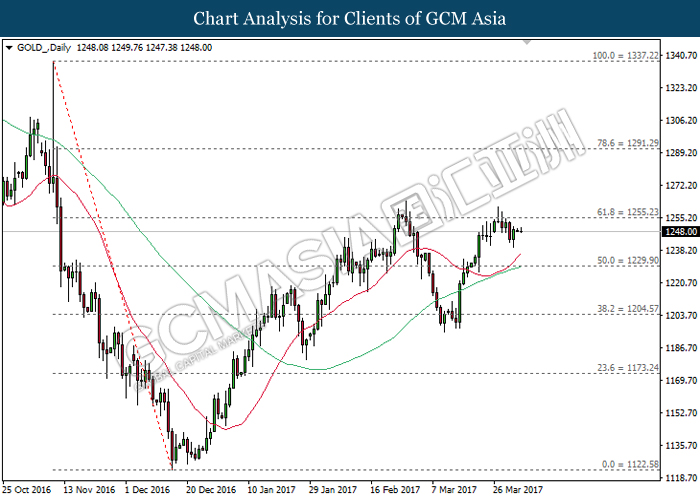
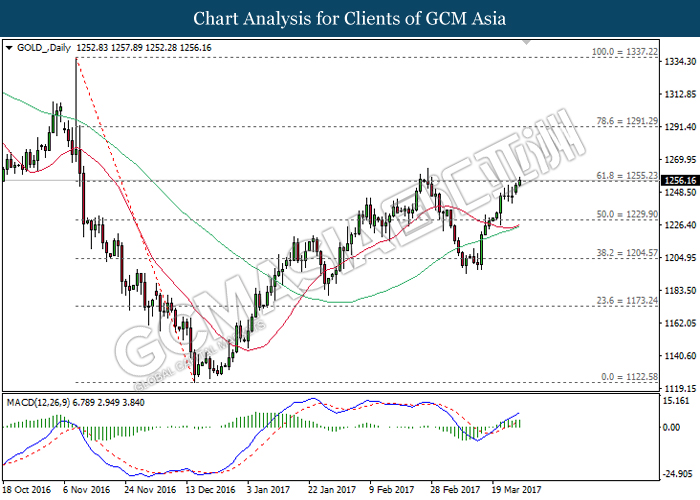
GOLD_, Daily: Gold price was traded within an ascending triangle following prior retracement from the strong resistance level of 1261.50. Referring to both moving average line which continues to expand further upwards, gold price is suggested to advance further up and retest near the resistance level of 1261.50. A breakout from the top level of ascending triangle would signal a change in trend direction to move further upwards thereafter.
Resistance level: 1261.50, 1284.20
Support level: 1239.10, 1217.75
Crude Oil
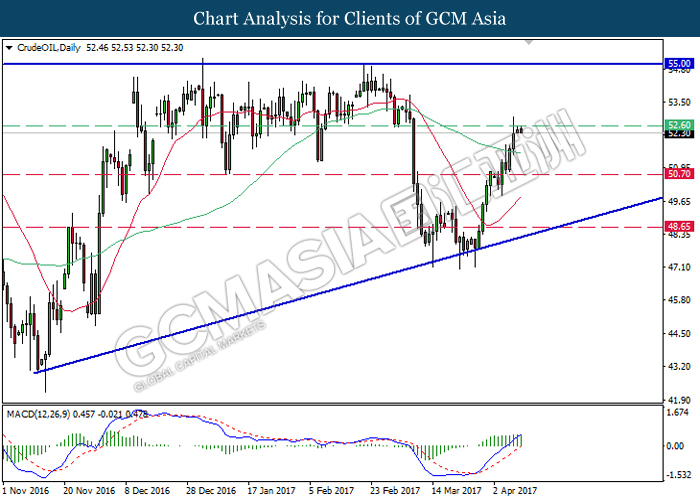
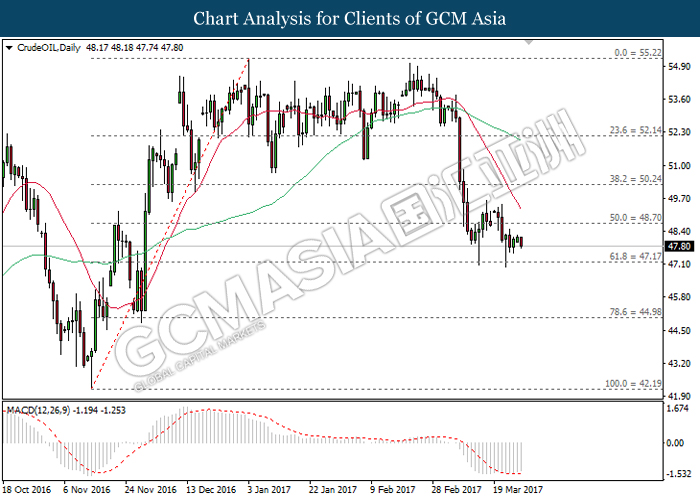
CrudeOIL, Daily: Crude oil price remains traded within an ascending triangle following prior rebound from the bottom level of the triangle. With regards to the MACD histogram which continues to illustrate moderate upward signal and momentum, crude oil price is expected to extend its upward momentum after a successful closure above the resistance level of 52.60.
Resistance level: 52.60, 55.00
Support level: 50.70, 48.65
070417 Daily Analysis
7 April 2017 Daily Analysis
US launches missiles, investors scavenge safe-haven.
Greenback edges lower during Asian trading hours following news report of US missile strikes in Syria which boosted the demand for traditional safe haven assets such as gold and Japanese yen. The dollar index was down 0.11% and was last quoted at 100.48. US President Donald Trump addresses that the strike on Syria is vital national security interests of the United States in order to prevent the spread and use of chemical weapons. Market participants remain cautious today as they await the outcome of talks between US and China president, which would be focusing on trade deals and North Korea’s nuclear programs. “I think the dollar will move flatly today ahead of US jobs data as the situation with North Korea and Syria contributes to higher risk-off sentiment,” said Masashi Murata, senior currency strategist in Tokyo. Later in the evenings, US will release the highly anticipated Nonfarm Payrolls report which is expected to show an addition of 180,000 jobs during March, while a positive reading could reinforce overall expectation towards Federal Reserve who will be delivering two more rate hikes this year.
Glancing through the commodities, crude oil price settled higher amid higher expectation for OPEC-led cut to be extended beyond June, offsetting bearish US inventories data. Otherwise, gold price was up 0.79% to $1,260.20 following reports of US launching dozens of missiles against various targets near the Syrian airfield.
Today’s Holiday Market Close
Time Market Event
N/A
Today’s Highlight Events
Time Market Event
17:00 GBP BoE Gov Carney Speaks
22:00 CAD BoC Gov Poloz Speaks
Today’s Highlight Economy Data
| Time | Nation & Data | Previous | Forecast | Actual |
| 15:30 | GBP – Halifax House Price Index (MoM) (Mar) | 0.1% | 0.3% | – |
| 16:30 | GBP – Manufacturing Production (MoM) (Feb) | -0.9% | 0.3% | – |
| 16:30 | GBP – Trade Balance (Feb) | -10.83B | 10.90B | – |
| 20:30 | USD – Nonfarm Payrolls (Mar) | 235K | 180K | – |
| 20:30 | USD – Unemployment Rate (Mar) | 4.7% | 4.7% | – |
| 20:30 | CAD – Employment Change (Mar) | 15.3K | 5.0K | – |
| 22:00 | CAD – Ivey PMI (Mar) | 55.0 | 56.3 | – |
| 01:00 | Crude Oil – US Baker Hughes Oil Rig Count | 662 | – | – |
GBPUSD
GBPUSD, H4: GBPUSD was traded lower following prior retrace from the resistance level of 1.2495 while currently trading near the 20-moving average line (red). A successful closure below this line would suggest GBPUSD to advance further down, towards the lower level of the narrowing triangle.
Resistance level: 1.2495, 1.2615
Support level: 1.2420, 1.2360
EURUSD
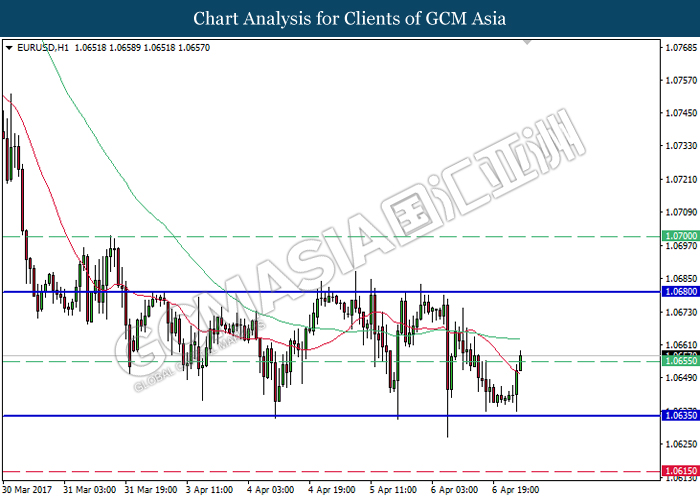
EURUSD, H1: EURUSD remains traded within the sideways channel following prior rebound from the bottom level of the channel. It is expected to be traded higher in short-term, towards the upper level of the channel after breaking the resistance level of 1.0655. Otherwise, long-term trend direction could only be determined following a successful breakout from either side of the channel.
Resistance level: 1.0655, 1.0680, 1.0700
Support level: 1.0635, 1.0615
USDJPY
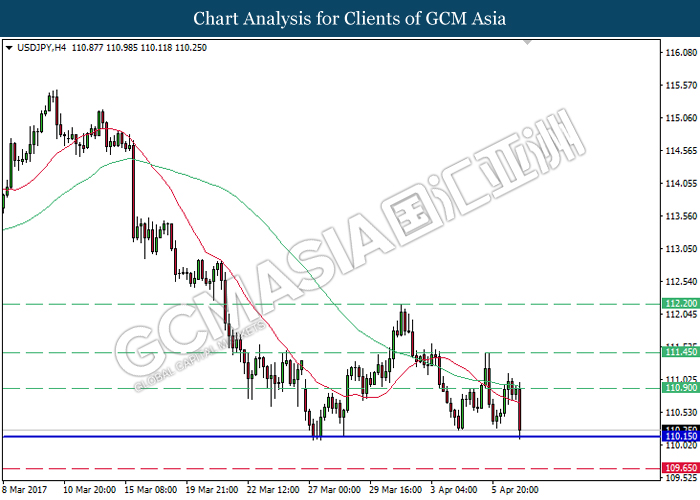
USDJPY, H4: USDJPY was traded lower following prior retracement from the resistance level of 110.90 while currently testing near the strong support level of 110.15. A successful closure below this level would suggest USDJPY to extend its downward momentum towards the subsequent target of support level at 109.65.
Resistance level: 110.90, 111.45, 112.20
Support level: 110.15, 109.65
CrudeOIL
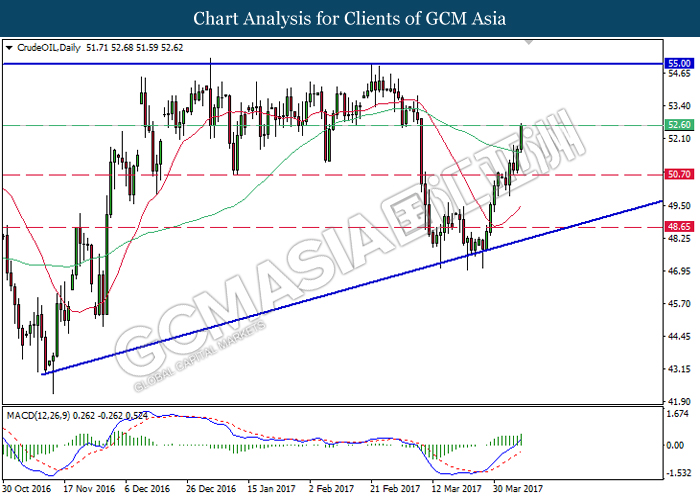
CrudeOIL, Daily: Crude oil price remains traded within an ascending triangle following prior rebound from the bottom level of the triangle. Currently, as the MACD histogram continues to illustrate upward signal and momentum while coupled within recent closure above the 60-moving average line (green), crude oil price is expected to extend its upward momentum after breaking the resistance level of 52.60.
Resistance level: 52.60, 55.00
Support level: 50.70, 48.65
GOLD
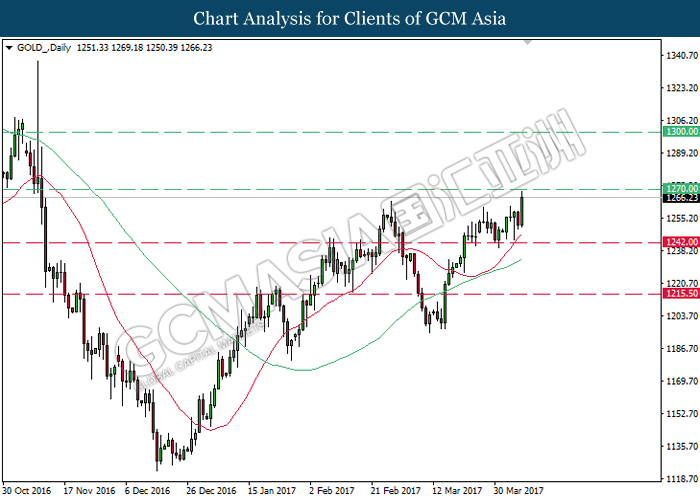
GOLD_, Daily: Gold price was traded higher following prior rebound from the support level of 1242.00. With regards to both moving average line which continues to expand further upwards, gold price is expected to extend its upward momentum after breaking the resistance level of 1270.00.
Resistance level: 1270.00, 1300.00
Support level: 1242.00, 1215.50
060417 Daily Analysis
6 April 2017 Daily Analysis
US-China summit in view, dollar sags.
US dollar took a step back during Asian trading session, broadly pressured by cautious investors ahead of impending US-China summit and heightened geopolitical risks. The dollar index shed 0.11% and was last quoted at 100.45. Overnight’s minute from March Federal Reserve meeting showed that the outlook was little changed since January while commented that with further strengthening of labor market and progress towards inflation target suggests that rate hikes would likely incline with prior forecast of three times this year. However, FOMC members were undetermined whether stronger inflation would warrant a faster pace of rate hike now or hiking it at a more gradual pace, given the persistence low inflation reading in the past. Against other major currencies, greenback was down 0.30% to 110.39 yen while euro added 0.20% to $1.0681.
As for commodities, crude oil price dipped following a surprise swell in US inventories by 1.566 million barrels, off-skid from economist’s estimate for a draw of 0.435 million barrels. Concurrently, gold price rose 0.77% to $1,254.94 buoyed by overnight’s FOMC meeting minutes.
Today’s Holiday Market Close
Time Market Event
N/A
Today’s Highlight Events
Time Market Event
15:00 EUR ECB President Draghi Speaks
19:30 EUR ECB Publishes Account of Monetary Policy Meeting
Today’s Highlight Economy Data
| Time | Nation & Data | Previous | Forecast | Actual |
| 14:00 | EUR – German Factory Orders (MoM) (Feb) | -7.4% | 4.0% | – |
| 20:30 | USD – Initial Jobless Claims | 258K | 250K | – |
| 20:30 | CAD – Building Permits (MoM) (Feb) | 5.4% | – | – |
GBPUSD
GBPUSD, H4: GBPUSD remains traded within a narrowing triangle while currently testing near the resistance level of 1.2495. A breakthrough from this level would suggest GBPUSD to advance further up, towards the upper level of the triangle. Otherwise, a retracement would suggest GBPUSD to be traded lower in short-term thereafter within the triangle.
Resistance level: 1.2495, 1.2615
Support level: 1.2420, 1.2360
EURUSD
EURUSD, H1: EURUSD remains traded within a sideways channel while currently testing at the top level of the channel, near the resistance level of 1.0680. A breakout from this level would signal a change in trend direction to move further upwards thereafter. Otherwise, a retrace from this level would suggest EURUSD to be traded lower in the short-term thereafter.
Resistance level: 1.0680, 1.0700
Support level: 1.0655, 1.0635, 1.0615
USDJPY
USDJPY, H1: USDJPY was traded higher following prior rebound from the strong support level of 110.25. With regards to the MACD indicator which remains hovered outside of downward momentum, USDJPY is suggested to experience brief retracement period and may be traded higher in the short-term. Otherwise, long-term trend direction suggests USDJPY to advance further down and retest near the level of 110.25.
Resistance level: 110.70, 111.00
Support level: 110.25, 110.10
CrudeOIL
CrudeOIL, H1: Crude oil price was traded higher following prior rebound from the support level near 50.75. Referring to the MACD indicator which continues to hover outside of downward momentum suggests crude oil price to be traded higher in the short-term as technical correction. Otherwise, long-term trend direction would suggest crude oil price to extend its downward momentum.
Resistance level: 51.30, 51.85
Support level: 50.75, 50.00
GOLD
GOLD_, H4: Gold price was traded higher following prior rebound from the strong support level near 1242.45. However, as the MACD indicator begins to hover outside of upward momentum, gold price is expected to be traded lower in short-term as brief retracement period. Otherwise, long-term trend direction suggests gold price to advance further upwards and retest near the strong resistance level of 1261.10.
Resistance level: 1261.10, 1268.50
Support level: 1251.90, 1242.45
050417 Daily Analysis
5 April 2017 Daily Analysis
Yen appreciates amid North Korea missile launch.
US dollars was a tad lower during Asian trading hours as a round of risk aversion rippled through the market while Japanese Yen remained as the star player as it gained further when compared to other major peers. The recent launch of ballistic missile by North Korea fueled higher demand for safe haven Yen, ahead of a summit between US and Chinese leaders tomorrow. Ongoing concerns over the upcoming summit has capped the dollar’s upside due to ongoing speculation that US President Donald Trump may face challenges in implementing his policies in wake of his administration’s failure to pass healthcare reform bill. The dollar index was down 0.04% and last quoted at 100.31. Meanwhile, pound sterling seesawed while last seen around $1.2441 against the greenback, pressured by a slowdown in UK construction growth which has catalyzed more pessimism on top of ongoing Brexit conundrum.
Taking a look in the commodities market, crude oil price rose in Asia while extending overnight gains after industrial estimates reported a larger-than-expected draw in US crude inventories. On the other hand, gold price dipped slightly as investors seize the opportunity to cash in their profit after its price touches one-week high yesterday.
Today’s Holiday Market Close
Time Market Event
N/A
Today’s Highlight Events
Time Market Event
02:00 USD FOMC Meeting Minutes
Today’s Highlight Economy Data
| Time | Nation & Data | Previous | Forecast | Actual |
| 16:30 | GBP – Services PMI (Mar) | 53.3 | 53.5 | – |
| 20:15 | USD – ADP Nonfarm Employment Change (Mar) | 298K | 187K | – |
| 22:00 | USD – ISM Non-Manufacturing PMI (Mar) | 57.6 | 57.0 | – |
| 22:30 | Crude Oil – Crude Oil Inventories | 0.867M | -0.435M | – |
GBPUSD
GBPUSD, H1: GBPUSD was traded higher following previous rebound and closure above the 20-moving average line (red). With regards to the MACD histogram which illustrates upward signal and momentum, a closure above the resistance level of 1.2445 would suggest GBPUSD to advance further upwards.
Resistance level: 1.2445, 1.2465
Support level: 1.2415, 1.2375
EURUSD
EURUSD, H4: EURUSD was traded higher following prior rebound from the support level of 1.0650 while closing above the 20-moving average line (red). Referring to the MACD histogram which illustrates an upward signal and momentum, EURUSD is expected to advance further up towards the target of resistance level at 1.0700.
Resistance level: 1.0700, 1.0750
Support level: 1.0650, 1.0580
USDJPY
USDJPY, H4: USDJPY was traded higher following prior rebound before the support level of 110.10. With regards to the downward signal from MACD histogram which continues to narrow upwards, USDJPY may experience brief technical correction and suggested to be traded higher in short-term. Otherwise, long-term trend direction suggests USDJPY to move further downwards as both MA lines continue to narrow down.
Resistance level: 111.35, 112.15
Support level: 110.10, 109.40
CrudeOIL
CrudeOIL, H4: Crude oil price was traded higher following prior rebound while closing above the 20-moving average line (red). Referring to the MACD histogram which begins to illustrate upward signal, a closure above the resistance level of 51.20 would suggest crude oil price to extend its upward momentum.
Resistance level: 51.20, 52.35
Support level: 50.40, 49.60
GOLD
GOLD_, H1: Gold price remains traded within an upward channel while currently testing near the bottom level of the channel. A breakout from this level would signal gold price to experience a change in trend direction to move further downwards. Otherwise, a rebound would suggest gold price to be traded higher in short-term within the upward channel.
Resistance level: 1256.00, 1261.10
Support level: 1252.85, 1250.30
040417 Daily Analysis
4 April 2017 Daily Analysis
Risk appetite subsides, major events in limelight.
Greenback was a tad lower against its major peers as investors awaits Australia’s central bank monetary decision. The dollar index shed 0.09% and was last quoted at 100.28. Investors’ risk appetite was subdued ahead of an upcoming meeting between US President Donald Trump and Chinese President Xi Jinping while Friday’s highly anticipated Nonfarm Payrolls report remains in play. Concurrently, Reserve Bank of Australia will review their monetary policy at noon and economists expect the benchmark rate to keep on hold at a record low of 1.50%. The central bank is deemed to have less urgency in easing their policy further given the concerns over affecting the household balance sheets while remained optimistic towards the global economy. Likewise, the Australian dollar was down 0.20% to $0.7591 against the US dollar.
Looking into the commodities, crude oil price was up slightly while latest figure on US inventories due tomorrow morning is expected to set the market tone. On the other hand, gold price was up 0.46% to $1,256.52, buoyed by metro explosion incident at St Petersburg, Russia.
Today’s Holiday Market Close
Time Market Event
All Day HKD Hong Kong – Ching Ming Festival
All Day CNY China – Tomb Sweeping Day
Today’s Highlight Events
Time Market Event
12:30 AUD RBA Rate Statement
21:30 EUR ECB President Draghi Speaks
Today’s Highlight Economy Data
| Time | Nation & Data | Previous | Forecast | Actual |
| 06:00 | NZD – NZIER Business Confidence (Q1) | 28% | – | 17% |
| 12:30 | AUD – RBA Interest Rate Decision (Apr) | 1.50% | 1.50% | – |
| 16:30 | GBP – Construction PMI (Mar) | 52.5 | 52.4 | – |
| 20:30 | USD – Trade Balance (Feb) | -48.50B | -44.80B | – |
| 20:30 | CAD – Trade Balance (Feb) | 0.81B | 0.50B | – |
| 04:30 | Crude Oil – API Weekly Crude Oil Stock | 1.900M | – | – |
GBPUSD
GBPUSD, H1: GBPUSD remains traded within the upward channel while currently testing at the bottom level of the channel. A breakout from this level would signal a change in trend direction to move further downwards thereafter. Otherwise, a rebound from this level would suggest GBPUSD to be traded higher in the short-term.
Resistance level: 1.2495, 1.2520
Support level: 1.2465, 1.2430
EURUSD
EURUSD, H4: EURUSD was traded higher following a rebound from the strong support level of 1.0650. With regards to the MACD indicator which begins to hover outside of downward momentum, EURUSD is expected to experience brief retracement period and may be traded higher in the short-term. Otherwise, long-term trend direction still suggests EURUSD to extend its downward momentum.
Resistance level: 1.0700, 1.0780
Support level: 1.0650, 1.0580
AUDUSD
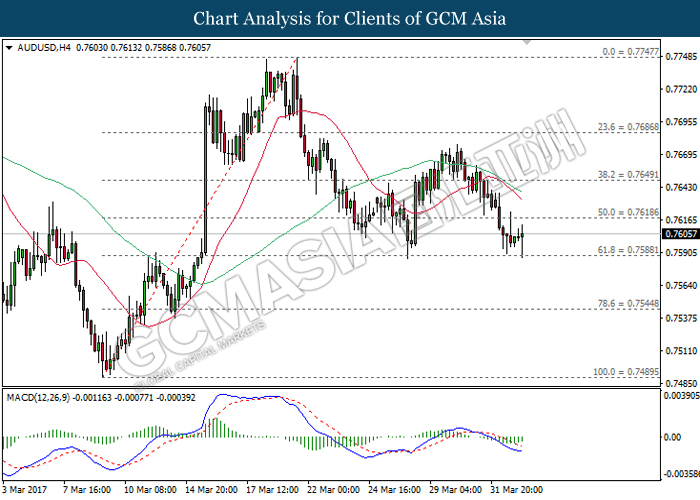
AUDUSD, H4: AUDUSD was traded higher following a rebound from the strong support level of 0.7590. Referring to the downward signal line from MACD histogram which begins to narrow sideways, AUDUSD may be traded higher in the short-term as technical correction. Otherwise, the downward expansion of both MA lines suggests AUDUSD to extend its downward momentum.
Resistance level: 0.7620, 0.7650
Support level: 0.7590, 0.7545
USDJPY
USDJPY, H1: USDJPY was traded lower following the downward expansion of both MA lines after the formation of death cross. As the MACD histogram continues to illustrate moderate downward signal and momentum, a successful closure below the support level of 110.55 would suggest USDJPY to extend its current downtrend.
Resistance level: 110.90, 111.15
Support level: 110.55, 110.10
CrudeOIL
CrudeOIL, H4: Crude oil price was traded lower following a retracement while currently testing near the 20-moving average line (red). Referring to the MACD histogram which begins to illustrate downward signal and momentum, a closure below this line would suggest crude oil price to advance towards the target of support level at 49.60.
Resistance level: 50.40, 51.20
Support level: 49.60, 48.60
GOLD
GOLD_, H1: Previously, gold price broke out from the top level of downward channel, signifying a change in trend direction to move further upwards. However, recent retracement from previous high of 1256.30 suggests gold price to experience brief technical correction and may be traded lower in the short-term. Otherwise, the upward expansion of both MA line after the formation of golden cross suggests gold price to extend its uptrend.
Resistance level: 1256.30, 1259.00
Support level: 1252.70, 1250.20
030417 Weekly Analysis
3 April 2017 Weekly Analysis
GCMAsia weekly report: April 3 – 7
Market Review (Forex): March 27 – 31
U.S. Dollar
The greenback ended flat against a basket of other major currencies last Friday as dovish remarks from a Federal Reserve official weighs along with lacklustre US economic data. The dollar index was unchanged at 100.22 during late Friday trading. Otherwise, the index has added 0.78% for the week, snapping off three weeks of consecutive losses. For the month of March, the index has shed 0.9% and was down almost 3% for the first quarter as growing doubts looms over Trump administration’s ability to spur higher economic growth in the US with his economic proposals and allowing the Fed to tighten their policy more aggressively.
Pessimistic sentiment surrounds the greenback after New York Fed President William Dudley postulate on last Friday that the central bank was in no rush to tighten their monetary policy more rapidly. The remarks came after report showing that US personal spending ticked up only 0.1% last month, indicating that the Fed will likely to adhere to its cautious outlook in hiking their interest rates.
US Personal Spending
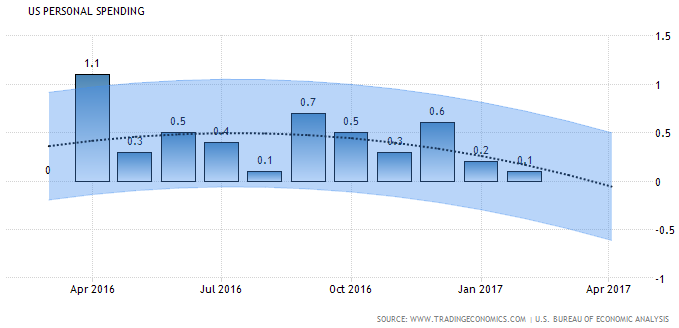
—– Forecast
US personal spending reading came in at only 0.1%, missed economist expectation of 0.2%.
USD/JPY
Pair of USD/JPY was down 0.47% to 111.39, while shedding 1.2% for the month.
EUR/USD
Euro was slightly weaker with EUR/USD down 0.2% to $1.0655, its lowest level since March 15th. The single currency ended the week with 1.7% lower as investors expectation towards European Central Bank’s move to tighten their monetary policy begins to subside due to lacklustre regional data.
GBP/USD
Great British Pound added up 0.65% and ended the week at $1.2550.
Market Review (Commodities): March 27 – 31
GOLD
Gold prices retraced some losses on Friday after a Federal Reserve official said that the central bank was in no rush to tighten their monetary policy this year. Gold price for April delivery was up 0.19% to $1,247.40. Price of the yellow metal has ended the quarter with a gain of almost 8.5%, boosted by a weaker dollar and growing doubts over Trump administration’s ability to spur higher economic growth in the United States that would allow the Feds to tighten their monetary policy more rapidly.
Crude Oil
Oil futures settled higher for the fourth session in a row on last Friday, extending its rally to the strongest level in more than three weeks due to higher optimism towards OPEC in extending its production-cut deal beyond first half of the year. Crude oil price was up 25 cents while ended at $50.60 per barrel during late Friday trading while ended the week with $2.63 or 5.2% of gains. Sentiment in the oil market was improved during last week in wake of an increasingly supportive rhetoric from a number of OPEC nations willingness to extend OPEC’s production cuts into the second half of the year. A joint committee of ministers from OPEC and non-OPEC oil producers will meet in late April to present its recommendation on the fate of the pact while the final decision will be taken by May 25th.
In the United States, oilfield services provider Baker Hughes reported that the number of active oil drilling rigs rose by 10 last week, marking its increase for 11th week while bringing the total count to its highest since September 2015 with 662. Concurrently, the US Energy Information Administration reported that US crude oil inventories rose 867,000 barrels last week, sending its total to an all-time high of 534.0 million thus far. Such reading has fuelled more concerns for an ongoing global glut as the US has reported for a swell in their inventories for 12 consecutive weeks.
U.S. Baker Hughes Oil Rig Count
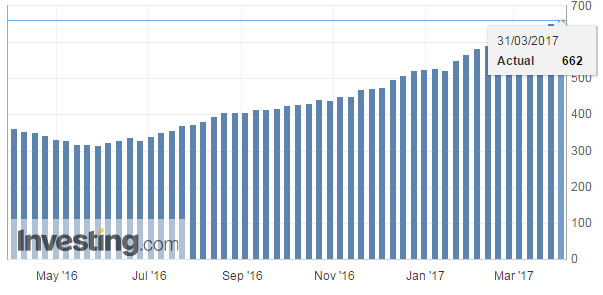
Oilfield services provider Baker Hughes reported that U.S. active oil rig count increased by 10 to 662 last week.
U.S. Crude Oil Stocks Change
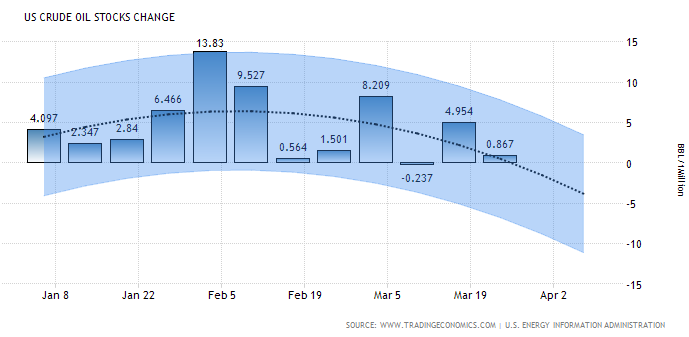
—– Forecast
Energy Information Administration reported a swell in crude inventories by 867,000 barrels last week, sending total inventories to a record high of 534.0 million barrels.
Weekly Outlook: April 3 – 7
For the week, investors will be looking into Wednesday’s Fed meeting minute for new indication of the timing for next US interest rate hike ahead of Friday’s highly anticipated Nonfarm Payrolls report. Otherwise, investors will also be eying on UK’s private sector activity amid ongoing concerns over the economic impact of Brexit.
As for oil traders, they will eye on fresh weekly information on US stockpiles of crude which will be released on Wednesday for further indication of demand from world’s largest oil consumer. Otherwise, they will also pay close attention to comments from global oil producers for further evidence of their compliance to reduce output this year.
Highlighted economy data and events for the week: April 3 – 7
| Monday, April 3 |
Data JPY – Tankan Large Manufacturers Index (Q1) JPY – Tankan Large Non-Manufacturers Diffusion Index (Q1) AUD – Retail Sales (MoM) (Feb) EUR – German Manufacturing PMI (Mar) GBP – Manufacturing PMI (Mar) USD – ISM Manufacturing PMI (Mar)
Events N/A
|
| Tuesday, April 4 |
Data NZD – NZIER Business Confidence (Q1) AUD – RBA Interest Rate Decision (Apr) GBP – Construction PMI (Mar) USD – Trade Balance (Feb) CAD – Trade Balance (Feb) Crude Oil – API Weekly Crude Oil Stock
Events AUD – RBA Rate Statement EUR – ECB President Draghi Speaks
|
| Wednesday, April 5 |
Data GBP – Services PMI (Mar) USD – ADP Nonfarm Employment Change (Mar) USD – ISM Non-Manufacturing PMI (Mar) Crude Oil – Crude Oil Inventories
Events USD – FOMC Meeting Minutes
|
| Thursday, April 6 |
Data EUR – German Factory Orders (MoM) (Feb) USD – Initial Jobless Claims CAD – Building Permits (MoM) (Feb)
Events EUR – ECB President Draghi Speaks EUR – ECB Publishes Account of Monetary Policy Meeting
|
|
Friday, April 7
|
Data GBP – Halifax House Price Index (MoM) (Mar) GBP – Manufacturing Production (MoM) (Feb) GBP – Trade Balance (Feb) USD – Nonfarm Payrolls (Mar) USD – Unemployment Rate (Mar) CAD – Employment Change (Mar) Crude Oil – U.S. Baker Hughes Oil Rig Count
Events GBP – BoE Gov Carney Speaks
|
Technical weekly outlook: April 3 – 7
Dollar Index
DOLLAR_INDX, Daily: The dollar index remained traded within a downward channel while currently testing near the resistance level of 100.40. With regards to the MACD histogram which illustrate an upward signal and momentum, a successful closure above 100.40 would suggest the dollar index to extend its gains towards the upper level of the channel.
Resistance level: 100.40, 101.65
Support level: 99.30, 98.30
GBPUSD
GBPUSD, Daily: GBPUSD remains traded within a narrowing triangle while currently testing near the top level of the triangle. A successful breakout from this level would signal a change in trend direction to move further upwards thereafter. Otherwise, a retracement from this level would suggest GBPUSD to be traded lower in short-term, towards the target of support level at 1.2470.
Resistance level: 1.2605, 1.2770
Support level: 1.2470, 1.2380
USDJPY
USDJPY, Daily: USDJPY was traded lower following a retracement from the resistance level of 112.00 due to the downward expansion of moving average line after the formation of death cross. However, as the MACD indicator begins to hover outside of downward momentum, USDJPY is expected to experience brief retracement period within the range of 100.90 and 112.00 in the short-term, before continuing its downward momentum in the long-term.
Resistance level: 112.00, 114.50
Support level: 109.90, 107.85
EURUSD
EURUSD, Daily: EURUSD remains traded within an upward channel following prior retracement from the top level of the channel. Referring to the MACD histogram which illustrates downward signal and momentum, EURUSD is expected to advance further down, towards the bottom level of the channel near the support level of 1.0565.
Resistance level: 1.0705, 1.0820
Support level: 1.0565, 1.0340
GOLD
GOLD_, Daily: Gold price has previously formed a double top formation, indicating a strong resistance level ahead at 1255.25. As both moving average line extends its upward expansion, gold price is expected to move further upwards and retest near the level of 1255.25. A successful breakthrough from this level would suggest gold price to continue its upward momentum.
Resistance level: 1255.25, 1291.30
Support level: 1229.90, 1204.55
Crude Oil
CrudeOIL, Daily: Crude oil price was traded higher following a rebound from the strong support level of 47.15 while concurrently closing above the 20-moving average line (red). With regards to the MACD histogram which illustrates upward signal and momentum, crude oil price is expected to extend its upward momentum after a rebound from the support level of 50.25.
Resistance level: 52.15, 55.20
Support level: 50.25, 48.70
310317 Daily Analysis
31 March 2017 Daily Analysis
Dollar-bull retaliates with firm consumer spending.
US dollar advance further up during Asian trading hours, poised for a weekly gain as solid US economic data buoyed higher expectation for more frequent interest rate hike this year. The dollar index was up 0.13% and last seen at 100.35. Overnight’s revised US gross domestic production reading showed that US fourth quarter growth subside less than expected, underpinned by higher consumer spending that was partially offset by large gain in imports. In other region, euro nursed some losses and was up 0.06% to $1.0683 against the greenback although remained under pressure due to softer inflation data. Both German and Spanish consumer price index showed that inflation wind down more sharply than expected due to slumping oil price, offering some respite to the European Central Bank as it faces further pressure to taper down its monetary stimulus.
Otherwise, crude oil price rose to a three-weeks high of $50.47 after Kuwait backed an extension of OPEC production cut, further catalyzing positivism for an extension during second half of the year. Otherwise, gold price was down 0.31% to $1,241.19 as the greenback remains resilient due to positive US economic data.
Today’s Holiday Market Close
Time Market Event
N/A
Today’s Highlight Event
Time Market Event
N/A
Today’s Highlight Economy Data
| Time | Nation & Data | Previous | Forecast | Actual |
| 09:00 | CNY – Manufacturing PMI (Mar) | 51.6 | 51.6 | 51.8 |
| 16:00 | EUR – German Unemployment Change (Mar) | -14K | -10K | – |
| 16:30 | GBP – GDP (QoQ) (Q4) | 0.7% | 0.7% | – |
| 17:00 | EUR – CPI (YoY) (Mar) | 2.0% | 1.8% | – |
| 20:30 | USD – Personal Spending (MoM) (Feb) | 0.2% | 0.2% | – |
| 20:30 | CAD – GDP (MoM) (Jan) | 0.3% | 0.3% | – |
| 21:45 | USD – Chicago PMI (Mar) | 57.4 | 56.9 | – |
| 22:00 | USD – Michigan Consumer Sentiment (Mar) | 97.6 | 97.6 | – |
| 02:00 | Crude Oil – US Baker Hughes Oil Rig Count | 652 | – | – |
GBPUSD
GBPUSD. H1: GBPUSD was traded higher following a rebound from the support level of 1.2465, concurrent with the formation of golden cross by both moving average line. As both MA line continues to expand upwards, a successful closure above the resistance level of 1.2495 would suggest GBPUSD to extend its upward momentum.
Resistance level: 1.2495, 1.2525
Support level: 1.2465, 1.2430
EURUSD
EURUSD, H4: EURUSD extended its losses following prior breakout from the lower level of upward channel while recently closed below the strong support level of 1.0700. As the downward signal line from MACD histogram continues to expand downwards, EURUSD is expected to advance towards the target of support level at 1.0650.
Resistance level: 1.0700, 1.0745
Support level: 1.0650, 1.0580
USDJPY
USDJPY, H4: USDJPY was traded higher following prior rebound from the 20-moving average line (red) while closing above the strong resistance level of 111.40. With regards to the MACD histogram which continues to illustrate upward signal and momentum, USDJPY is expected to move further upwards after breaking the resistance level of 112.15.
Resistance level: 112.15, 112.80
Support level: 111.40, 110.10
CrudeOIL
CrudeOIL, H4: Crude oil price has recently break out from the top level of sideways channel, signaling a change in trend direction to move further upwards. Referring to the MACD histogram which continues to illustrate upward signal and momentum above the threshold of 0, a closure above the resistance level of 50.40 would suggest crude oil price to move further upwards thereafter.
Resistance level: 50.40, 51.20
Support level: 49.60, 48.60
GOLD
GOLD_, H1: Gold price has recently break out from the bottom level of downward channel, signaling a change in trend direction to move further downwards. It is expected to extend its current losses after successful closing below previous low, near the support level of 1240.60.
Resistance level: 1244.30, 1247.70
Support level: 1240.60, 1236.55
300317 Daily Analysis
30 March 2017 Daily Analysis
Brexit: A prodigious test for EU and UK.
Great British Pound oscillates during Asian trading hours after receiving no clear direction and details from Britain’s formal execution of its exit from the European Union. UK Prime Minister Theresa May invoked the official Brexit procedure yesterday, declaring that there will be no turning back while ushering in a tortuous process that will test the bloc’s cohesion and pitch her country into the unknown. “I think it will continue to trade in sideways until we get a clearer picture on the European Union’s negotiating stance with Britain,” said currency strategist Alvin Tan. May’s six-page Brexit letter was delivered to the European Council President Donald Tusk in which outlay a positive tone to approach for talks although admitting that to reach a comprehensive agreement within two years would be a challenge. Pair of GBP/USD was up 0.10% to $1.2449 as of writing. Concurrently, the dollar index was up 0.07% to 99.85, buoyed by better-than-expected US home sales data while the depreciation of euro and sterling further underpinned the upside of the currency.
Otherwise, crude oil price was up 5 cents to $49.57 a barrel following a lower-than-expected reading of US crude stockpiles. Concurrently, gold price was held steady at $1,250.45, supported by the uncertainties of Britain’s departure from the European Union.
Today’s Holiday Market Close
Time Market Event
N/A
Today’s Highlight Events
Time Market Event
N/A
Today’s Highlight Economy Data
| Time | Nation & Data | Previous | Forecast | Actual |
| 15:00 | EUR – Spanish CPI (YoY) (Mar) | 3.0% | – | – |
| 20:00 | EUR – German CPI (MoM) (Mar) | 0.6% | 0.4% | – |
| 20:30 | USD – GDP (QoQ) (Q4) | 1.9% | 2.0% | – |
| 20:30 | USD – Initial Jobless Claims | 261K | 248K | – |
| 20:30 | CAD – RMPI (MoM) (Feb) | 1.7% | 0.8% | – |
DOLLAR_INDX
DOLLAR_INDX, H4: Dollar index was traded higher following a successful rebound from the 60-moving average line (green) while currently testing near the strong support level of 99.95. Referring to the MACD histogram which continues to illustrate upward signal and momentum, a closure above the level of 99.95 would suggest the dollar index to advance further upwards.
Resistance level: 99.95, 100.35
Support level: 99.45, 98.60
GBPUSD
GBPUSD, H1: GBPUSD was traded higher following prior closure above the 20-moving average line (red) while currently testing near the support level of 1.2430. With regards to the MACD histogram which illustrates upward signal and momentum above the threshold of 0, a rebound form the level of 1.2430 would suggest GBPUSD to advance towards the target of resistance level at 1.2465.
Resistance level: 1.2465, 1.2495
Support level: 1.2430, 1.2375
EURUSD
EURUSD, H4: EURUSD has recently broke out from the bottom level of upward channel, signalling a change in trend direction to move further downwards. As the downward signal from MACD histogram continues to expand downwards, EURUSD is expected to extend its losses after breaking the support level of 1.0745.
Resistance level: 1.0805, 1.0905
Support level: 1.0745, 1.0700
USDJPY
USDJPY, H4: USDJPY was traded higher following prior rebound near the support level of 110.70 while currently testing at the strong resistance level of 111.40. As the MACD histogram continues to illustrate and upward signal and momentum, a closure above the level of 111.40 would suggest USDJPY to extend its upward momentum.
Resistance level: 111.40, 112.15
Support level: 110.70, 110.10
CrudeOIL
CrudeOIL, H4: Crude oil price remains traded within the sideways channel while currently testing at the top level of the channel. A breakout from this level would signal a change in trend direction for crude oil price to move further upwards. Otherwise, a retrace from this level may suggest crude oil price to be traded lower within the sideways channel in short-term thereafter.
Resistance level: 49.60, 50.10
Support level: 49.00, 48.45, 47.85, 47.10
GOLD
GOLD_, H1: Gold price continued to be traded within a downward channel following prior retracement from the resistance level of 1253.25. Recent closure below the strong support level of 1250.90 suggests gold price to advance further down, towards the support level of 1248.50.
Resistance level: 1250.90, 1253.25
Support level: 1248.50, 1245.15
290317 Daily Analysis
29 March 2017 Daily Analysis
Brexit approaches, sterling engulfed.
Great British Pound extends its second day of losses as market participants look ahead to UK’s formal call in pledging a split from the European Union later in the day, a historical moment where British Prime Minister Theresa May will outline her Brexit terms and details. Pairing of GBP/USD was down 0.30% to $1.2410, not far from one-week low of $1.2373. Further pressure was placed on the sterling after Bank of England’s interest rate setter Ian McCafferty highlighted weaker outlook for the economy while stating his indecision to vote for an interest hike during the upcoming BoE meeting in May. In the other region, the greenback pulls further away from 4-1/2 months low following a better-than-expected consumer confidence data that has backed up higher expectation for more interest rate hike this year. Analyst postulate that overall optimism for Trumponomics supersedes prior disappointment of passing an Obamacare reform bill, prompting further support on the dollar thus far. The dollar index was held steady at 99.48 this morning.
As for commodities, crude oil price was up 0.39% to $48.56 following an oil output disruption in Libya while investors shrugged off a larger-than-expected build in US crude inventories. Otherwise, gold price was down 0.53% to $1,248.69 as investors await further details on Brexit later in the day.
Today’s Holiday Market Close
Time Market Event
N/A
Today’s Highlight Events
Time Market Event
N/A
Today’s Highlight Economy Data
| Time | Nation & Data | Previous | Forecast | Actual |
| 16:30 | GBP – Net Lending to Individuals | 4.8B | 4.9B | – |
| 22:00 | USD – Pending Home Sales (MoM) (Feb) | -2.8% | 2.4% | – |
| 22:30 | Crude Oil – Crude Oil Inventories | 4.954M | 1.357M | – |
GBPUSD
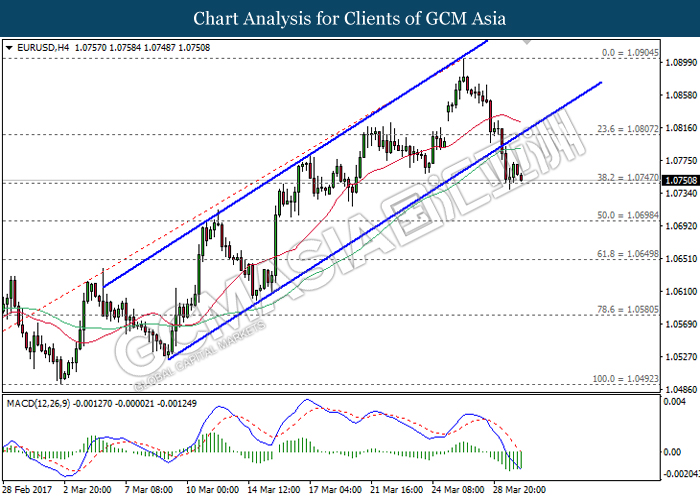
GBPUSD, H4: GBPUSD extended its losses consecutively following previous retracement from the resistance level of 1.2615 while closing below both moving average line. With regards to the downward signal from MACD histogram which continues to expand downwards, it is expected to move further down after a successful closure below the support level of 1.2360.
Resistance level: 1.2420, 1.2495
Support level: 1.2360, 1.2300
EURUSD
EURUSD, H4: EURUSD was traded lower following a retrace from previous high at 1.0905 while currently testing at the support level of 1.0805. As the MACD indicator continues to drift outside of upward momentum, EURUSD is expected to extend its technical correction and to be traded lower in short-term. Otherwise, long-term trend direction still suggests an extension of uptrend.
Resistance level: 1.0850, 1.0905
Support level: 1.0805, 1.0745
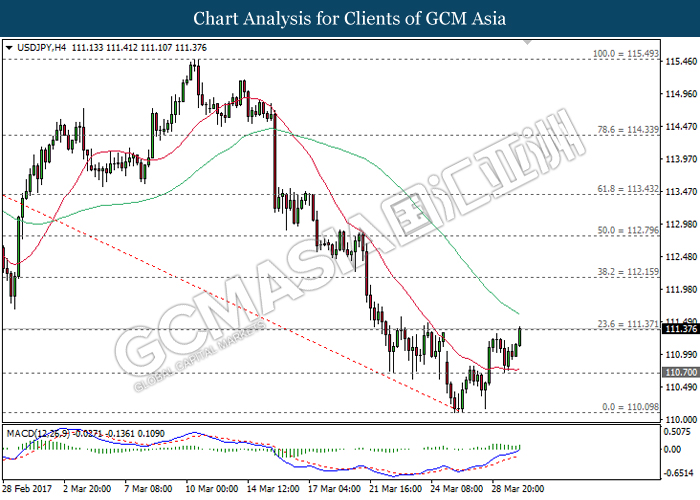
USDJPY
USDJPY, H1: USDJPY was traded higher following prior rebound from the support level of 110.10 while both moving average line formed a golden cross. Referring to the MACD histogram which illustrates upward signal and momentum, USDJPY is expected to extend its gains towards the next target at resistance level of 111.50.
Resistance level: 114.50, 111.80
Support level: 111.15, 110.75
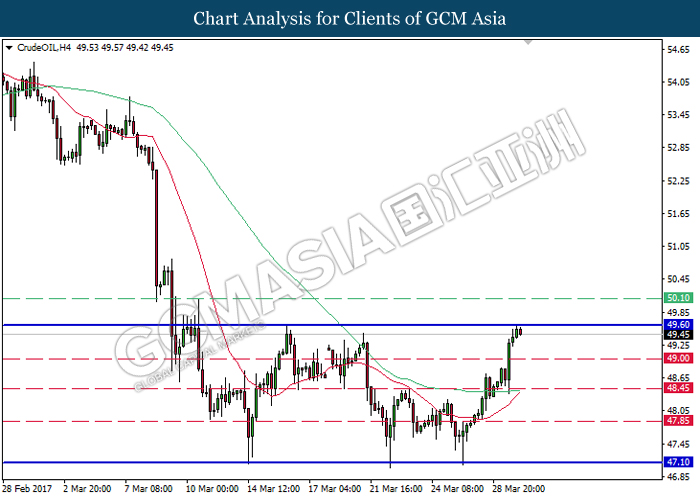
CrudeOIL
CrudeOIL, H4: Crude oil price remains traded within a sideways channel while currently testing near the support level of 48.45. A successful rebound from 48.45 would suggest crude oil price to move further upwards, towards the upper level of the channel in short-term. Otherwise, long-term trend direction could only be determined after a breakout from either side of the channel.
Resistance level: 49.45, 50.10
Support level: 48.45, 47.85, 47.10
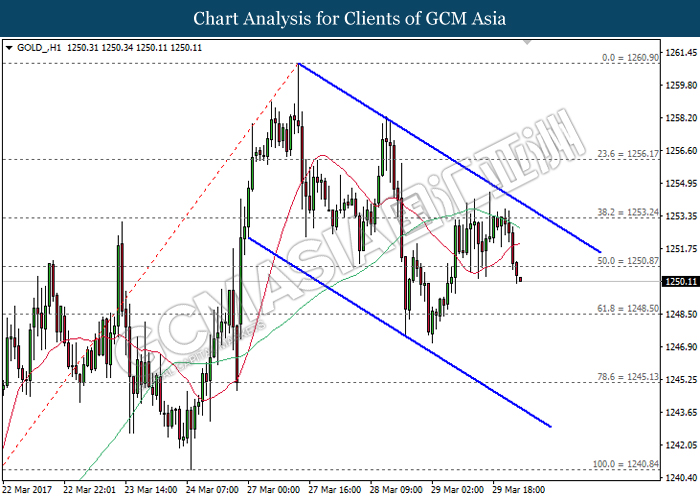
GOLD
GOLD_, H1: Gold price was traded lower following prior formation of death cross by both moving average line while currently testing at the support level of 1247.85. As the downward signal line from MACD histogram continues to expand downwards, gold price is expected to extend its downward momentum after breaking the support level of 1247.85.
Resistance level: 1252.80, 1260.90
Support level: 1247.85, 1243.80
280317 Daily Analysis
28 March 2017 Daily Analysis
Greenback limps as Trumpflation deflates.
Euro retreats from previous four and a half months’ peak of $1.0906 following a slight rebound of the greenback during early Asian session. Previously, the common currency was boosted when German Chancellor Angela Markel’s conservative won a regional election, dealing a setback to the Social Democrat rivals while boosting her prospect to win the fourth-term in September’s national election. Additionally, yesterday’s German Ifo Index shows a better-than-expected reading, placing some limit to the overall downside of the currency. Pairing of EUR/USD was down 0.03% and last quoted at $1.0861. On the other hand, the greenback hobbles away from multi-months low after opening the week with a wide gap as market participants react towards last Friday’s healthcare bill debacle. Trump administrations are now under investor’s skepticism over its ability to pass on other bills such as tax reform and infrastructure spending through the government. Likewise, the dollar index ticked up 0.05% to 98.96 this morning.
In the commodities market, crude oil price rebounded in Asia while industry data on US inventories is expected to set the near-term market tone. Otherwise, gold price was traded flat at $1,254.80 as investors ponder upon US politics that surrounds Trump administration.
Today’s Holiday Market Close
Time Market Event
N/A
Today’s Highlight Events
Time Market Event
22:10 CAD BoC Gov Poloz Speaks
00:50 USD Fed Chair Yellen Speaks
Today’s Highlight Economy Data
| Time | Nation & Data | Previous | Forecast | Actual |
| 22:00 | USD – CB Consumer Confidence (Mar) | 114.8 | 114.0 | – |
| 04:30 | Crude Oil – API Weekly Crude Oil Stock | 4.500M | – | – |
GBPUSD
GBPUSD, H1: GBPUSD was traded lower following prior retrace from previous high of 1.2615 while currently testing below the 20-moving average line (red). As the MACD indicator remains hovered outside of upward momentum, GBPUSD is expected to be traded lower in the short-term as technical correction. Otherwise, long-term trend direction suggests GBPUSD to extend its upward momentum.
Resistance level: 1.2580, 1.2615
Support level: 1.2550, 1.2510
EURUSD
EURUSD, H4: EURUSD was traded lower following previous retracement while currently testing near the resistance level of 1.0870. As the upward signal line from MACD histogram begins to narrow sideways, EURUSD may be traded lower in the short-term as technical correction. Otherwise, long-term trend direction suggests EURUSD to extend its prior uptrend.
Resistance level: 1.0870, 1.0920
Support level: 1.0825, 1.0775
USDJPY
USDJPY, H1: USDJPY was traded lower following prior retrace form the resistance level of 110.80 while currently testing in between both moving average line. A successful closure below the 20-moving average line (red) would suggest USDJPY to advance further down, towards the target of support level at 110.10.
Resistance level: 110.80, 111.55
Support level: 110.10, 109.45
CrudeOIL
CrudeOIL, H1: Crude oil price was traded higher following prior rebound form the support level of 47.50 while currently testing near the resistance level of 48.00. With regards to the MACD histogram which illustrate upward signal and momentum, a closure above the level of 48.00 would suggest crude oil price to extend its upward momentum.
Resistance level: 48.00, 48.45
Support level: 47.50, 47.00
GOLD
GOLD_, H4: Gold price was traded lower following a retrace from previous high of 1260.00. Referring to the MACD indicator which begins to hover outside of upward momentum, gold price is expected to experience brief retracement period and to be traded lower in the short-term. Long-term trend direction suggests the extension of prior uptrend.
Resistance level: 1260.00, 1269.10
Support level: 1250.30, 1240.80
270317 Weekly Analysis
27 March 2017 Weekly Analysis
GCMAsia weekly report: March 27 – 31
Market Review (Forex): March 20 – 24
U.S. Dollar
US dollar hovered near four-months low after Republican leaders dropped legislation to replace the Affordable Care Act before a planned vote, in a setback to the US President Donald Trump. The dollar index was a little changed last Friday at 99.59, not far from four-months trough of 99.36. Republican leaders pulled the legislation to overhaul the US healthcare system before a vote in the House of Representatives after it failed to garner enough support for the bill.
The defeat has added more doubts over Trump administration’s ability to push through pro-growth economic agenda that was previously promised during his election campaign. Investors view the Trump administration’s failure to push healthcare legislation overhaul is a signal that he may face further setbacks in delivering other policy pledges that may include corporate tax cuts, regulatory reform and infrastructure spending.
USD/JPY
Dollar was up against the safe-haven Yen, with pair of USD/JPY rose 0.4% to 111.36 during late Friday trading, pulling away from its lowest level since November 23rd at 110.63. For the week, the pair was down 1.16%.
EUR/USD
Euro was slightly higher against the greenback, up 0.14% to $1.0797.
GBP/USD
Great British Pound was slightly lower with the pair of GBP/USD down 0.38% to $1.2472 as investors braced for Britain to begin the process of exiting EU on March 29.
Market Review (Commodities): March 20 – 24
GOLD
Gold prices trims some earlier gains on late Friday while notched up a second weekly rise as concerns over Trump administration’s ability to push through its pro-growth economic agenda has underpinned the demand for safe-haven bullion. Gold price for April delivery was down 0.34% and was last quoted at $1,243.00, not far from session high of $1,251.85. Gold priced touched its highest level since February 28th at $1,253.15 while ended the week with a gain of 1.07%.
Price of the yellow metal turned lower as the dollar steadied after Republican leaders dropped legislation to replace the Affordable Care Act before a planned vote in the House of Representatives after it failed to garner enough support to pass. A stronger dollar usually weights on gold price as it dampens the metal’s appeal as alternative asset while dollar-priced commodities will become more expensive for holders of other currencies.
Crude Oil
Oil futures settled higher on Friday albeit posting a weekly loss of almost 2% as the market remained divided between rising shale production and record high stockpiles in the US against the efforts by major oil producers to cut their daily output in order to reduce an oversupply glut. Crude oil price inched up 27 cents or 0.6% to $47.97 per barrel during late Friday trading, snapping out from a fourth consecutive session of losses. For the week, crude oil price was down 81 cents or 1.7%, its third weekly loss in a month.
Data from oilfield services provider Baker Hughes last Friday revealed that the number of active US oil rigs rose 21 last week, its tenth weekly increase while the total count rise to 652, its highest since September 2015. Meanwhile, the US Energy Information Administration reported that the crude oil inventories rose by 4.95 million barrels last week, sending total inventories to an all-time high of 533.1 million thus far, adding further concerns towards global supply glut. Oil prices has fallen sharply this month amid concerns of ongoing rebound in US shale production could undermined efforts by other major producers in rebalancing global supply and demand.
U.S. Baker Hughes Oil Rig Count
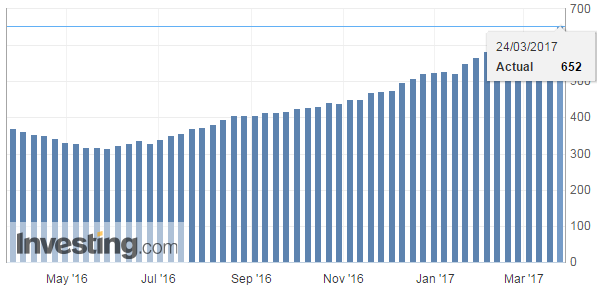
Oilfield services provider Baker Hughes reported that U.S. active oil rig count increased by 21 to 652 last week.
U.S. Crude Oil Stocks Change
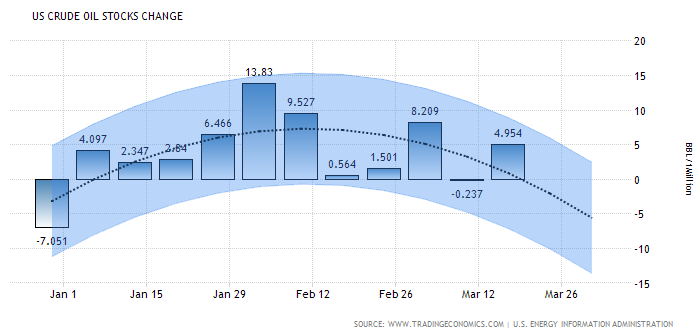
—– Forecast
Energy Information Administration reported a swell in crude inventories by 4.954 million barrels last week, sending total inventories to a record high of 533.1 million barrels.
Weekly Outlook: March 27 – 31
For the week, investors will continue to monitor political developments in the United States, with Trump’s promised tax reforms to be the main limelight. Market watchers will also be looking into US economic reports which includes reading on personal income and spending while side-lined by a number of appearance of Fed officials.
As for oil traders, they will eye on fresh weekly information on US stockpiles of crude which will be released on Wednesday for further indication of demand from world’s largest oil consumer. Otherwise, they will also pay close attention to comments from global oil producers for further evidence of their compliance to reduce output this year.
Highlighted economy data and events for the week: March 27 – 31
| Monday, March 27 |
Data EUR – German Ifo Business Climate Index (Mar)
Events N/A
|
| Tuesday, March 28 |
Data USD – CB Consumer Confidence (Mar) Crude Oil – API Weekly Crude Oil Stock
Events CAD – BoC Gov Poloz Speaks USD – Fed Chair Yellen Speaks
|
| Wednesday, March 29 |
Data GBP – Net Lending to Individuals USD – Pending Home Sales (MoM) (Feb) Crude Oil – Crude Oil Inventories
Events N/A
|
| Thursday, March 30 |
Data EUR – Spanish CPI (MoM) (Mar) EUR – German CPI (MoM) (Mar) USD – GDP (QoQ) (Q4) USD – Initial Jobless Claims CAD – RMPI (MoM) (Feb)
Events N/A
|
|
Friday, March 31
|
Data JPY – Household Spending (MoM) (Feb) JPY – National Core CPI (YoY) (Feb) NZD – ANZ Business Confidence (Mar) CNY – Manufacturing PMI (Mar) EUR – German Retail Sales (MoM) (Feb) EUR – German Unemployment Change (Mar) GBP – Current Account (Q4) GBP – GDP (QoQ) (Q4) EUR – CPI (YoY) (Mar) USD – Personal Income (MoM) (Feb) USD – Personal Spending (MoM) (Feb) CAD – GDP (MoM) (Jan) USD – Chicago PMI (Mar) USD – Michigan Consumer Sentiment (Mar) Crude Oil – U.S. Baker Hughes Oil Rig Count
Events N/A
|
Technical weekly outlook: March 27 – 31
Dollar Index
DOLLAR_INDX, Daily: The dollar index has recently opened below the key neckline of head and shoulder formation of 99.30, signaling a change in trend direction to move further downwards. With regards to the MACD histogram which illustrate downward signal and momentum, it is expected to advance further down towards the target of support level at 98.30.
Resistance level: 99.30, 100.40
Support level: 98.30, 96.80
GBPUSD
GBPUSD, Daily: GBPUSD remains traded within a narrow triangle following prior rebound from the bottom level of the triangle while closing above both moving average line. It is suggested to continue advancing further up, towards the upper level of the triangle in short-term. Long-term trend direction could only be determined after a successful breakout from either side of the triangle.
Resistance level: 1.2605, 1.2775
Support level: 1.2470, 1.2380
USDJPY
USDJPY, Daily: USDJPY has extended its losses following prior breakout from the lower level of sideways channel, signifying a change in trend direction to move further downwards. As the downward signal from MACD histogram continues to expand downwards, a successful closure below the support level of 109.90 would suggest USDJPY to extend its downward momentum thereafter.
Resistance level: 111.65, 113.50, 115.55
Support level: 109.90, 108.45
EURUSD
EURUSD, Daily: EURUSD opened the week above the key neckline of inverse head and shoulders formation of 1.0820, signaling a change in trend direction to move further upwards. As the MACD histogram continues to illustrate upward signal while coupled with recent golden cross formation from both MA lines, EURUSD is expected to advance further up, towards the next target of resistance level at 1.0930.
Resistance level: 1.0930, 1.1090
Support level: 1.0820, 1.0705
GOLD
GOLD_, Daily: Gold price extended its gains following prior rebound from the 20-moving average line (red). Referring to the upward signal from MACD histogram which continues to expand upwards, gold price is expected advance further up after breaking the strong resistance level of 1255.25.
Resistance level: 1255.55, 1291.30
Support level: 1229.90, 1204.55
Crude Oil
CrudeOIL, Daily: Crude oil price continues to be traded within the range of 47.15 and 48.70 following previous plunge due to the formation of death cross by both moving average line. With regards to the MACD indicator which continues to hover outside of downward momentum, crude oil price is expected to extend its brief retracement period to hover within the range of 47.15 and 48.70 in the short-term. Otherwise, long-term direction still suggests crude oil price to extend its downward momentum.
Resistance level: 48.70, 50.25
Support level: 47.15, 45.00
240317 Daily Analysis
24 March 2017 Daily Analysis
Dollar-bull dominates ahead of Congress vote.
Greenback remained resilient during early Asian hours as a dramatic inter-party showdown looms the US later tonight where final votes will be tallied in order to replace Obama-era’s healthcare law after falling short during yesterday’s Congress. Republican leaders failed to garner enough support to pass the amendment bill and instead focusing on other priorities and leaving the Obamacare in place for now. Investors’ will place their focus on Trump’s ability to allow other key policies to pass through the Congress such as tax reform while final vote on the healthcare bill would remain as the key event for tonight. The dollar index was up 0.16% and last seen at 99.92 this morning. Otherwise, pound sterling edged slightly lower, down 0.27% to 1.2487. Sterling was under pressure after Bank of England’s member Gertjan Vlieghe gave dovish comments where he believes that higher inflation does not necessarily reflect to an interest rate hike.
In the commodities market, crude oil price edges up, supported by a draw in Saudi exports to the United States while still remain pressured as investors ponder for further market indication on US shale industry. Gold price was down 0.1% to $1,243.60 amid firmer dollar ahead of Congress vote during North American session.
Today’s Holiday Market Close
Time Market Event
N/A
Today’s Highlight Event
Time Market Event
N/A
Today’s Highlight Economy Data
| Time | Nation & Data | Previous | Forecast | Actual |
| 05:45 | NZD – Trade Balance (MoM) (Feb) | -257M | 160M | -18M |
| 16:30 | EUR – German Manufacturing PMI (Mar) | 56.8 | 56.5 | – |
| 20:30 | USD – Core Durable Goods Orders (MoM) (Feb) | 0.0% | 0.5% | – |
| 20:30 | CAD – CPI (MoM) (Feb) | 0.5% | – | – |
| 02:00 | Crude Oil – Baker Hughes Oil Rig Count | 631 | – | – |
GBPUSD
GBPUSD, H1: GBPUSD was traded lower following a retrace from the previous high of 1.2530 while recently testing near the 60-moving average line (green). A successful closure below this line would suggest GBPUSD to advance further down towards the target support level of 1.2460.
Resistance level: 1.2500, 1.2530
Support level: 1.2460, 1.2430
EURUSD
EURUSD, H4: EURUSD was traded lower following prior retracement from the resistance level of 1.0820 while recently closing below the 20-moving average line (red). With regards to the MACD histogram which illustrates downward signal and momentum, a closure below the support level of 1.0760 would suggest EURUSD to move further downwards thereafter.
Resistance level: 1.0820, 1.0860
Support level: 1.0760, 1.0715
USDJPY
USDJPY, H1: USDJPY was traded higher following prior closure above both moving average line. Referring to the indicator from MACD which continues to hover outside of downward momentum, USDJPY may extend its retracement period and continue to be traded higher in the short-term. Otherwise, long-term trend direction still suggests the extension of downtrend.
Resistance level: 111.55, 112.15
Support level: 111.10, 110.60
CrudeOIL
CrudeOIL, H1: Crude oil price was traded lower following a retracement before the 20-moving average line (red). However, as the downward signal line in MACD histogram continues to narrow sideways, crude oil price may be traded higher in the short-term as technical correction. Otherwise, long-term trend direction still suggests an ongoing downtrend as both moving average line extends its expansion while heading downwards.
Resistance level: 47.95, 48.25
Support level: 47.55, 47.25
GOLD
GOLD_, H1: Gold price was traded lower following prior retracement from the 20-moving average line. As the MACD histogram continues to illustrate downward signal while both moving average line continues to narrow upwards and may form an imminent death cross, gold price is expected to extend its losses after breaking the support level of 1242.55.
Resistance level: 1248.20, 1253.00
Support level: 1242.55, 1237.00
230317 Daily Analysis
23 March 2017 Daily Analysis
Sterling flats following terrorism fright.
Great British Pound drifted lower this morning following overnight’s terrorist incident near the House of Parliament in London where five people were killed and forty others were injured. The initial reports drove sterling to daily lows against the dollar and euro, while subsequent development emerged that the assailant had been shot dead and no further reports of other separate incidents has further supported the sterling to be traded flat for the day. Pairing of GBP/USD was down 0.10% to $1.2472 during Asian trading hours. Otherwise, the greenback nudged up from seven-weeks low while upside remains limited as investors questioned the progress of US President Donald Trump’s economic policies ahead of a key House vote later today. Furthermore, overnight’s weaker-than-expected existing home sales has added further pressure to the downside. Dollar index was up 0.13% and last quoted at 99.55.
As for the commodities, crude oil price rebounded in Asia as market shrugged off downbeat supply data which has increased by 5 million barrels last week. Meanwhile, gold price eases by 0.19% to $1,246.89 as market participants look over to US politics over healthcare for further risk direction.
Today’s Holiday Market Close
Time Market Event
N/A
Today’s Highlight Events
Time Market Event
20:45 USD Fed Chair Yellen Speaks
Today’s Highlight Economy Data
| Time | Nation & Data | Previous | Forecast | Actual |
| 17:30 | GBP – Retail Sales (MoM) (Feb) | -0.3% | 0.4% | – |
| 20:30 | USD – Initial Jobless Claims | 241K | 240K | – |
| 22:00 | USD – New Home Sales (Feb) | 555K | 565K | – |
GBPUSD
GBPUSD, H1: GBPUSD was traded higher following recent rebound from the 20-moving average line (red). It is expected to advance further upwards and retest at the strong resistance level of 1.2500. A closure above this level would signal the extension of upward momentum for GBPUSD.
Resistance level: 1.2550, 1.2500
Support level: 1.2435, 1.2380
EURUSD
EURUSD, Daily: EURUSD has shaped a head and shoulders formation while recently it has retraced from the neckline of 1.0820. In the short-term, EURUSD is expected to drift lower as brief technical correction. Otherwise, long-term trend direction suggests EURUSD to advance further up and retest near the neckline of 1.0820.
Resistance level: 1.0820, 1.0945, 1.1040
Support level: 1.0700, 1.0565, 1.0335
USDJPY
USDJPY, H4: USDJPY was traded higher following a successful rebound near the support level of 100.70. With regards to the downward signal line from MACD histogram which begins narrow upwards, USDJPY is expected to be traded higher in the short-term as technical correction. Otherwise, long-term trend direction still suggests USDJPY to extend its downtrend due to downward expansion of both MA lines.
Resistance level: 114.85, 112.55
Support level: 110.70, 110.15
CrudeOIL
CrudeOIL, H4: Crude oil price has shaped a double bottom formation following prior rebound from the strong support level near 47.10. A successful closure above the resistance level of 48.45 would suggest crude oil price to advance towards the neckline at 49.45 thereafter.
Resistance level: 48.45, 49.45, 50.10
Support level: 47.85, 47.10, 46.50
GOLD
GOLD_, H4: Gold price was traded lower following prior unsuccessful attempt to close higher than the strong resistance level of 1250.00. Thus, recent retracement would suggest gold price to experience brief retracement period and could be traded lower in the short-term. Long-term trend direction still suggests gold price to extend its uptrend due to upward expansion of both MA lines.
Resistance level: 1250.00, 1260.10
Support level: 1238.40, 1224.60
220317 Daily Analysis
22 March 2017 Daily Analysis
Greenback in focus as Fed member speaks.
Greenback drifts higher in Asia as market participants noted hawkish view from a key Fed policymaker concerning future interest hike outlook. Cleveland Fed President Loretta Mester postulate that she envisions more than three rate hike for this year as the economy is estimated to be stronger than median forecast. As of this morning, the dollar index was held steady around 99.58, halting overnight’s slump after being dragged down by stronger pound and euro. In other region, euro depreciates by 0.10% to $1.0799 against the dollar counterpart as investors begin to cash in their profits after reaching seven-weeks high of $1.0819. The common currency received broad support amid growing optimism over centrist Emmanuel Macron fending off its main opponent, Marine Le Pen during first round of French presidential election.
Otherwise, crude oil price dipped 8 cents to $48.16 a barrel following a larger-than-expected swell in US crude stockpiles by 4.53 million barrels last week. Concurrently, gold price was down 0.10% to $1,244.82 during Asian trading hours as investors begin to cash in their profit after surging 1.18% overnight.
Today’s Holiday Market Close
Time Market Event
N/A
Today’s Highlight Events
Time Market Event
04:00 NZD RBNZ Rate Statement
Today’s Highlight Economy Data
| Time | Nation & Data | Previous | Forecast | Actual |
| 22:00 | USD – Existing Home Sales (Feb) | 5.69M | 5.57M | – |
| 22:30 | Crude Oil – Crude Oil Inventories | -0.237M | 2.801M | – |
| 04:00 | NZD – RBNZ Interest rate Decision | 1.75% | 1.75% | – |
DOLLAR_INDX
DOLLAR_INDX, Daily: Dollar index has recently formed a head and shoulder formation following prior retracement from the resistance level at 101.60. Currently, it is testing at the neckline of support level at 99.40. A successful closure below this level would suggest an extension of downward momentum towards the next target of support level at 98.20. Otherwise, a rebound from the neckline would suggest dollar index to be traded higher in the short-term thereafter.
Resistance level: 100.55, 101.60, 103.80
Support level: 99.40, 98.20, 96.90
GBPUSD
GBPUSD, H4: GBPUSD advanced higher following prior rebound from the 20-moving average line (red). With regards to the MACD histogram which illustrates upward signal and momentum while both moving average line continues its upward expansion after the formation of golden cross, GBPUSD is expected to extend its uptrend after a closure above the resistance level of 1.2505.
Resistance level: 1.2505, 1.2570
Support level: 1.2450, 1.2380
EURUSD
EURUSD, H1: EURUSD was traded lower following a retrace from the strong resistance level of 1.0820. Referring to the MACD histogram, recent formation of downward signal and momentum suggests EURUSD to be traded lower, towards the target of support level at 1.0775.
Resistance level: 1.0820, 1.0860
Support level: 1.0775, 1.0730
USDJPY
USDJPY, H1: USDJPY has extended its losses following prior closure below the strong support level at 112.45. Referring to both moving average line which continues to expand downwards after the formation of death cross, USDJPY is expected to extend its downtrend after breaking the support level of 111.40.
Resistance level: 111.95, 112.45
Support level: 111.40, 110.90
CrudeOIL
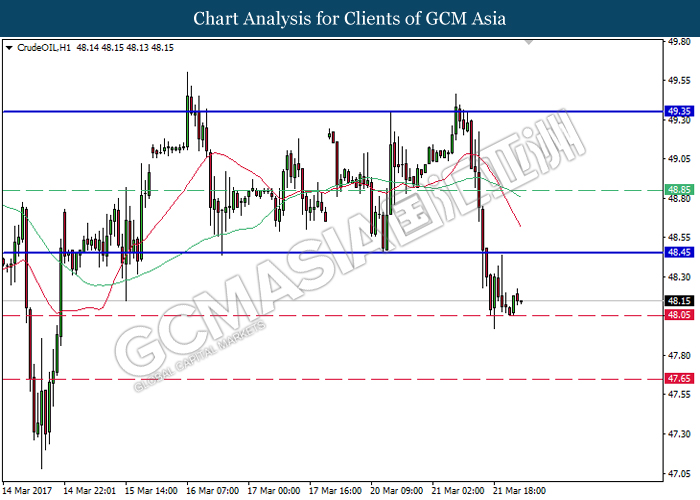
CrudeOIL, H1: Crude oil price has recently breakout from the bottom level of sideways channel, signaling a change in trend direction to move further downwards. As both moving average line extends its downward expansion after the formation of death cross, it is expected to move further down after a successful closure below the strong support level of 48.05.
Resistance level: 48.45, 48.85, 49.35
Support level: 48.05, 47.65
GOLD
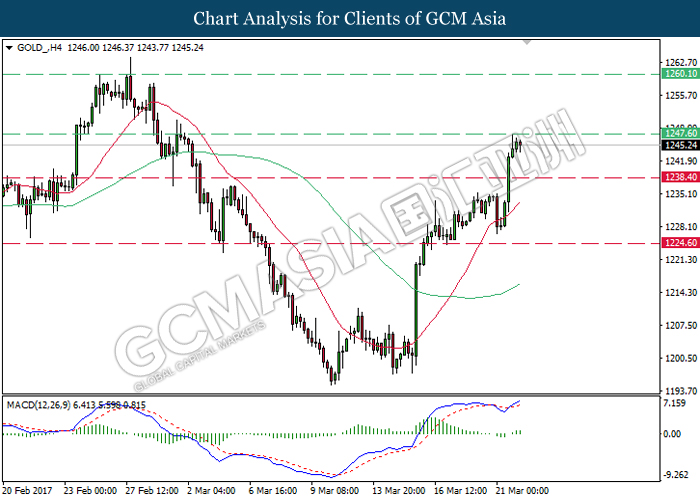
GOLD_, H4: Gold price extended its uptrend following prior rebound from the 20-moving average line (red). Referring to the MACD histogram which illustrates upward signal and momentum above the threshold of 0, gold price is expected to move further upwards after a successful breakthrough from the resistance level of 1247.60.
Resistance level: 1247.60, 1260.10
Support level: 1238.40, 1224.60